the Creative Commons Attribution 3.0 License.
the Creative Commons Attribution 3.0 License.
Potential impact of climate change to the future streamflow of Yellow River Basin based on CMIP5 data
Xiaoli Yang
Weifei Zheng
Liliang Ren
Mengru Zhang
Yuqian Wang
Yi Liu
Fei Yuan
Shanhu Jiang
The Yellow River Basin (YRB) is the largest river basin in northern China, which has suffering water scarcity and drought hazard for many years. Therefore, assessments the potential impacts of climate change on the future streamflow in this basin is very important for local policy and planning on food security. In this study, based on the observations of 101 meteorological stations in YRB, equidistant CDF matching (EDCDFm) statistical downscaling approach was applied to eight climate models under two emissions scenarios (RCP4.5 and RCP8.5) from phase five of the Coupled Model Intercomparison Project (CMIP5). Variable infiltration capacity (VIC) model with 0.25∘ × 0.25∘ spatial resolution was developed based on downscaled fields for simulating streamflow in the future period over YRB. The results show that with the global warming trend, the annual streamflow will reduced about 10 % during the period of 2021–2050, compared to the base period of 1961–1990 in YRB. There should be suitable water resources planning to meet the demands of growing populations and future climate changing in this region.


Climate change through the temperature, precipitation, evaporation and other factors to change the impact of hydrological circulation system, leading to different spatial and temporal scale of water redistribution (Stocker, 2013).With the global climate changes, both the precipitation and runoff in Yellow River Basin (YRB) present obviously decreasing, while the water shortage of the Yellow River basin will likely be intensifying with the economic development (Wang et al., 2011; Hao et al., 2011; Duan et al., 2014). Meanwhile, YRB is well known not only for its history and large drainage area but also for its frequent floods and serious droughts. So, it is important to analysis climate change and its impact on the hydrological process in YRB.
The global climate models (GCMs) driving hydrological models to calculate watershed hydrological conditions is a common means of studying the effects of climate change on water resources (Zhang and Wang, 2007). However, the coarse resolution makes GCMs' simulation of regional and extreme weather events accuracy is not high (Xu et al., 2010). Downscaling technology is a bridge that connects GCMs low-resolution output to high-resolution meteorological elements for hydrological model (Wilby et al., 2002). Statistical downscaling methods are widely used for easy to construct, diverse methods, and flexible form (Tareghian and Rasmussen, 2013; Murphy, 2000). Li et al. (2010) proposed an equidistant cumulative distribution function matching method (EDCDFm) based on the quantile function method, which consider the differences between the projected climatic factors and the historical statistical cumulative distribution of climatic factors. This method can effectively capture the extreme elements of climate factors, improving the simulation accuracy of climate factors (Wang and Chen, 2014; Aloysius et al., 2016). In this study, the EDCDFm was used to downscale eight models published in the phase five of the Coupled Model Intercomparison Project (CMIP5) of the GCMs over the YRB from 1961 to 2099 under RCP4.5 and RCP8.5 two emission scenarios. The performances of downscaled monthly precipitation and temperature of the climate model were analyzed against to the observation data during the historical period (1961–2005). Based on the observation data and downscaled data, the variable infiltration capacity (VIC) hydrological model with 0.25∘ × 0.25∘ grid spatial resolution of the YRB was constructed. The Mann-Kendall trend test was used to analyze the trend of simulated streamflow.
2.1 Study area and data set
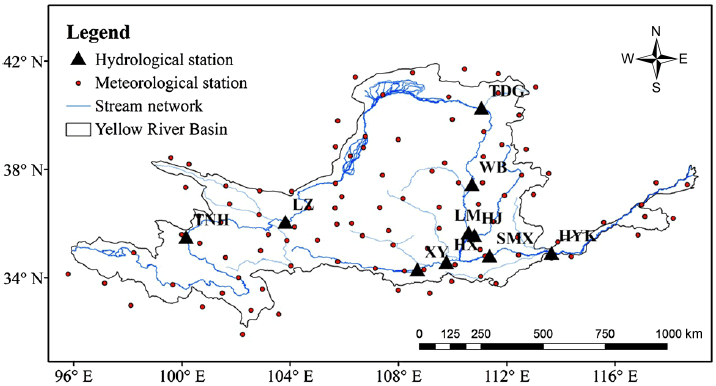
As the second longest river in China , YRB is an important agricultural production base in China, which locates in 32–42∘ N and 94–119∘ E. YRB has a complex surface, large heterogeneity of surface vegetation, which is sensitive to climate change and human disturbance. The annual temperature in YRB has an obviously spatial uneven, which is higher in the southeast but lower in the northwest. The precipitation mainly occurs in summer rains more, southeast rainy, northwest drought, plain precipitation is more than plateau, mountain is more than basin. The whole basin was divided into ten sub-catchments (Fig. 1), including seven catchments: Tangnaihai (TNH), Lanzhou (LZ), Toudaoguai (TDG), Hejin (HJ), Sanmenxia (SMX) and Huayuankou (HYK) with their control stations in the trunk stream, two tributary catchments Xianyang (XY) and Huaxian (HX) and an interior drainage area (located in northern YRB between Wubao (WB) and Longmen (LM) catchments).
We collected observation data (monthly precipitation and monthly values of mean, minimum, and maximum surface air temperature) of 101 weather stations in the YRB for the period of 1961–2005, from China Meteorological Data Service Center (CMDC) (http://data.cma.cn/). The meteorological stations' data was interpolated to interpolate at a spatial resolution of 0.25∘ × 0.25∘ using kriging method and the temperature adjusted for differences in elevation between the two grids taking into account the lapse rate of −0.65 ∘C for every 100 m increase in elevation. The daily streamflow data of ten hydrological stations were collected from the “China Year Books of Hydrology”.
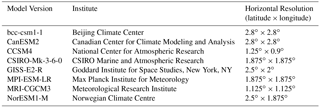
Eight climate models for the climate change projections under the RCP4.5 and RCP8.5 scenarios (Table 1) downloaded from the Program on Climate Model Diagnosis and Intercomparison (PCMDI) website (https://esgf-node.llnl.gov/search/cmip5/). All the historical simulations are for the period of 1961 to 2005 according to the observed data time series, and the future projects of RCP45 and RCP85 cover the period of 2006–2099. Because of the difference of each climate model horizontal resolution, we used bilinear interpolation to make all the GCM climate fields at same spatial resolution (0.25∘ × 0.25∘) with the observations.
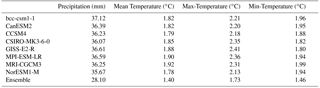
Table 2The RMSE of monthly precipitation and temperature between observed and downscaled model simulated in YRB from 1961–2005.
2.2 Equidistant quantile-based mapping method
The equidistant CDF matching (EDCDFm) statistical downscaling method developed by Li et al. (2010) was applied to bias correct the monthly precipitation and temperature fields from eight CMIP5 models in YRB. EDCDFm uses the differences between the GCMs simulate climate factors and cumulative distribution characteristics of regional observation climate to deviation correction about the climate, which is simulated by climate models. Compared the standard quantile-based mapping method (CDF), the EDCDFm can capture the extreme climate effectively, improving internal error climate model data and the limitation of the application of the method of interpolation, and then improve the accuracy of the climate simulation (Eq. 1). In this study, we applied this method first to correct the biases in the historical period (1961–2005) and then to the future period (2006–2099) for each model.
where F is the CDF of either the observations (o) or model (m) for a historic training period, current climate period (c) or future projection period (p).
2.3 Evaluation of model performance
Root mean square error (RMSE) and correlation coefficient (CC) were used to evaluate the downscaled model performance against to the observations. The RMSE and CC between a model-simulated and observation climate fields are defined as:
and,
Where M, O, , are the simulated fields, observation fields, and mean of simulated fields, mean of observation fields, respectively. i is the number of spatial grid cells.
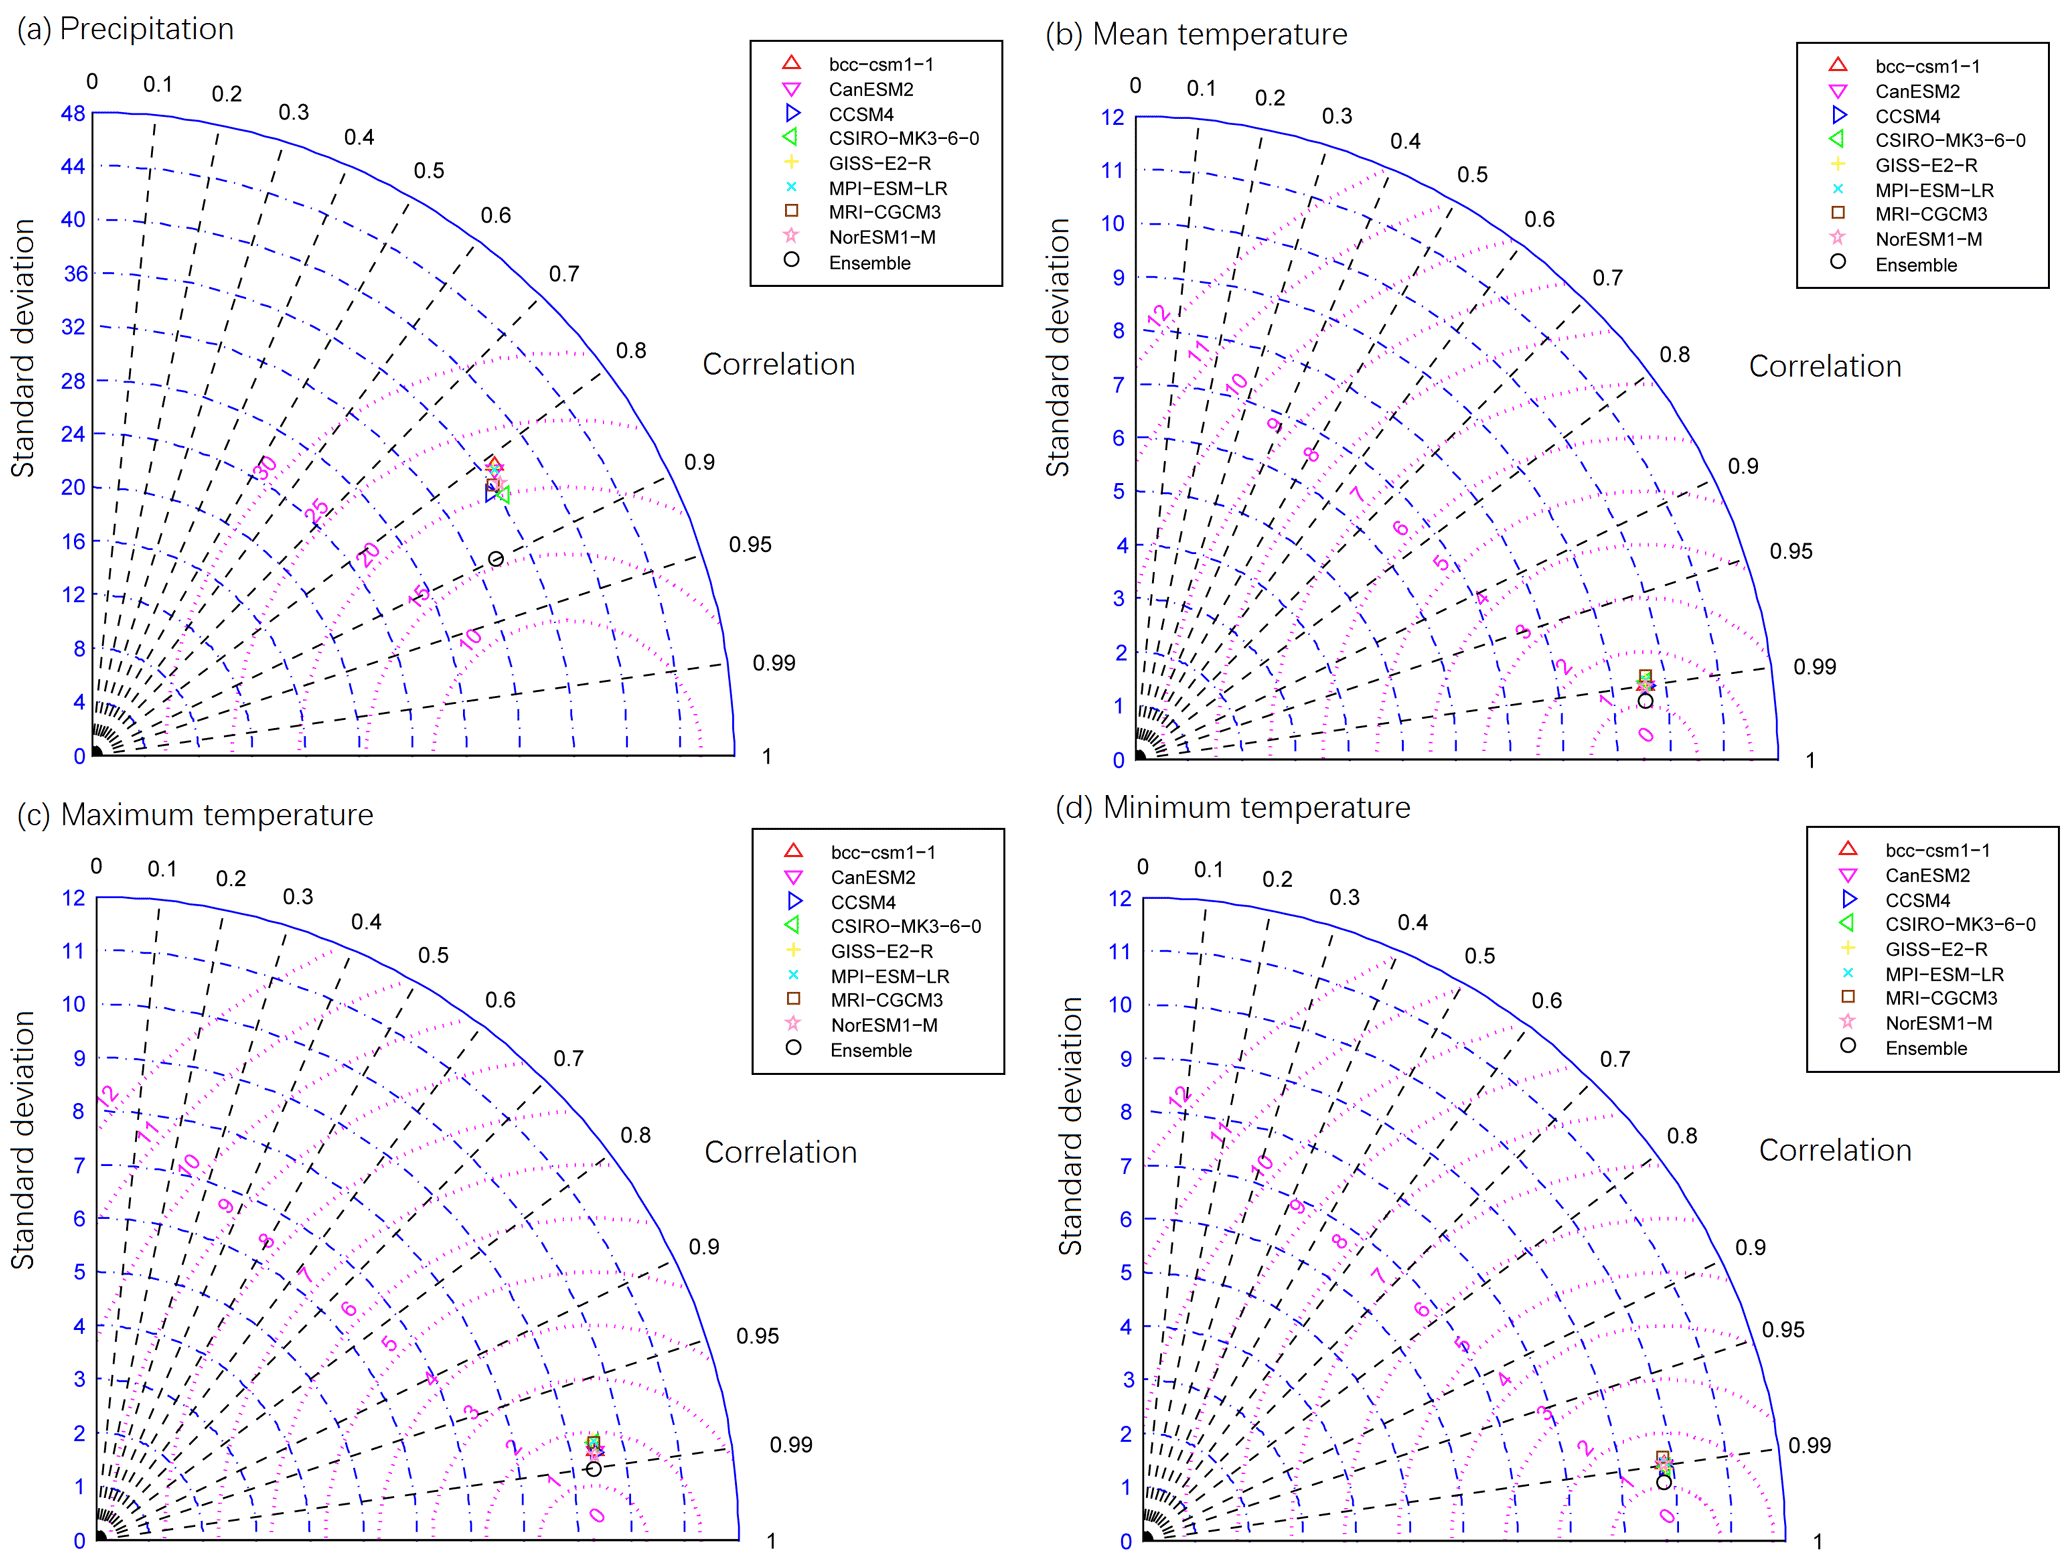
Figure 2Taylor diagram of standard deviation and correlation of observed and downscaled (a) monthly precipitation, (b) mean temperature, (c) maximum temperature, and (d) minimum temperature in YRB (1961–2005).
2.4 VIC Model
VIC model is a semi distributed, physically based, macro-scale surface water and energy balance hydrological model. It can be run in either water balance mode or full water and energy balance mode. The model takes into account the land-gas water balance and energy balance, the unevenness of the spatial distribution of soil water storage capacity, considering streamflow yield under saturated storage and streamflow yield under excess infiltration, nonlinear regression of base flow. The Richards equation is used to describe the vertical one-dimensional soil water movement, and the Darcy law is used to describe the process of water vapor flux in soil layers (Zhang et al., 2009). We used observed data and eight downscaled model's outputs as the climatic forcing data of the VIC model. The VIC model has seven sensitive parameters that need to be calibrated for the study area, including the infiltration curve index (infilt), the lowest maximum base of soil flow (Dsmax), base flow of nonlinear growth occurs and the proportion of the Dsmax (Ds), the ratio of the bottom soil maximum moisture base flow nonlinear growth (Ws), the depth of soil layer (Depth1, Depth2, Depth3). In this study, Nash Sutcliffe coefficient (NSCE; Nash and Sutcliffe, 1970) and total relative Bias were used to evaluate the model simulations.
3.1 Assessment of downscaled outputs
RMSE of monthly precipitation and temperature between downscaled outputs with observations were presented in Table 2. It could be found that the RMSE of eight model's ensemble for both precipitation and temperature is lower than any individual model. Among eight models, model NorESM1-M shows the smallest RMSE between precipitation, mean temperature, maximum temperature, and minimum temperature than any other model. The RMSE of monthly precipitation from individual model varies from 35.67 to 37.12 mm, and model bcc-csm1-1 has the highest RMSE value. The downscaled monthly mean temperature has lowest RMSE varies from 1.78 to 2.41∘ than that of maximum and minimum temperature. Model MPI-ESM-LR has the highest RMSE of monthly mean temperature, model GISS-E2-R has the highest value of maximum temperature, and model MRI-CGCMS has the highest RMSE value of minimum temperature. The standard deviation and correlation using Taylor figure (Taylor, 2001) of eight models and their ensemble against to the observations (Fig. 2). The correlation coefficient of precipitation is about 0.83. Meanwhile, the monthly mean, maximum, and minimum temperature have higher correlation coefficient (around 0.99) than that of precipitation. Especially, the multi-model ensembles of precipitation and temperature present higher correlation coefficient than any single model. It shows that the multi-model ensemble can reduce the noisy of each model's simulation. Therefore, we analyzed the spatial distribution of RMSE and CC of eight model simulations against to the observations.
The spatial distribution of RMSE of downscaled ensemble outputs against to the observations was presented in Fig. 3. It shows that the highest RMSE occurred in the east area varies from 56 to 72 mm, while the lowest values occurred in the west area varies from 16 to 24 mm. The RMSE of the maximum and minimum temperature in the middle of north area is larger than other regions. Meanwhile, the west area has the highest correlation coefficient of precipitation varies from 0.8 to 0.9, while middle area has the lowest correlation coefficient with the observed precipitation. The mean and minimum temperature have good correlation coefficient with the observations varies from 0.98 to 0.99 for the whole basin. The correlation coefficient of the maximum temperature is lower than that of mean and maximum temperature, and the west region has the relatively lowest correlation coefficient value (about 0.96). Thus, we can conclude that these downscaled eight model's ensemble is good at simulating the precipitation and temperature in YRB.
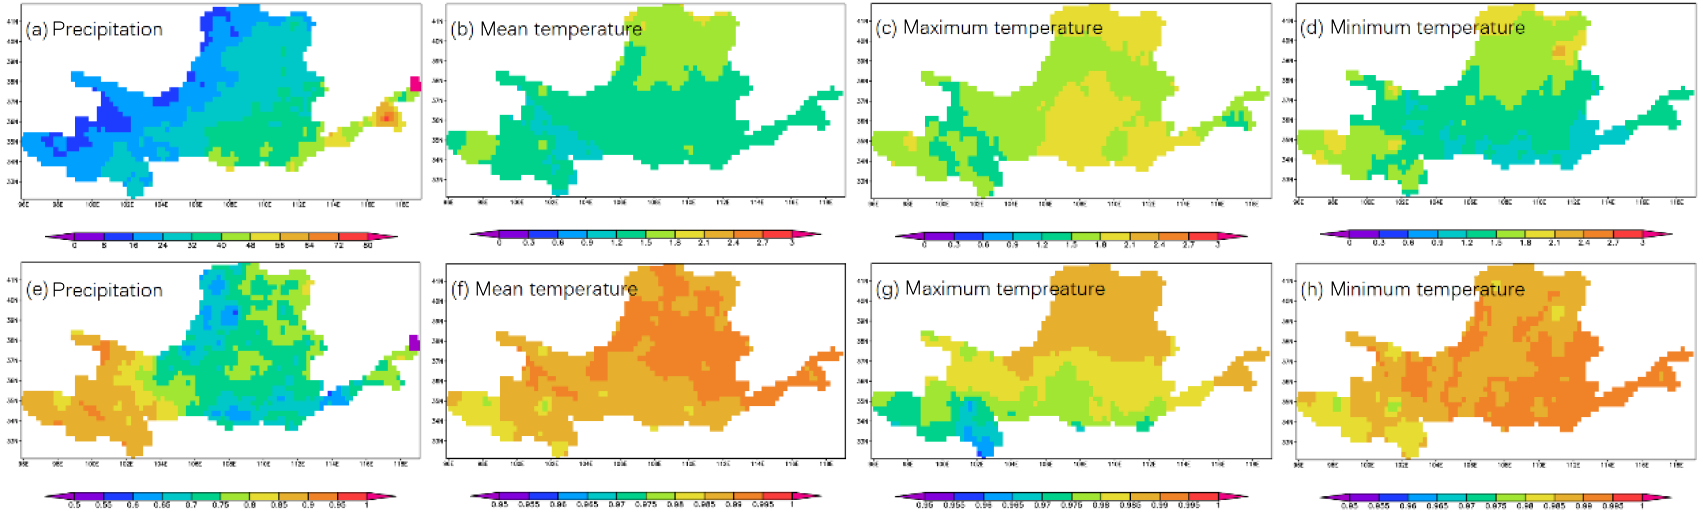
Figure 3Spatial distribution of RMSE (a–d) and CC (e–h) showing comparison of monthly model set range simulations over the region with observations (1961–2005).
3.2 VIC model calibration and validation
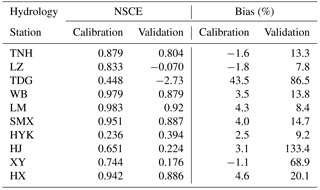
We analyzed the NSCE and Bias of the VIC model simulations with the observed streamflow of each hydrological station for calibration period and validation period (Table 3). The whole basin was divided into ten sub-catchments for calibration and validation. For nested catchments, the upstream flood wave was routed into the downstream with the Muskingum method. Then by taking the difference between observed and routed ones of downstream, the hydrograph for areas between upstream and downstream was derived and was further applied for calibration. Since no observation stations were collected for the catchments of interior drainage area and the lower reaches of HYK, parameters from their each adjacent catchment, WB and HYK respectively, were employed for computation instead. The NSCE of seven stations are above 0.7 and the bias of streamflow is around ±5 % during the calibration period (1961–1990). Meanwhile, there are five stations has a higher Nash value above 0.7 during the validation period (1991–2012). These results indicate that VIC model is good at simulating the hydrological procession of the Yellow River.
Table 3The statistics of calibration and validation periods monthly flows for the ten sub-catchments in YRB.
3.3 Projected changes of precipitation and temperature
During future period of 2021–2050, the annual precipitation for two RCPs show an increase trends, and the increasing rate varies from 7.795 mm/10 a to 11.56 mm/10 a for RCP4.5 and RCP8.5, respectively (Fig. 4). Seasonal precipitation presents a slightly increasing trend in spring and autumn, while a very slightly decreasing trend with the rate of 2.99 mm/10 a in summer for RCP4.5. On the other hand, the changing trends of winter precipitation for RCP8.5 is similar with that of RCP4.5 with a higher increasing rate. Notably, the summer precipitation of RCP8.5 shows an increase trend with the rate of 2.27 mm/10 a, which is opposite to that of RCP4.5.
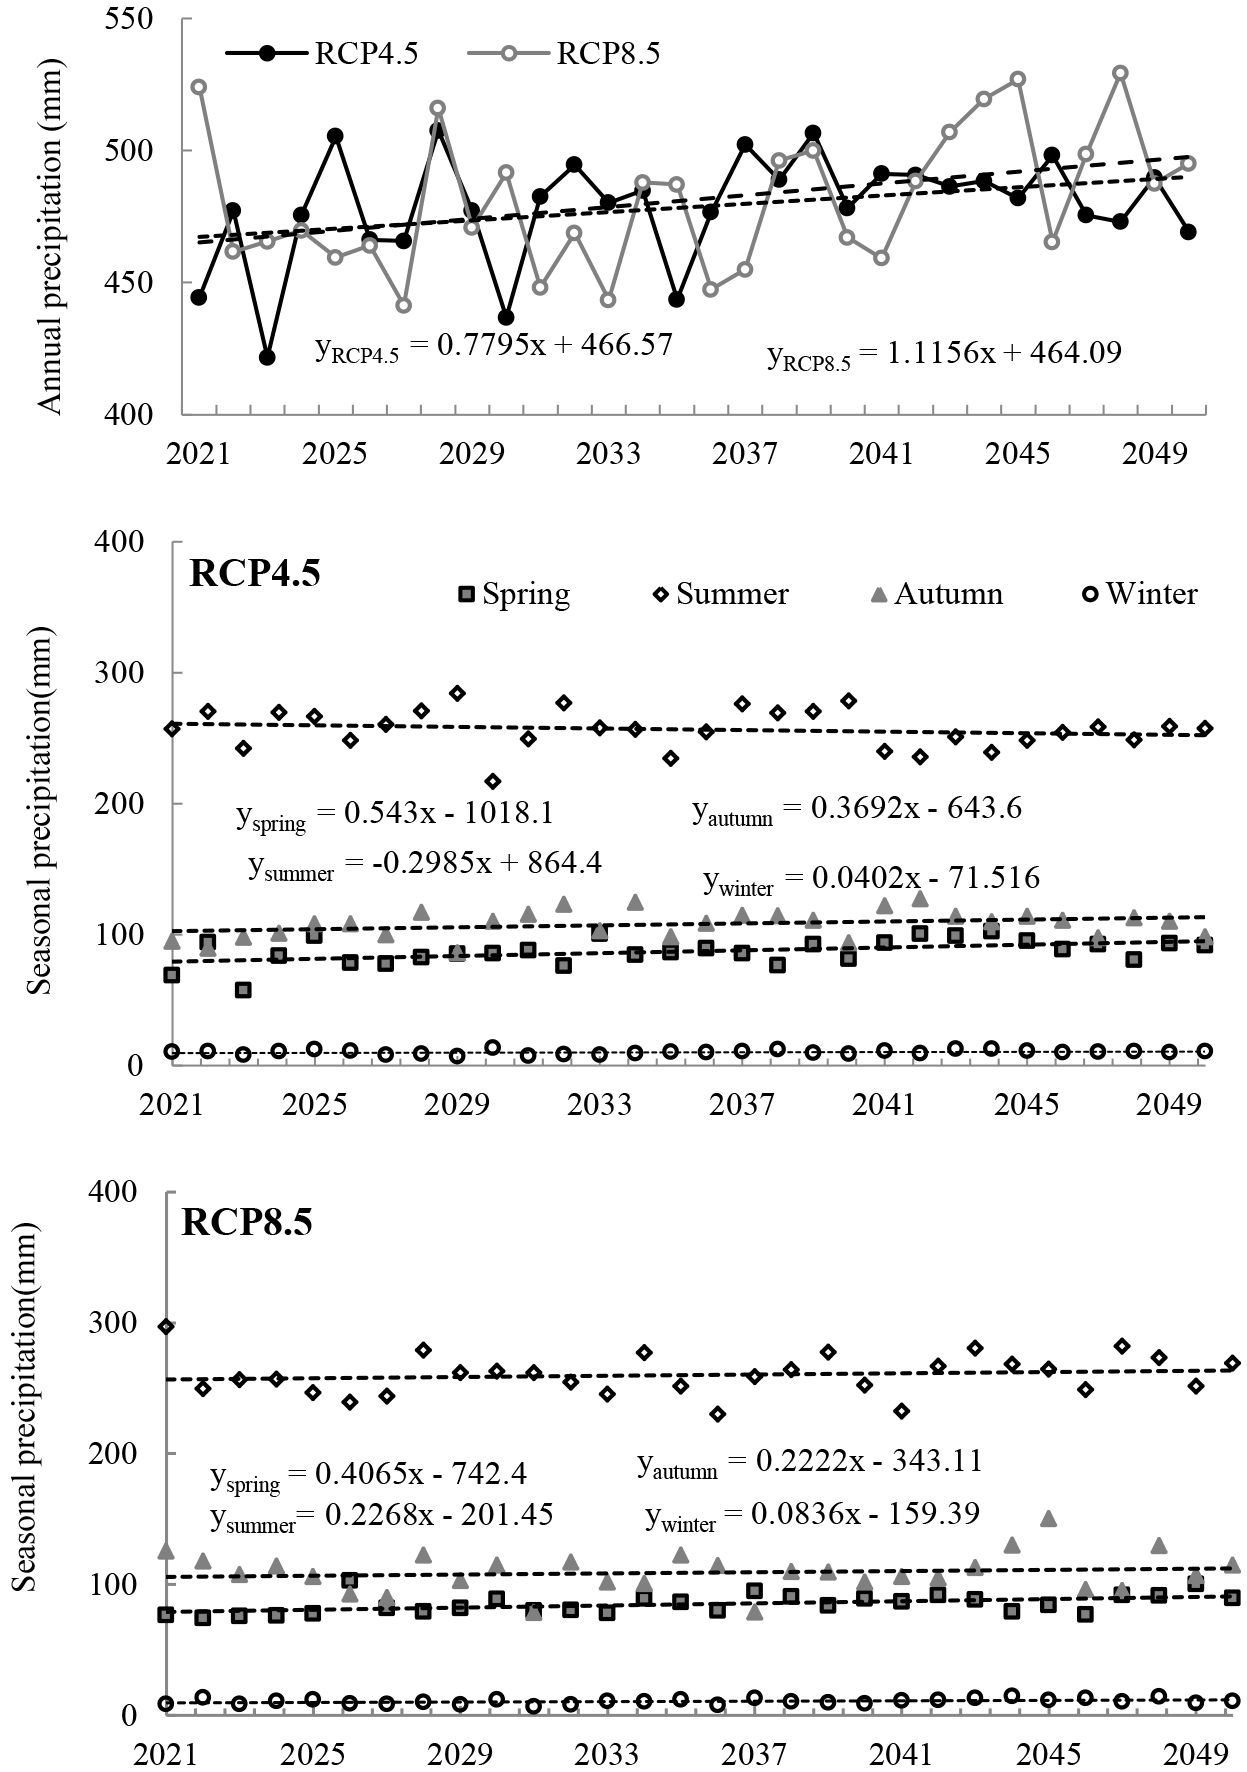
Figure 4The time series of annual and seasonal precipitation for RCP4.5 and RCP8.5 from 2021 to 2050 in YRB.
During the period of 2021–2050, the basin average temperature shows an obviously increasing for two RCPs (Fig. 5). Annual mean temperature projected an increasing rate of 0.373∘/10 a and 0.46∘/10 a for RCP4.5 and RCP8.5, respectively. Both RCP4.5 and RCP8.5 all project an increasing trend of seasonal temperature in YRB. The changing rate of seasonal temperature for RCP8.5 more than 0.47∘/10 a, which is higher than that of RCP4. 5. Meanwhile, the fastest increasing of seasonal temperature occur in winter with the rate of 0.47∘/10 a and 0.50∘/10 a for RCP4.5 and RCP8.5, respectively. The changing rate of seasonal temperature for RCP4.5 is uneven for all seasons, in which autumn is increasing more quickly (about 0.07∘/10 a) than that of spring. Whereas RCP8.5 projects a similar increasing rate in spring and autumn, while a little higher in summer and winter.
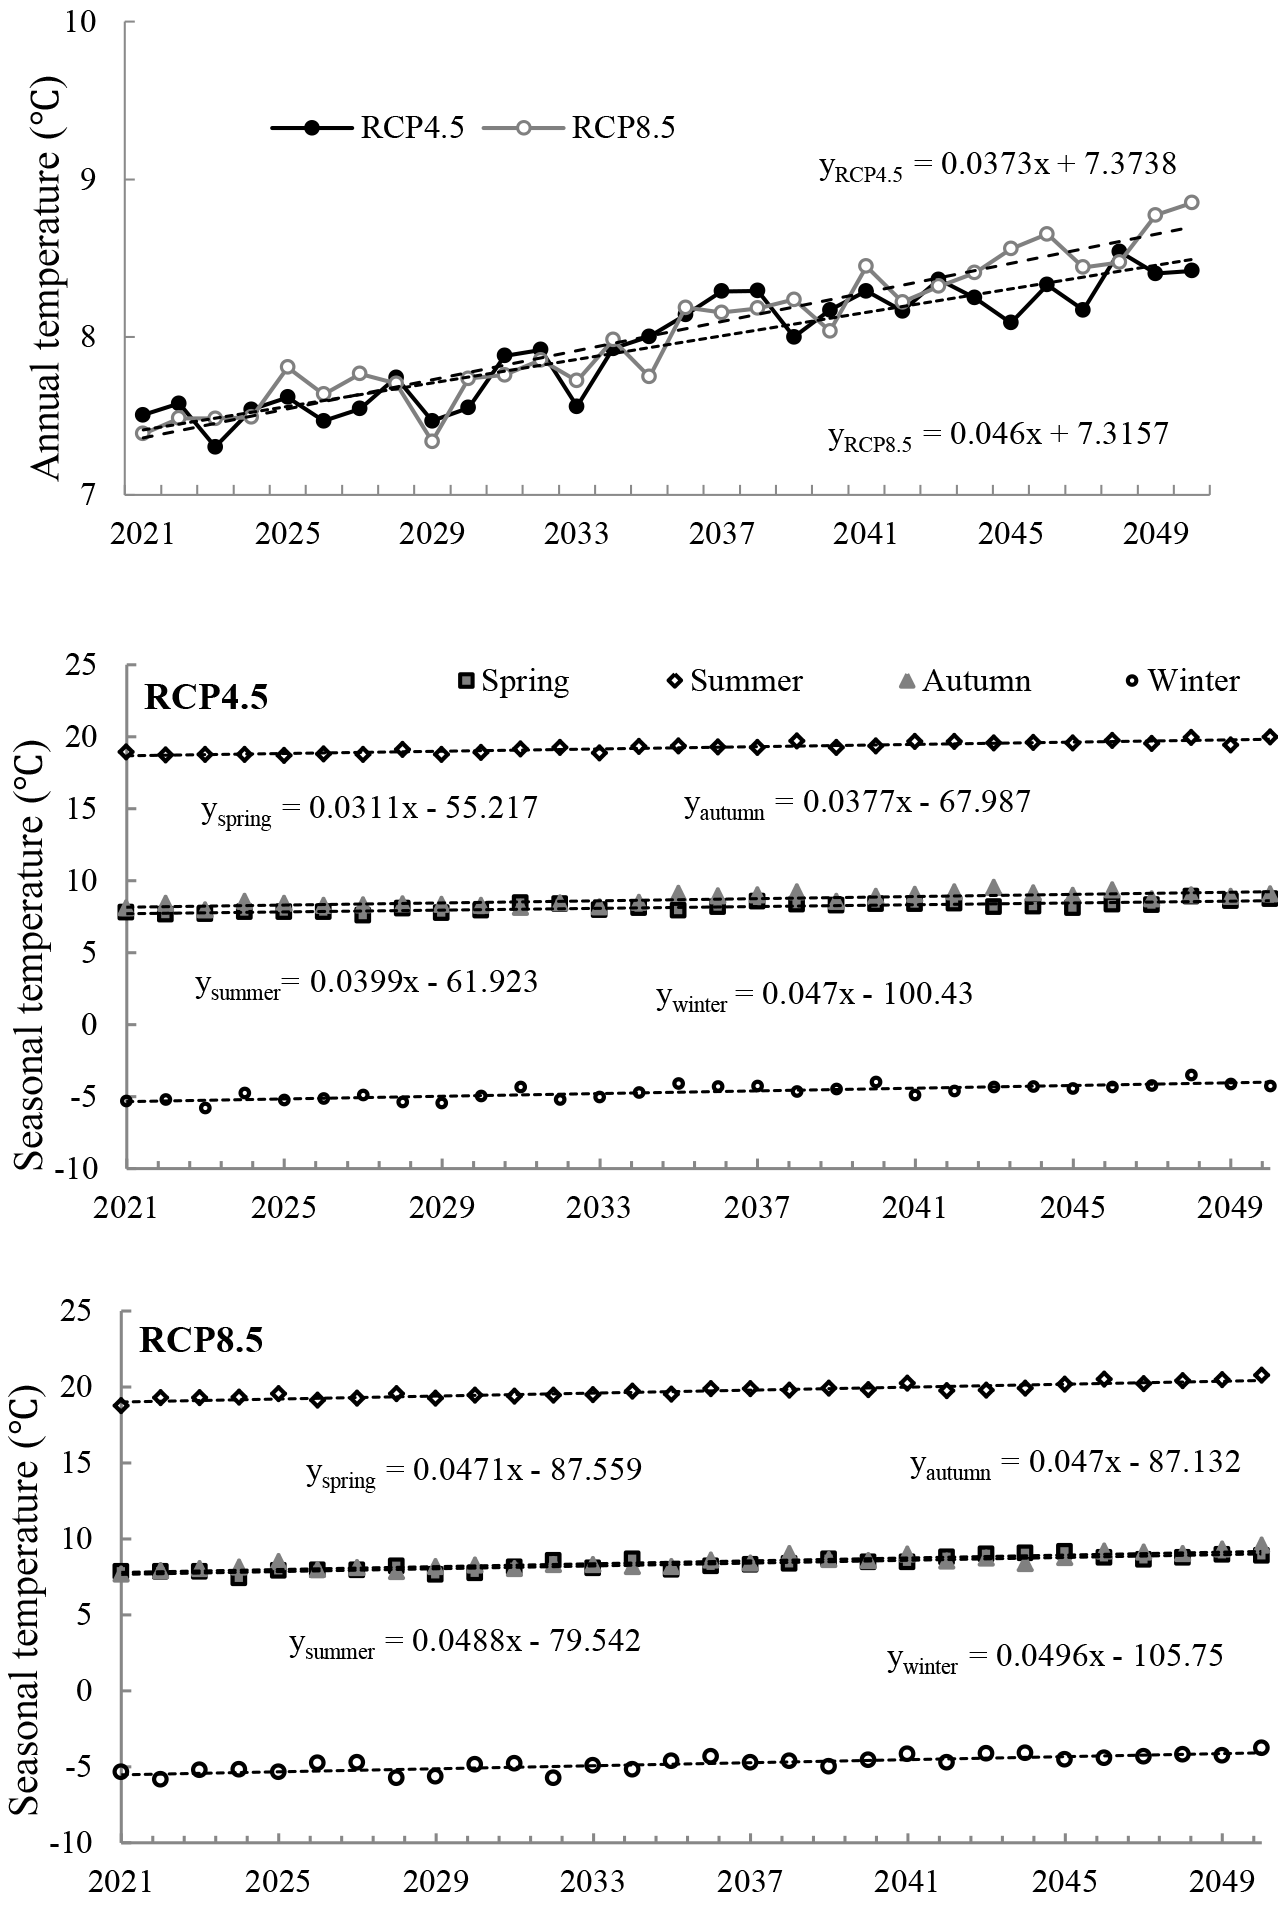
Figure 5The time series of annual and seasonal temperature for RCP4.5 and RCP8.5 from 2021 to 2050 in YRB.
3.4 Ensemble streamflow prediction
During the period of 2021–2050, the spatial distribution of MK for annual streamflow for RCP4.5 scenario shows an obviously increasing trend in the middle of the basin, while decreasing in the west and north parts of basin. RCP8.5 projects a different trend of annual runoff with RCP4.5, which remarkable increasing in the east part of basin and decreasing in the west part of basin (Fig. 6). Seasonal streamflow of basin average for RCP4.5 and RCP8.5 show a slightly increasing trend except in summer of RCP4.5, which shows a slightly decreasing trend.

Notably, the spatial distribution of MK test for seasonal streamflow shows an uneven spatial changing trend (Fig. 7). For example, the streamflow shows a remarkable increasing trend in the sub-catchment of LZ in spring and autumn, while which shows a slightly decreasing trend in summer for RCP4.5. For the middle parts of YRB, the streamflow presents an unobvious decreasing trend in summer, while increasing in spring. For RCP8.5, streamflow of north parts of YRB shows a slightly increasing trend except the upstream region. Notably, the streamflow in upstream of YRB shows an obviously decreasing trend in summer and autumn for RCP8.5, while which shows an increasing trend in spring.
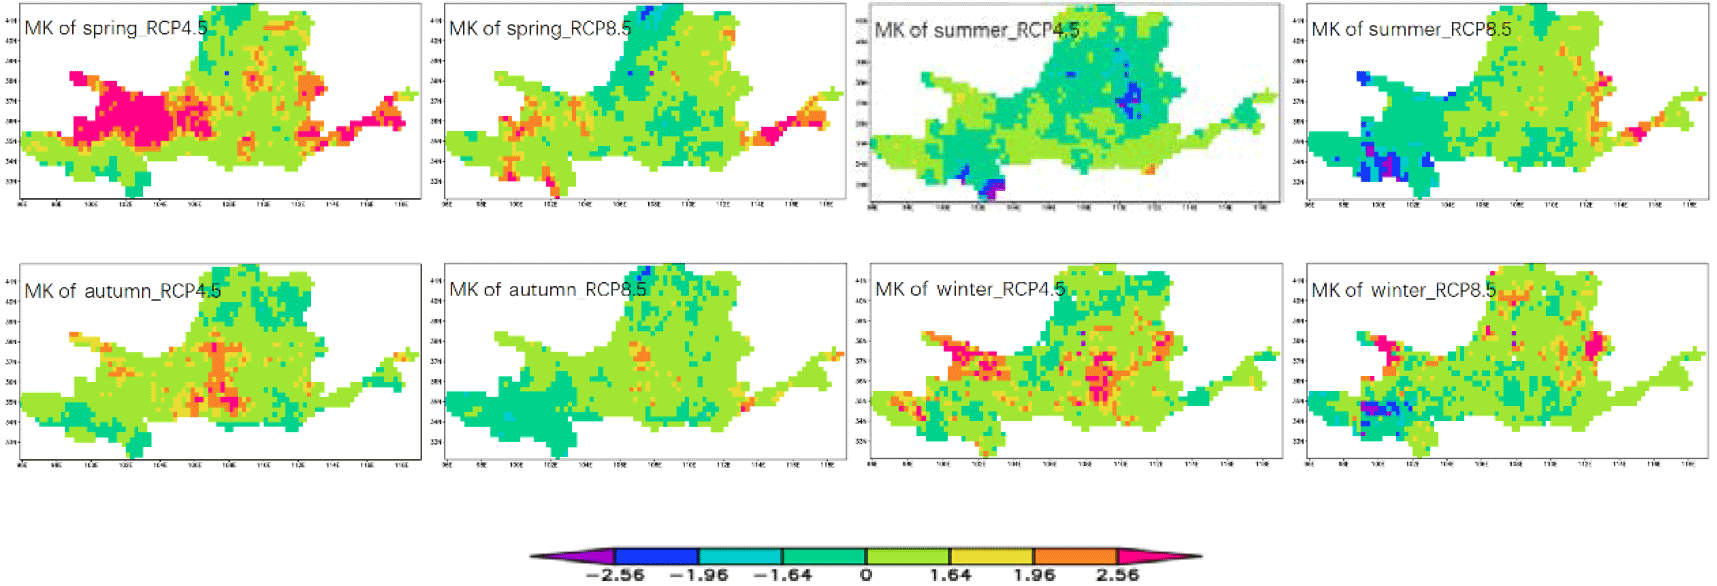
Figure 7The spatial distribution of Mann-Kendall trend test of the streamflow during 2021 to 2050 in the YRB for two scenarios.
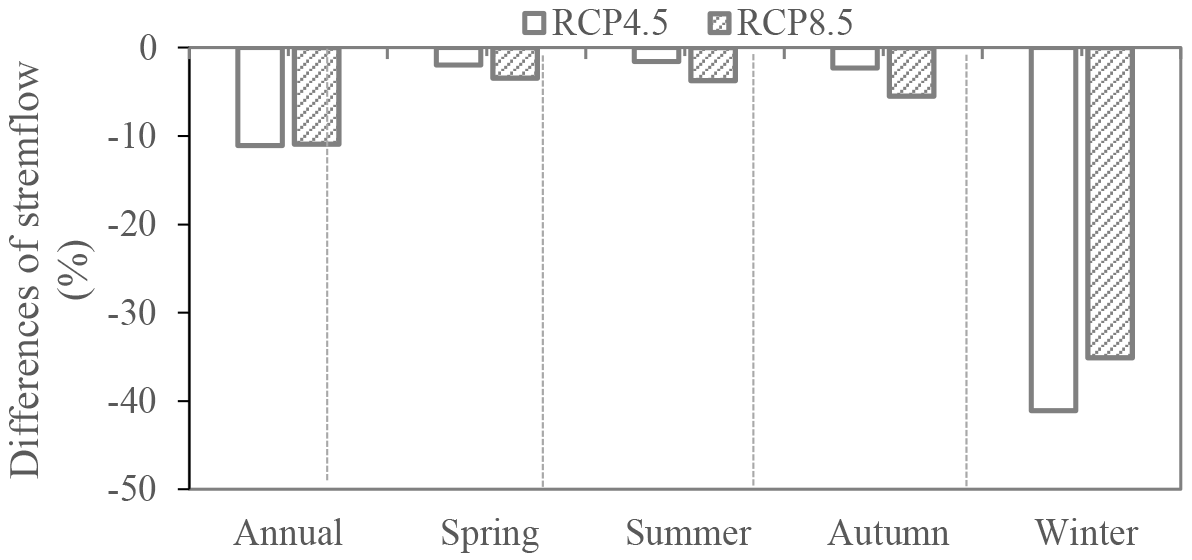
Figure 8Projected changes of annual and seasonal streamflow (2021–2050) against to the base line period (1961–1990) for RCP4.5 and RCP8.5 in YRB.
For further analysis of the changing trend of streamflow in YRB for the future period, we compared the changes of future streamflow with that of base period (1961–1990) in Fig. 8. In the future period, the VIC model simulated annual and seasonal streamflow reduce obviously compared with the base period. The annual streamflow will reduce about 10 % for two RCPs. The seasonal streamflow projected a reduce ratio of 3.44, 3.70, and 5.48 % in spring, summer, and autumn for RCP8.5, respectively, which is bigger than that of RCP4.5. Especially, the streamflow projected a remarkable reduce in winter about 41.11 and 35.11 % for RCP4.5 and RCP8.5, respectively.
The statistical downscaling method of EDCDFm is good at simulated historical period of precipitation and temperature in YRB. The eight models ensemble outputs show a higher correlation coefficient and lower RMSE than any single model. Projected precipitation and temperature all show an increasing trend during the period of 2021–2050. Compared to the base period (1961–2050), the annual streamflow of future period will reduced about 10 % and the streamflow in winter will reduce about 40 %. With the increasing of population and economic of YRB, there will be more require for the water resource in the future.
The CMIP5 raw model outputs can be found in: https://esgf-node.llnl.gov/search/cmip5/. The observation data of weather stations in the YRB for the period of 1961–2005 can be found in China Meteorological Data Service Center (CMDC) (http://data.cma.cn/). Other data in this paper is not available.
The authors declare that they have no conflict of interest.
This article is part of the special issue “Water security and the food–water–energy nexus: drivers, responses and feedbacks at local to global scales”. It is a result of the IAHS Scientific Assembly 2017, Port Elizabeth, South Africa, 10–14 July 2017.
This research was financially supported by the National Key Research and
Development Program under Grant No. 2016YFA0601504 approved by Ministry of
Science and Technology, the People's Republic of China. This research has
been also funded by The National Natural Science Foundation of China
(51579066) and the Fundamental Research Funds for the Central Universities
(2015B14514).
Edited by: Barry Croke
Reviewed by: three anonymous referees
Aloysius, N. R., Sheffield, J., Saiers, J. E., Li, H., and Wood, E. F.: Evaluation of historical and future simulations of precipitation and temperature in central Africa from CMIP5 climate models, J. Geophys. Res.-Atmos., 121, 130–152, 2016.
Duan, X. L., Hao, Z. C., Chen, Y., and Center, U.: Climate change forecasting in source region of yellow river based on bcsd downscaling method, Journal of Hohai University, 42, 195–199, 2014.
Hao, Z. C., Shi, F. X., and Wang, J. H.: Research and analysis of change of precipitation in headstream region of yellow river by using statistical downscaling model, Water Resources & Power, 29, 1–4, 2011.
Li, H., Sheffield, J., and Wood, E. F.: Bias correction of monthly precipitation and temperature fields from intergovernmental panel on climate change ar4 models using equidistant quantile matching, J. Geophys. Res.-Atmos., 115, 985–993, 2010.
Murphy, J.: Predictions of climate change over Europe using statistical and dynamical downsaling techniques, Int. J. Climatol., 20, 489–501, 2000.
Nash, J. E. and Sutcliffe, J. V.: River flow forecasting through conceptual models part1 – a discussion of principles, J. Hydrol., 10, 282–290, 1970.
Stocker, T. F., Qin, D., Plattner, G.-K., Tignor, M., Allen, S. K., Boschung, J., Nauels, A., Xia, Y., Bex, V., and Midgley, P. M.: IPCC 2013: Summary for Policy Makers, Cambridge University Press, Cambridge, United Kingdom and New York, NY, USA, 2013.
Tareghian, R. and Rasmussen, P. F.: Statistical downscaling of precipitation using quantile regression, J. Hydrol., 487, 122–135, 2013.
Taylor, K. E.: Summarizing multiple aspects of model performance in a single diagram, J. Geophys. Res.-Atmos., 106, 7183–7192, 2001.
Wang, L. and Chen, W.: A CMIP5 multimodel projection of future temperature, precipitation, and climatological drought in china, Int. J. Climatol., 34, 2059–2078, 2014.
Wang, X. Y., Yang, T., and Hao, Z. C.: Climate extreme forecasting in headwater catchment of yellow river based on statistical downscaling method, Water Resources & Power, 29, 1–4, 2011.
Wilby, R. L., Dawson, C. W., and Barrow, E. M.: SDSM – a decision support tool for the assessment of regional climate change impacts, Environ. Modell. Softw., 17, 145–157, 2002.
Xu, Y., Gao, X., Giorgi, F.: Upgrades to the REA method for producing probabilistic climate change projections, Clim. Res., 41, 61–81, 2010.
Zhang, J. Y. and Wang, G. Q.: Study on the Impact of Climate Change on Hydrology and Water Resources, Science Press, Beijing, China, 2007.
Zhang, L. P., Chen, X. F., Zhang, X. L., and Song, X. Y.: A compare application research of VIC model and SWAT model in the mid-small valley flow simulation, Resources & Environment in the Yangtze Basin, 18, 745–752, 2009.