the Creative Commons Attribution 4.0 License.
the Creative Commons Attribution 4.0 License.
 | 16 Apr 2018
Morphodynamic change analysis of bedforms in the Lower Orinoco River, Venezuela
Santiago Paul Yepez
Alain Laraque
Carlo Gualtieri
Frédéric Christophoul
Claudio Marchan
Bartolo Castellanos
Jose Manuel Azocar
Jose Luis Lopez
Juan Alfonso
The Orinoco River has the third largest discharge in the world, with an annual mean flow of 37 600 m3 s−1 at its outlet to the Atlantic Ocean. Due to the presence of the Guiana Shield on the right bank, the lower reach of the Orinoco has a plan form characterized by contraction and expansion zones. Typical 1–1.5 km wide narrow reaches are followed by 7–8 km wide reaches. A complex pattern of bed aggradation and degradation processes takes place during the annual hydrological regime. A series of Acoustic Doppler Current Profiler (ADCP) transects were collected on an expansion channel in the Orinoco River, specifically over a fluvial island, representative of the lower Orinoco. In this study, temporal series of bathymetric cartography obtained by ADCP profiles combined with Differential Global Position System (DGPS) measurements (with dual-frequency), were used to recover the local displacement of bed forms in this island. The principal aims of this analysis were: (1) to understand the dynamics and evolution of sand waves and bars at this section and (2) to quantify the volume (erosion vs. accretion) of a mid-channel bar with dunes by applying DEM of Difference (DoD) maps on time series of bathymetric data. This required sampling with ADCP transects during the months of: May 2016; November 2016 and April 2017. Each bathymetric transect was measured twice, 1 day apart and on the same trajectory obtained by a GPS receptor. The spatial analysis of these ADCP transects is presented as a novel tool in the acquisition of time series of bathymetry for a relatively deep section (∼20 m) and under variable flow conditions.


The processes of erosion and sediment transport are key components for quantifying the formation of mid-channel bars. Mat Salleh and Ariffin (2013), categorized the fluvial river system into three zones: (1) an erosion zone of runoff production and sediment sources, (2) a transport zone of water and conveyance and (3) a deposition zone of runoff delivery and sedimentation.
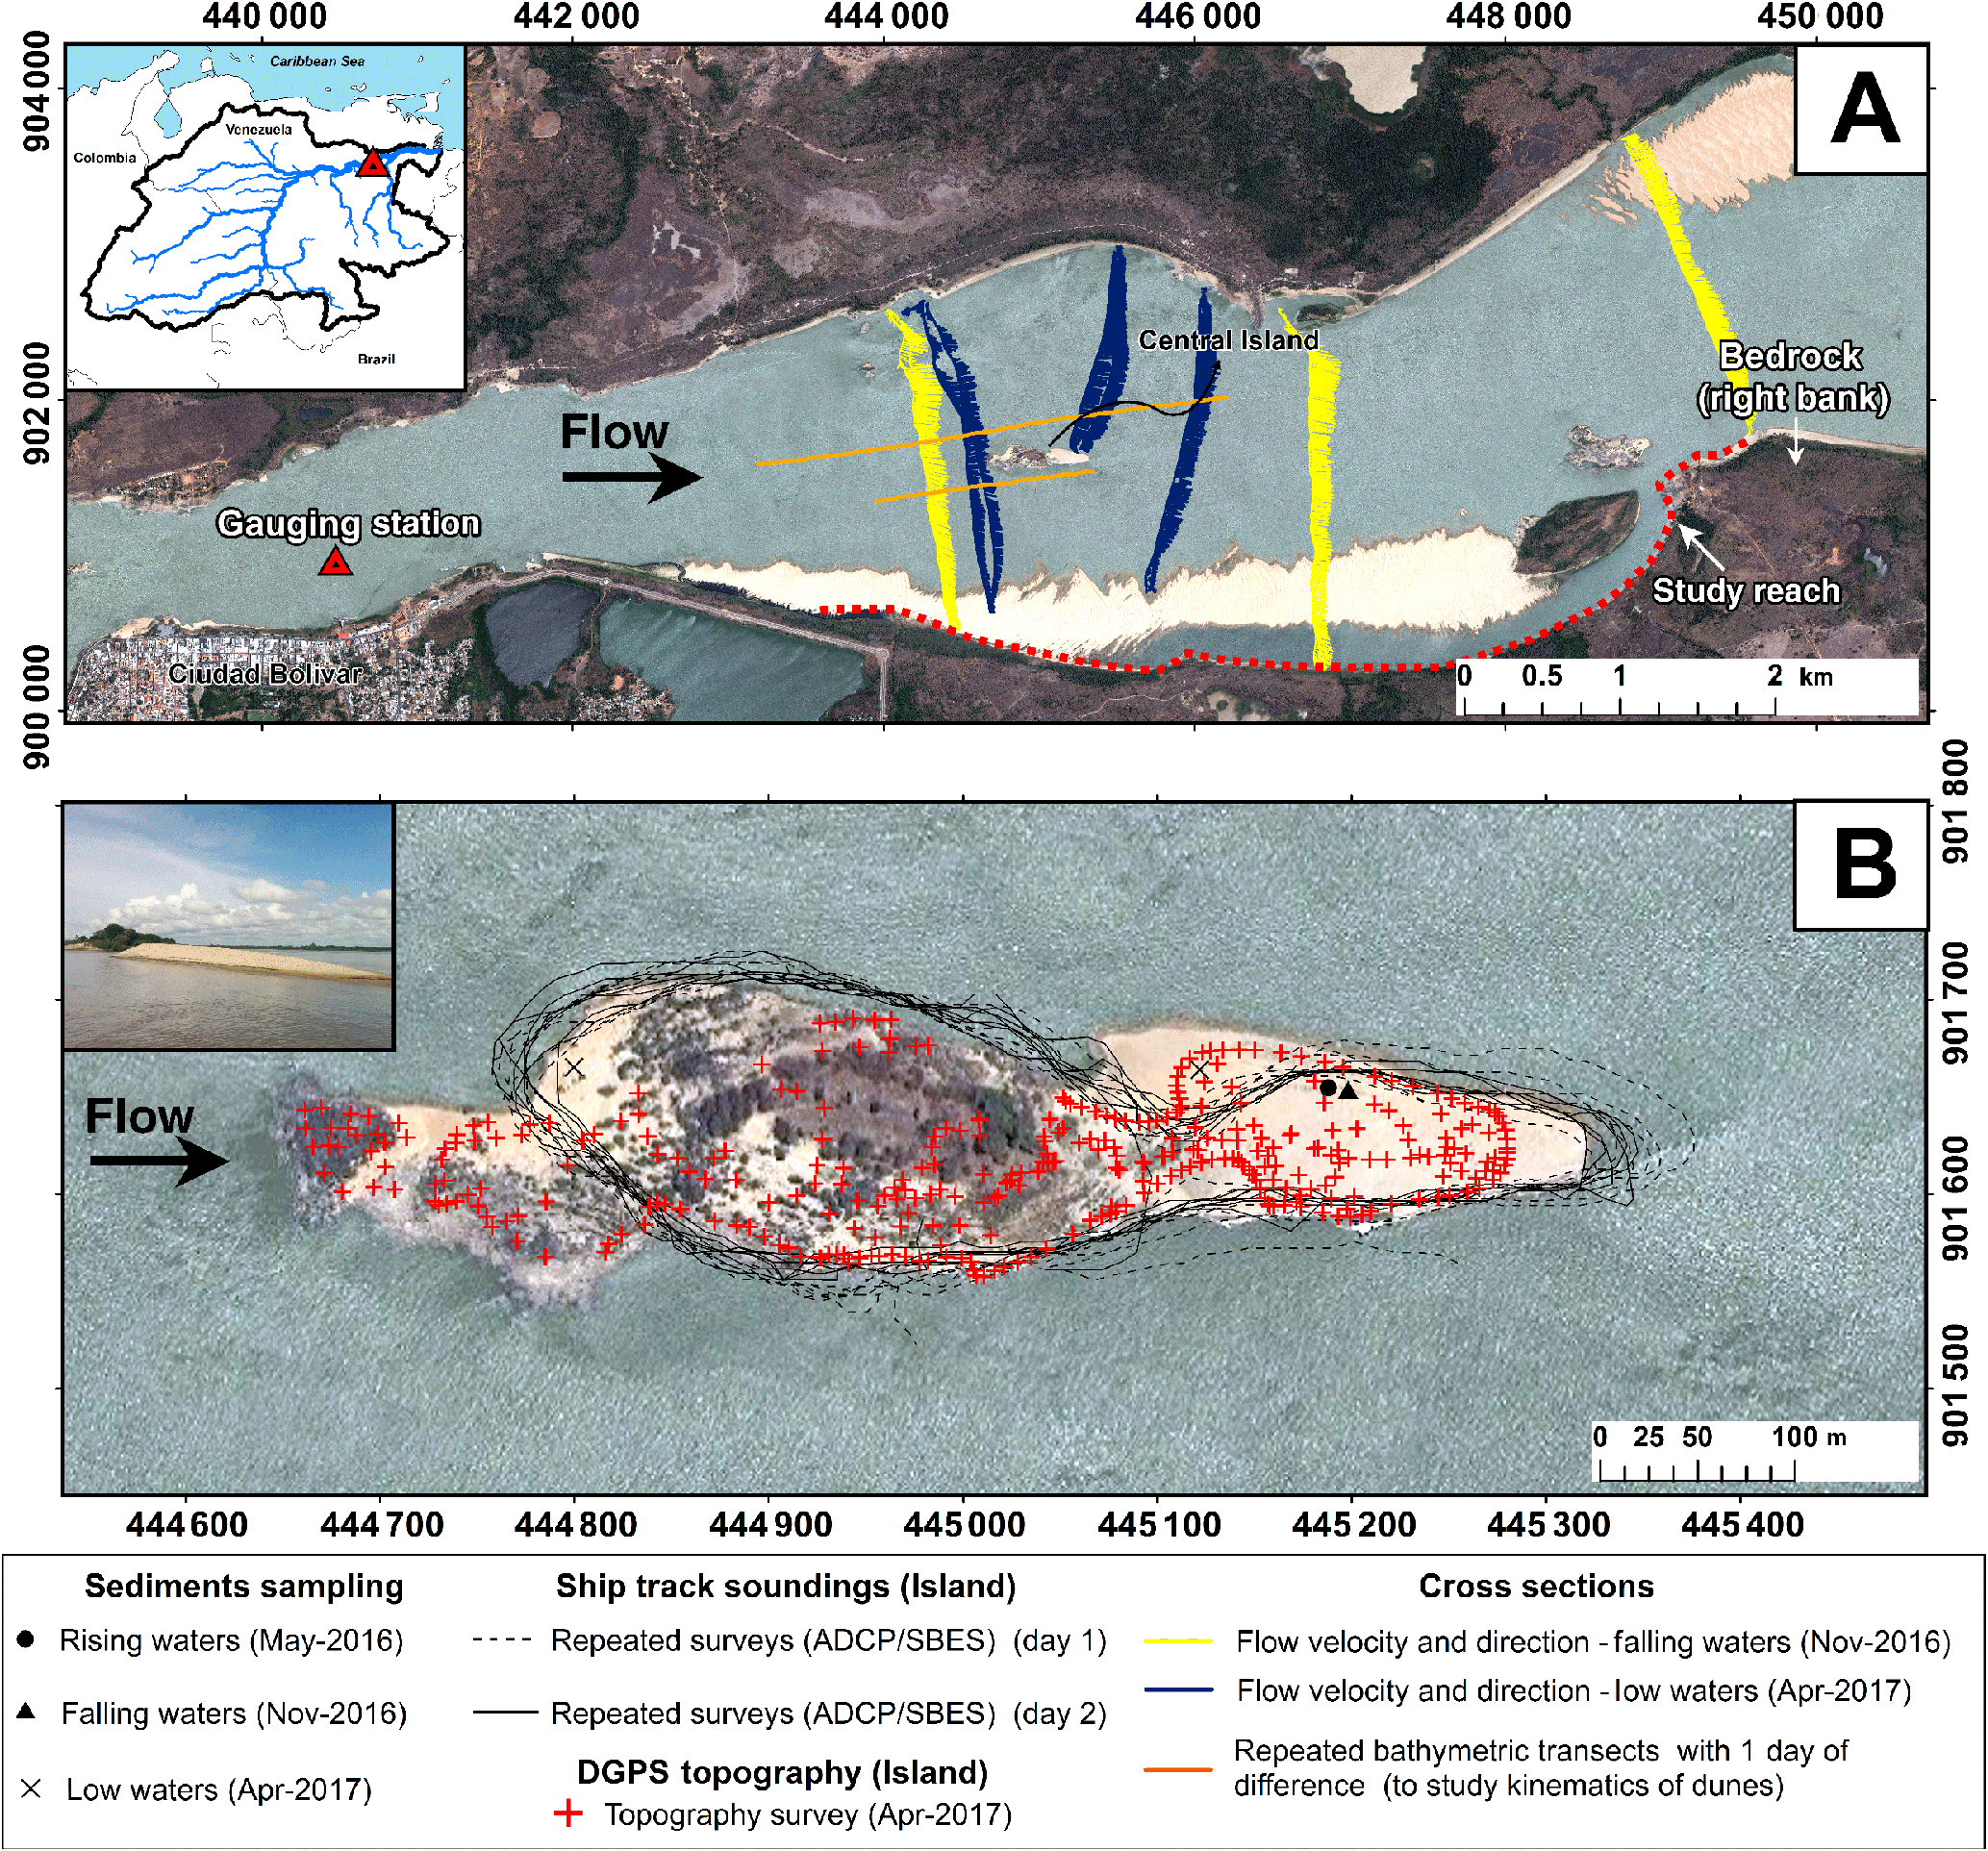
Figure 1(a) shows ∼7 km of the study site (Lower Orinoco) drawn with the red dotted line. Channel pattern is developed in a zone of expansion downstream from the gauging station. (b) illustrates the trajectories of the ADCP repeated transects performed during the field campaign.
River banks have been shown to act as key sediment sources in many different drainage basins, and can supply over 50 % of catchment sediment output (Lawler et al., 1999).
The volumetric change associated with bedload flux difference and its quantification is one of the main objectives of many investigations to understand sediment transport in rivers. However, in many cases this type of analysis is performed in a two-dimensional way. An example of this is the delineation of the riverbank from remotely sensed imagery to calculate accretion and erosion areas, using both airborne platforms and satellite platforms. In the last decades, developments in Remote Sensing and GIS technologies have allowed geomorphologists to develop campaigns of acquisition of Digital Elevation Models (DEMs) at much high precision and temporal frequency to analyze landform evolution and the change (Fuller et al., 2002; Williams et al., 2011; Williams, 2012; Carrivick et al., 2013).
In this work, a combined survey strategy using ADCP, Single Beam Echo-sounder (SBES) and DGPS equipments was implemented. The ADCP, mounted on a moving boat, collected data for mapping the flow field, and the SBES, on the same vessel, surveyed the channel bathymetry and the bed forms that create friction losses. Currently, the study of the processes linked to sediment transport, flow dynamics and erosion is a complex task, due in part to the technical and logistical constraints of deploying accurate data acquisition equipment to characterize morphological changes with recent data (Leyland et al., 2016).
The purpose of this research is to describe in a study reach of the lower Orinoco, the methods and advantages of repeated surveys by an ADCP and bathymetric soundings within a mid-channel bar affected by fluvial erosion/deposition. The specific research aims are: (1) to understand the mechanics of formation and evolution of sand waves and bars at this river section and (2) to quantify the volume (erosion vs. deposition) of a mid-channel bar, applying DoD maps (change detection) based on time series of bathymetric and topographic data. Comparisons between state of the art and traditional techniques are made to evaluate the effectiveness of these methodologies.
The Orinoco Basin is located (Fig. 1) in the north of South America between 2 and 10∘ N and 75 and 61∘ W. 70 % of this basin lies in Venezuela, while the remainder 30 % covers part of Colombia (Silva León, 2005). The headwaters of the Orinoco are at 1047 m above sea level and flow from its source at the Cerro Delgado–Chalbaud, in the Parima Range. The main channel covers a distance of 2140 km (Silva León, 2005) from the Brazilian border to its mouth in the Atlantic Ocean.
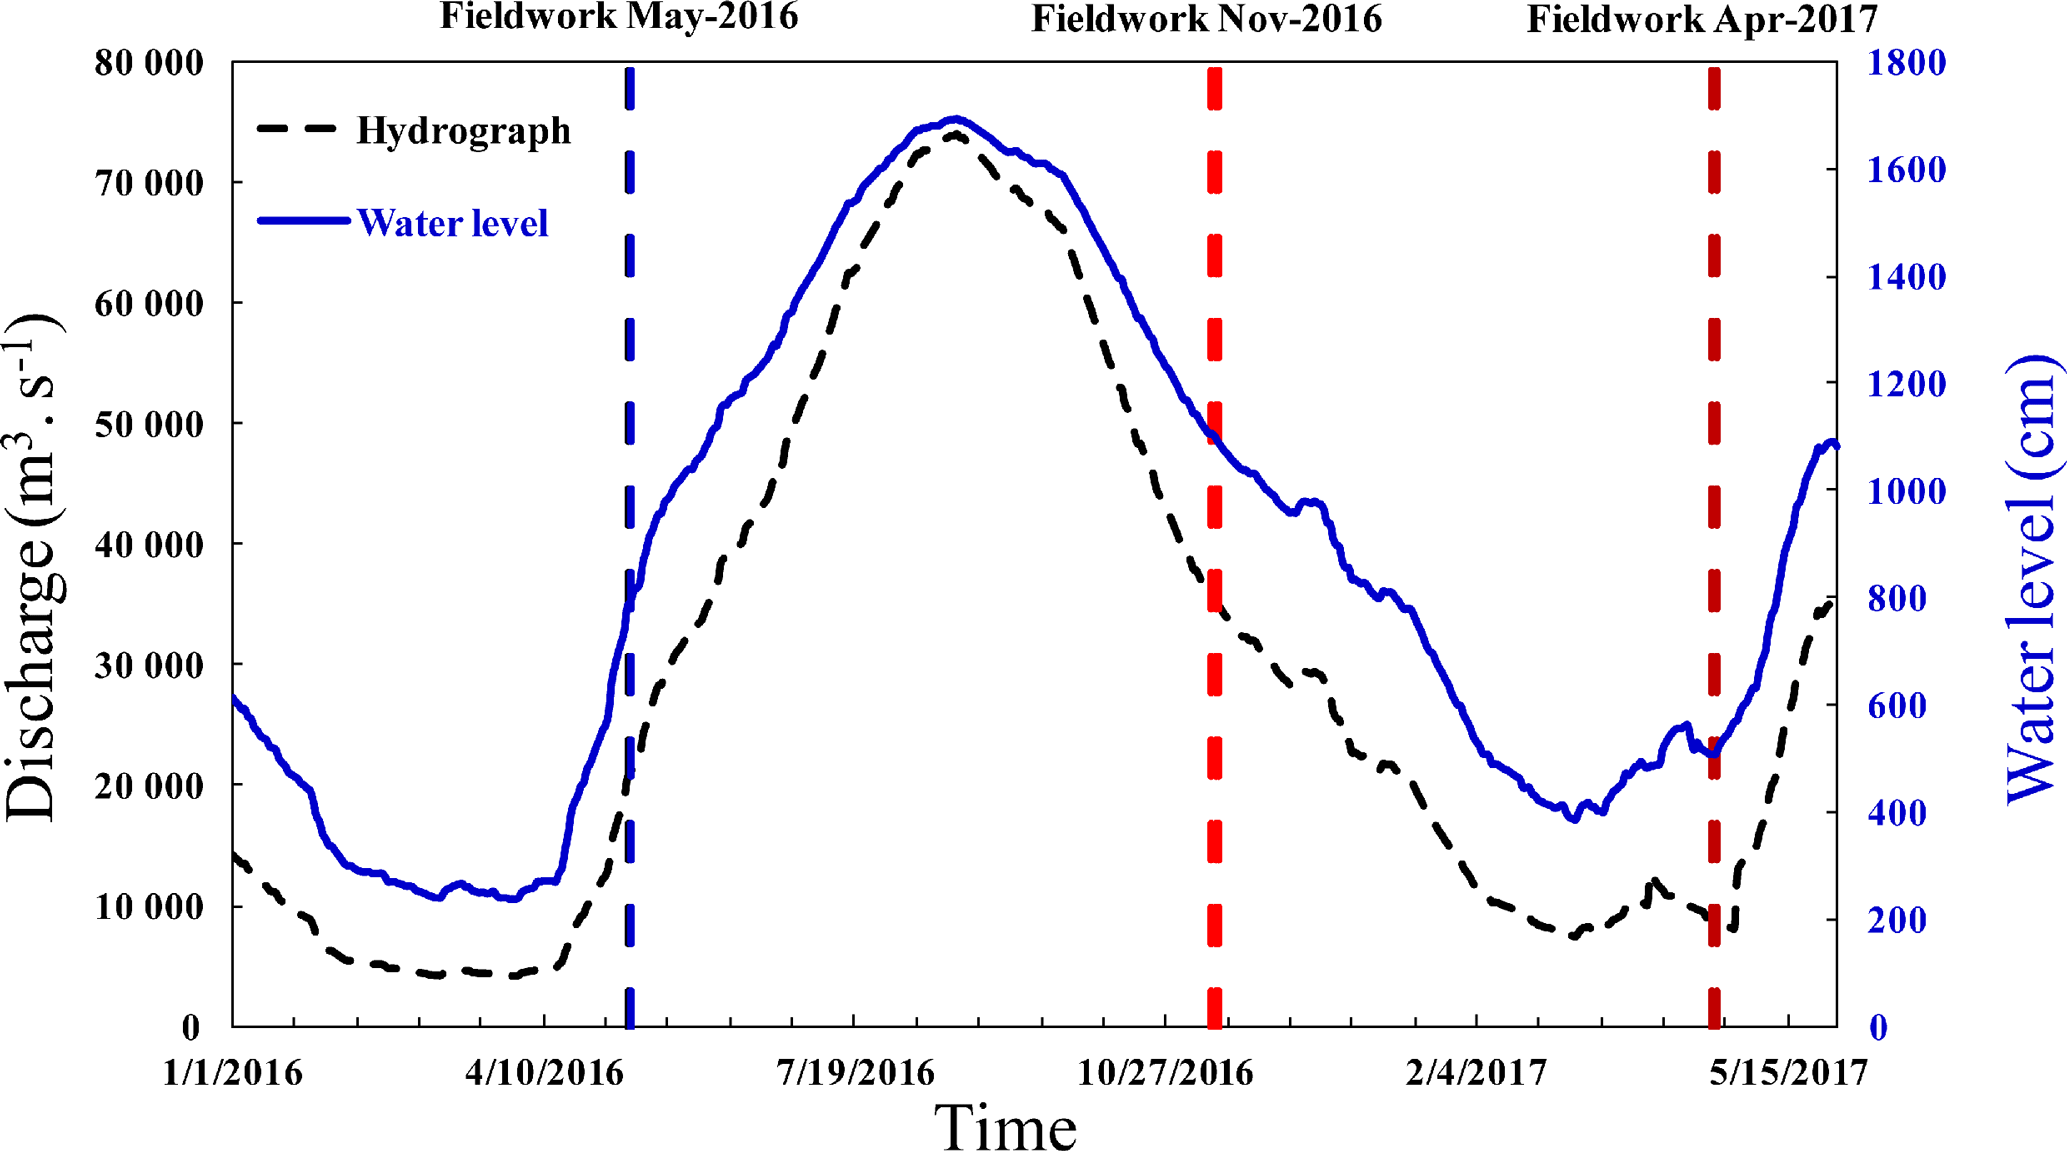
Figure 2Daily recorded discharge and gauge data from Ciudad Bolivar station during the study period (2016–2017).
The basin comprises three large geographic zones: (1) the Andes and Caribbean Coastal Ranges, where most suspended sediments originate; (2) the Llanos (floodplain area), which are crossed by all major tributaries coming from the Andes and (3) the Precambrian Guiana Shield from which drains predominantly black water with very low suspended sediment content (Lewis Jr. and Saunders III, 1984, 1989; Paolini et al., 1987; Depetris and Paolini, 1991; López and Perez-Hernandez, 1999; Warne et al., 2002; Laraque et al., 2013; Yepez et al., 2016).
The study reach is characterized by numerous sand bars and islands that divide the flow into several channels (López and Perez-Hernandez, 1999).
The annual hydrological regime of the lower Orinoco at its main flow gauging station at Ciudad Bolivar in Venezuela is characterized by a unimodal regime where the rising waters begin in April, and maximum streamflow is reached in August (Fig. 2). The amplitude between the low and high waters is ∼16 m.
For this study, a mid-channel bar (∼700 m length) representative of many of the banks and flanks of the lower Orinoco, where erosion and accretion of sediments occurs was selected as the study site.
This large mid-river fluvial island is entirely separated from the floodplain by water, exhibits stability, is flooded during bankfull conditions, and has established permanent vegetation. This sector is associated with an open channel characterized by alternating contraction and expansion zones. It is located at a distance of 4 km downstream from the main gauging station of Ciudad Bolivar (Fig. 1). The flanks or banks of the mid-channel bar (Central island) at the study site (Fig. 3) are between 1–10 m in height, although locally it can reach 13 m. The banks are composed of highly erodible and poorly consolidated sand deposits (D50=369.55 µm).

Figure 3The banks of the mid-channel bar (study area) are associated with highly erodible unconsolidated deposits.
3.1 Bathymetric and topographic data
Equipment such as ADCP are essential tools to measure the flow discharge in large rivers, especially when these rivers are dominated by unstable flows. The data associated with the velocity vector components obtained from ADCP equipment can be accurately plotted if this equipment is combined with dual frequency GPS receivers.
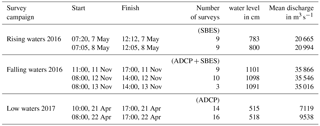
Time-based simulations were built to understand the sediment dynamics and flow in this sector. These simulations were generated from ADCP data sequences and bathymetric profiles combined with DGPS measurements (Table 1). The combination of both data allowed study of the flow dynamics related to river bank erosion/deposition over a fluvial island in the lower Orinoco.
Table 1SBES and ADCP surveys acquired on three occasions in the Orinoco River.
Using the methodology implemented by Dinehart and Burau (2005), bathymetry was mapped on the mid-channel bar with ADCP equipment. The distances were measured along four transducer beams to the bed of the river. Subsequently, each of these distances is internally converted to a depth. The four depths obtained by each beam are recorded and averaged by the ADCP to provide one measurement between the device and the bed. However, each of these distances is sufficiently accurate to create a precise bathymetry at relatively shallow depths. The orientation of each of the four transducer beams is at 20∘ downward from the vertical. Two of the beams are aligned at 20∘ from the vertical to port and starboard, while the two remaining beams maintain the same angle forward and backward. The cone angle of each beam is 2∘, which ensures a very small footprint between the beam contact and the bed. The coordinates are rotated using the pitch and roll measurements performed by ADCP, which allows the true coordinates to be obtained.
For the acquisition of topographic data, RTK DGPS (Real Time Kinematic – Differential GPS) equipment was used, which in dynamic mode allows collection of points of coordinates and altitude every second. The DGPS system allows collection of topographic data with a high spatial and temporal resolution, and altitude of great accuracy. Thus, these data can be used to evaluate the processes and changes associated with the fluvial erosion of river banks and islands.
The VMT (Velocity Mapping Toolbox) software (Parsons et al., 2013) allows extraction of the cloud of points in depth (meters) from the ADCP bathymetry transects. The repeated transects used for bathymetric surveying and the topographic survey on the fluvial island was realized with two devices: (1) a River Ray 600 KHz RDI Teledyne coupled to a Hemisphere Crescent VS100 series GPS compass (in differential mode) and (2) two GPS receivers RTK S9 (dual frequency) brand Stonex (cm-level accuracy) using the WGS84 System. Additionally, a Single Beam Echo-sounder (SBES) GPSmap 62S GARMIN was used to compare measurements with repeated transects from ADCP measurements around the fluvial island. Since a known control point did not exist in the study area, it was decided to place a fixed surveying station in the middle of the island, whose position is referred to the SIRGAS-REGVEN National Geodetic System. The measurement phase was performed using the static differential mode, with a duration of 4 h, 5 s for capture intervals and 10∘ of cut off elevation. For the calculation, analysis and processing of the differential data the AUSPOS Online service mode was used. A total of 371 points (topography) were measured from 1 to 10 s in RTK mode. The baseline did not exceed 552 m. To obtain the orthometric heights from the ellipsoidal heights, the Venezuelan Geoidal Model 2017 – VGM17 (Acuña, 2017) was used.
In this study, the data of bathymetric transects from 2016 to 2017 were analyzed. Each series of the ADCP transects has between 69 100 points (corresponding to 8.41 ha) and 131 963 points (corresponding to 16.24 ha). A first field campaign around the island was conducted out in high waters, and later the second one was carried out in the low water stage. The differences in the number of points surveyed in the two field campaigns is mainly due to the greater exposure of the fluvial island during the low water stage in April. For the construction of the digital elevation models repeated transects were surveyed around the island (Fig. 1). By combining topography and bathymetry information at the same time, it is possible to create a single model of the interface between the river bed, the submerged slope of the island and the exposed part of the island.
This analysis was based on the methodologies of Wheaton et al. (2010), which focus on detecting and quantifying surface and volumetric changes in rivers. For our study these methodologies were applied to different stages of the annual hydrological regime. Terrain digital elevation models were created from data processing with the ESRI ArcGIS program. In this step, our analysis was based on a workflow where survey points were used to perform a Triangular Irregular Network (TIN) applying Delaunay triangulation. Subsequently, the TIN model was linearly resampled in a grid with a specific resolution defined by the user. A polygon feature was built around the cloud of points and then used as a mask in the construction of the TIN model to mitigate the effects of the interpolation beyond the area where the points were acquired. A resolution of 1 m was selected for both DEMs used in this analysis, as a balance between computational time and loss of information. Thus, we have been able to define a resolution fine enough to resolve the morphological changes at the scale of islands and bars. A DoD was calculated from the subtraction of the elevations of each DEM generated on a different date on a cell-by-cell basis. The net volumetric change estimate was calculated by multiplying the elevation change (measured as depth in m) by the surface area of each cell (1 m2 for this case). Finally, these volumes were added to erosion and deposition categories to obtain the net volumetric budget.
An error evaluation was implemented in this analysis. Several techniques are used to measure the quality of terrain elevation models (Wheaton et al., 2010), which include: the accuracy given by the equipment manufacturer, the repetition of observations using control points, bootstrapping methods, fuzzy terrain models, repeated surveys of areas without any change and other geostatistical techniques.
In this investigation we used the Minimum Level of Detection (LODMin). δUDoD is a constant that represents the combined error arising from the addition or subtraction of two DEMs, Z(1) and Z(2). This constant can be estimated from the root sum square of errors:
where δz(1) and δz(2) represent the errors related with Z(1) and Z(2), respectively. For example, if δz(1) and δz(2) is 0.1 m in each DEM, then δUDoD has a value of 0.14 m. To use the LODMin, the value of δUDoD is applied in the DoD analysis as a constant threshold. This method is conservative because only the geomorphic change that is greater than the LODMin is considered adequate. In fact, analyses by Brasington et al. (2003) and Wheaton et al. (2010) indicate that areal and volumetric estimates of morphological change are highly sensitive to this threshold, i.e. information about the actual geomorphic change is very likely to be lost below this threshold (Williams, 2012). An ArcGIS extension for analyzing geomorphic change (Geomorphic Change Detection, http://gcd.joewheaton.org/home) was installed as a toolbox within the ArcMap graphical interface. This tool includes a series of procedures such as: the preparation phase of the DEMs and the application of change detection using various methods. The output formats are ESRI GRID files, graphics and txt files.
3.2 Bedform geometry
A GPSmap 62S GARMIN was used to analyze river bed elevation changes. Changes as small as 0.001 m can be measured with this equipment to evaluate the bedform geometry. The depth sounder followed a path with the streamwise direction.
Two longitudinal transects were measured and repeated again 24 h later. The length and lateral separation of the two sounding lines (orange lines) are shown in Fig. 1a. The acquisition of the bed profiles was validated directly in the field using the equipment graphical interface and later the bathymetric points were exported and mapped on a defined fixed scale. Sand waves and bars can be seen in each cross section. To calculate the height of each dune the difference in elevation between the lowest and highest points of the dune was determined. The slope of the dune was another parameter evaluated, calculated as the ratio of the height and the length of the dune.
Comparative graphs between repeated transects every 24 h were performed in order to understand the dynamics of the sand dunes in the study reach, as well as to have an approximate idea of the rate of displacement of these bed forms at different flow conditions.
4.1 Morphological changes recorded by DEM of Difference (DoD) over a mid-channel bar
The low errors associated with the DEMs, derived from the combination of RTK-DGPS measurements and repeated ADCP transects around the island (mid-channel bar), suggest that the methodology is capable of delivering high-accuracy topographic and bathymetric models.
Results of a single ADCP transect are insufficient to build adequate bottom bathymetry. However, the redundancy of multiple ADCP transects on the same path allows the acquisition of a large number of bed elevation points. This allows a sufficiently detailed and precise bathymetric surface to be constructed. Each ADCP transect was separated from the previous path by an appropriate distance following the path of the graphical interface of the GPS. This generated a distribution of thousands of bed elevation points around the mid-channel bar. Subsequently, the points were interpolated and converted into a raster model, thus obtaining the bathymetric surface of the sector with a spatial resolution of 1 m. The reliability of this methodology using repeated transects was confirmed by the observation of small bed forms in the 3-D model of the bathymetric surface. This procedure was repeated at different flow conditions: in November 2016 (during falling waters), and at the start of rising waters in April 2017 (Fig. 4).

Figure 4Small bed features (sand dunes) were mapped on the bottom of the river using ADCP repeated transects acquired at different stages of the hydrological regime.
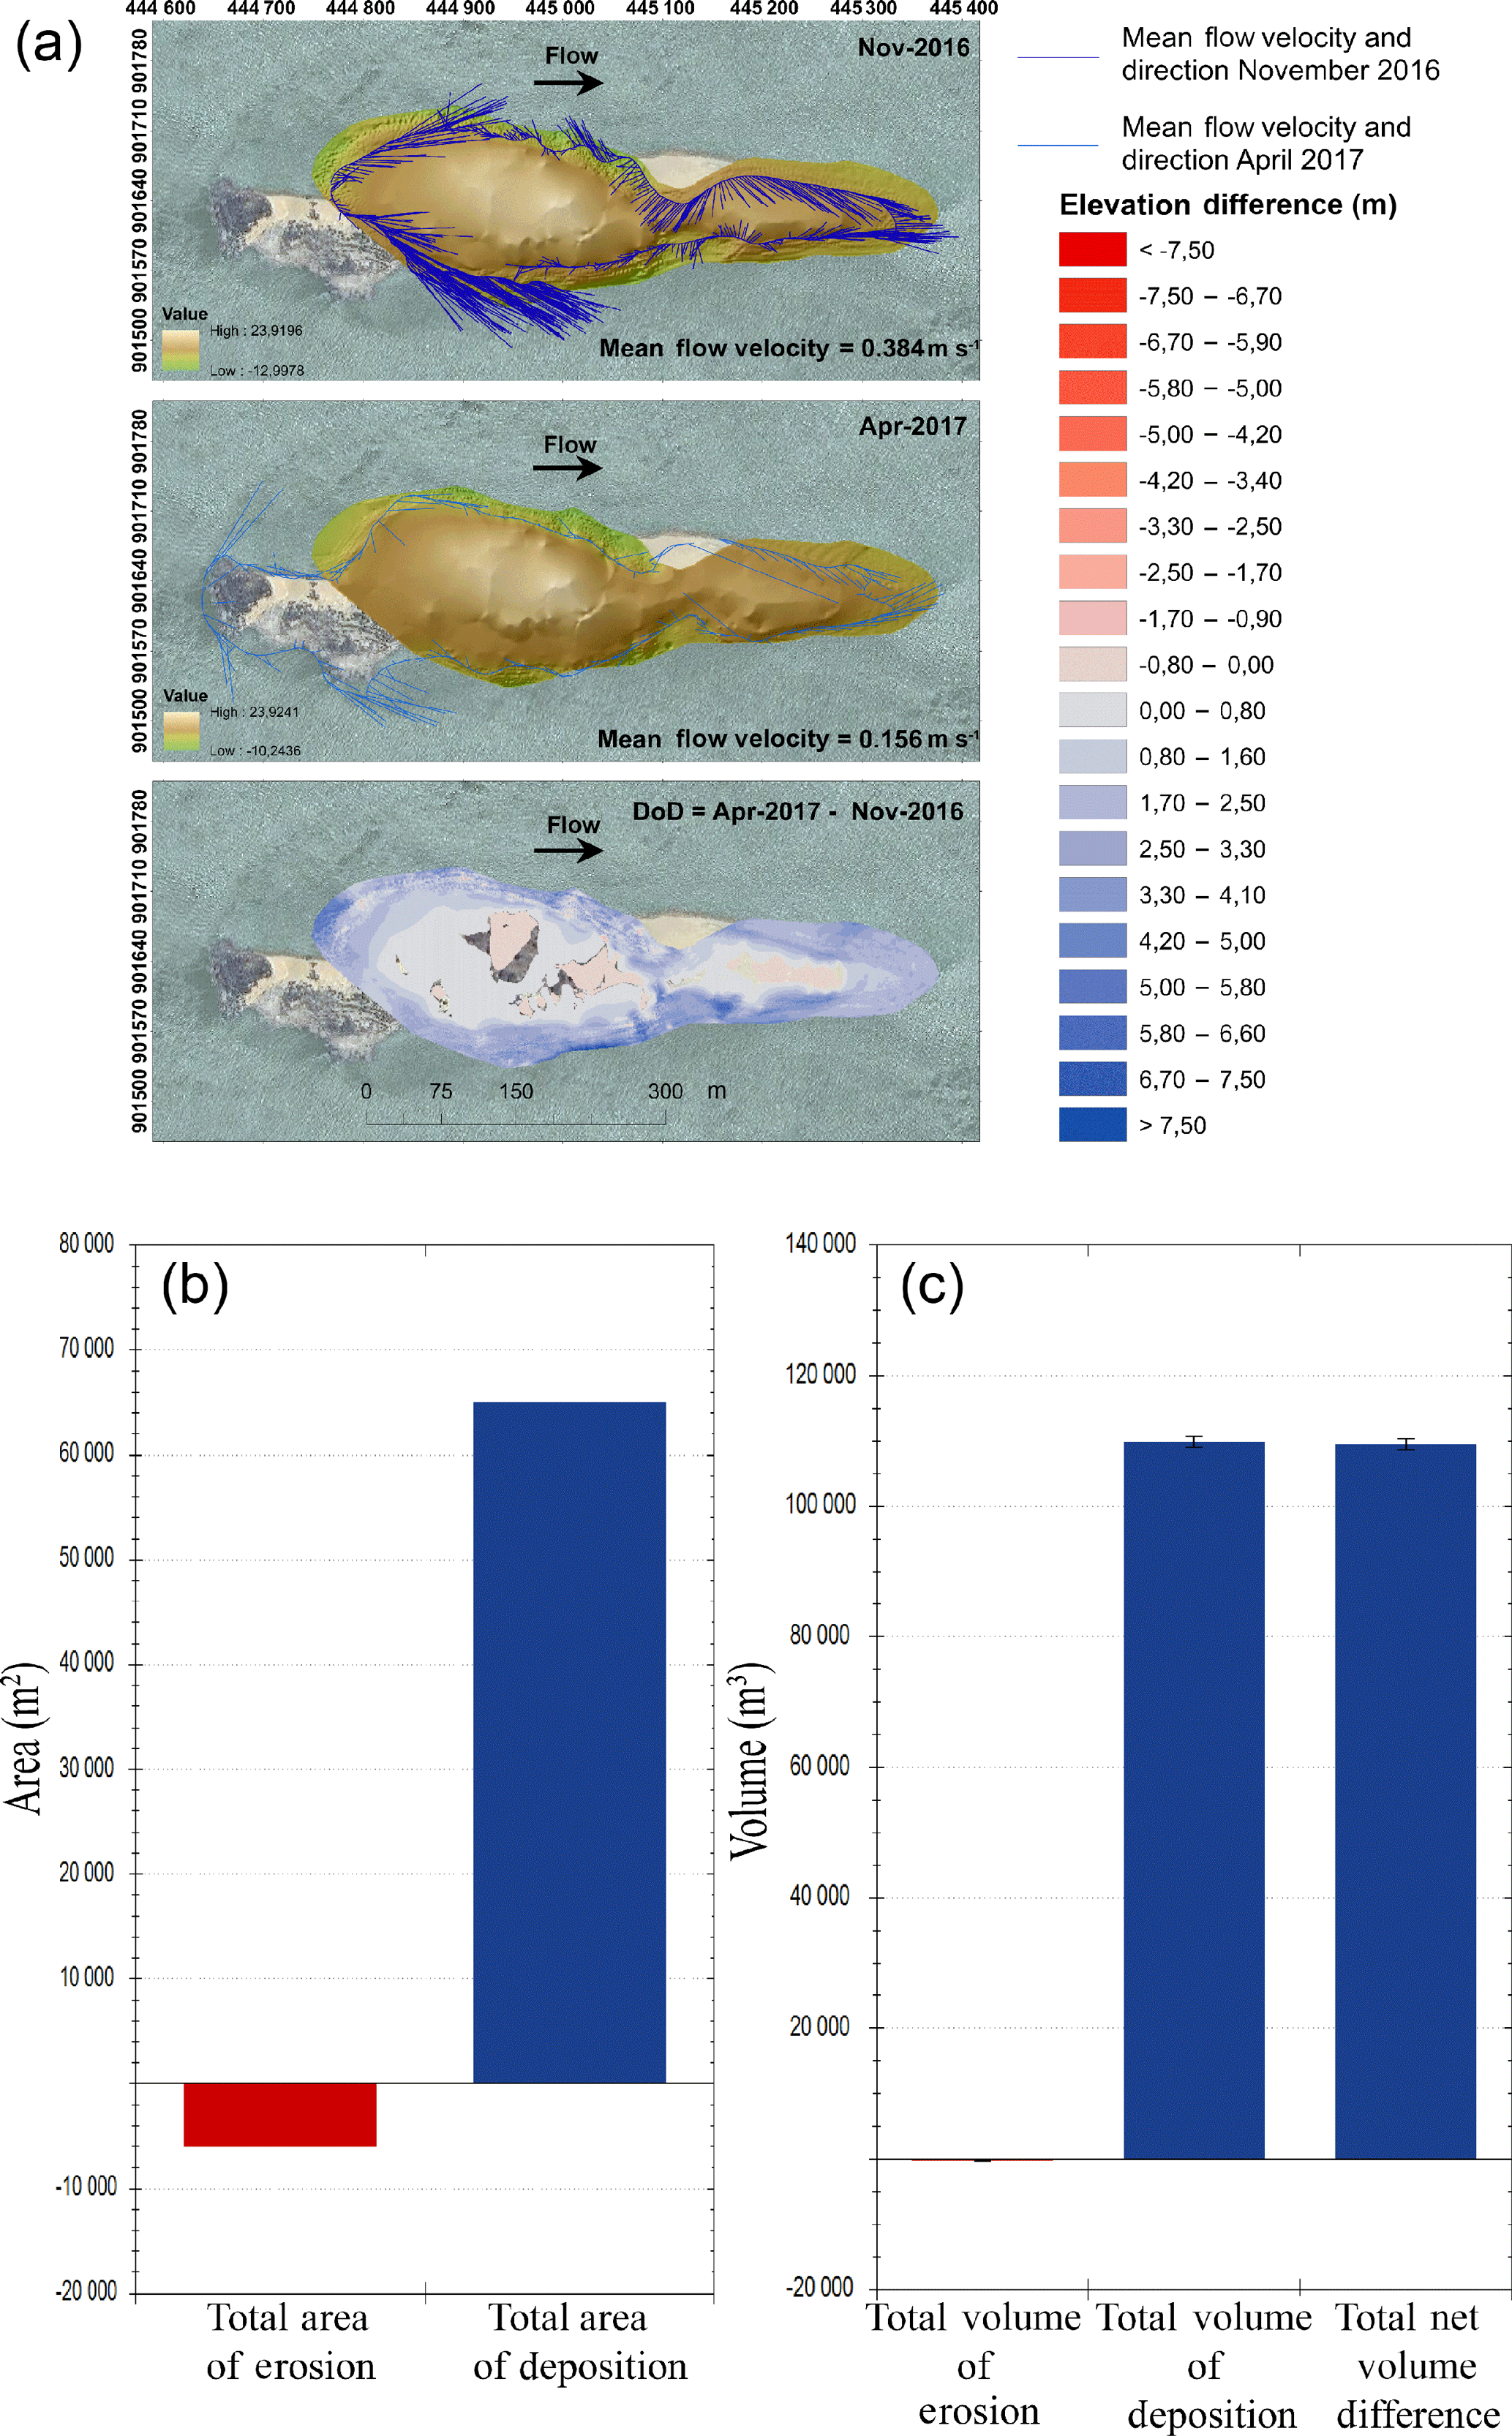
Figure 5(a) DEMs on the two study dates and DoD over the mid-channel bar using LODmin=0.01. In the DoD the red color represents erosion and the blue color deposition. (b, c) show the morphological changes in area (m2) and volume (m3).
As shown in Fig. 5, during the time elapsed between these two surveys, it was possible to analyze mean flow velocity vectors in both periods. A marked decrease of the river flow velocity between the two survey dates occurs, from 0.384 to 0.156 m s−1. The morphological change resulting from the integration of these events can be revealed by subtracting the two (after and before) surface models to generate a DEM of difference. During this study period deposition of sediment occurs on both flanks of the mid-channel bar. This is due to falling water levels that result in deposition of much of the suspended sediment load over the island, promoting vertical growth by sediment accumulation, especially in the sand dune located downstream of the island.
The results from the DoD analysis are shown in Table 2. The total area of sediment along the mid-channel bar was calculated at about 65 037 m2, while the total area of erosion was 6066 m2 during this study period (Fig. 5).
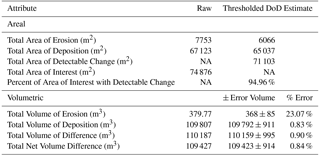
The total volume of sediment was 109 792 ± 911 m3 representing 99.67 % of the total net volume of difference, while the total volume of erosion was 368 ± 85 m3, which represents 0.33 % during the study period. An error assessment was implemented using a LODMin=0.01 calculated by Eq. (1). This value was based on the errors from the manufacturer reported instrument precision used to generate δz(1) and δz(2). To implement the LODMin, the value of δUDoD was applied as a constant threshold across the DoD.
To illustrate the evolution of the mid-channel bar during the period of falling waters a 3-D model was generated showing the topography of the sand bar and surrounding bathymetry at different stages of the river (Fig. 6). The formation of this mid-channel bar is likely related to the complex interaction between the change in discharge and water level in the river, the subsequent adjustment of flow velocity/direction and the sediment transport. Figure 6b shows the distribution of the flow velocity vectors surrounding the mid-channel bar. Here, with the advance of the high flow velocity area downstream, especially during the high water period, material is eroded from the tail of the bar. Eventually, this material is deposited the foot of the front slope of the sand bar, where it accumulates.
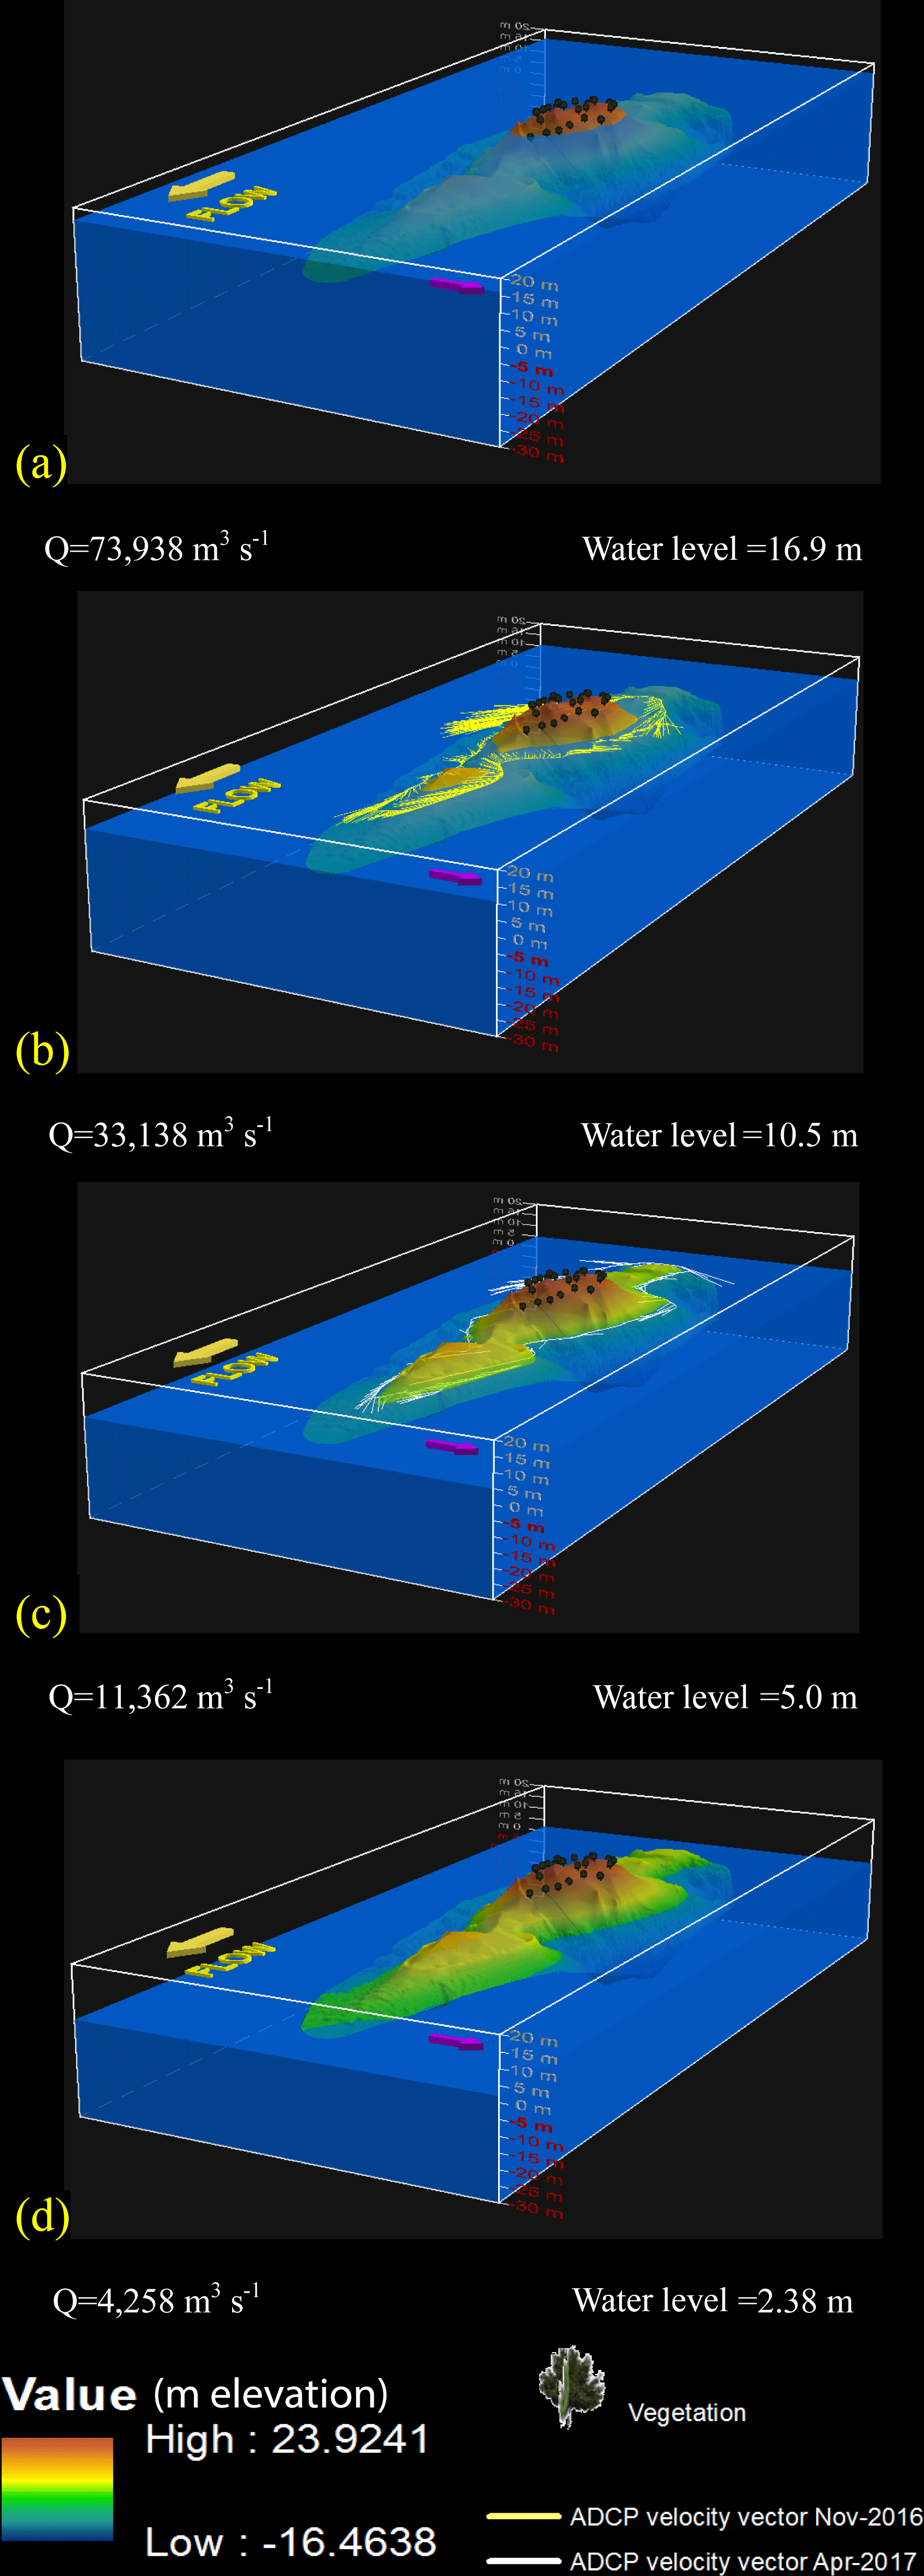
Figure 6Evolution of a mid-channel bar during falling waters. The yellow (b) and white (c) lines that surround the island represent the flow velocity vectors for the periods of high and low waters, respectively.
In Fig. 6c, the discharge decreases and most of the sediment load in suspension is deposited promoting vertical growth. This change in sedimentation volume of the middle channel bar is directly related to the bedload in motion. Analysis of these changes at different river stages may allow us to understand better the dynamics of sediment transport in the bed.
A multimedia file of this simulation is available for downloading from Yepez (2017).
One of the most important aspects of this analysis is that island and bank heights, obtained by repeated ADCP transects in combination with RTK-DGPS measurements, allows the estimation of volume rates of erosion and deposition in an easy to implement manner. Considering that many of the banks are submerged in many sections of the river as well as in the islands, these techniques are suitable for characterizing the submerged portion of the banks and the riverbed.
Although this paper focuses on the estimation of accretion and erosion volumes in this mid-channel bar over just one year, it is necessary to evaluate the same stages of the river in different years, in order to understand changes in the sediment balance throughout the hydrological regime. This is the focus of ongoing study.
4.2 Kinematics of sand dunes at Ciudad Bolivar
The results obtained from the comparison between the May 2016 and November 2016 surveys in this study reach are shown in Fig. 7. In this analysis it is possible to appreciate significant variations in the average rates of migration of the dunes in relation to the discharge. During the rising waters period there was a greater difference between the bathymetry of the two profiles taken 24 h apart compared to during the falling water period.
The highest migration rates (0.07 cm s−1) occur during periods of rising waters compared to the stages of falling waters when migration rates decrease. It is observed that if the dunes are presented with a high frequency and with small sizes during the period of rising waters, the rates will be high. In contrast, in the falling waters stage, the transport of sediment at the same rate in larger dunes implies slower migration rates.
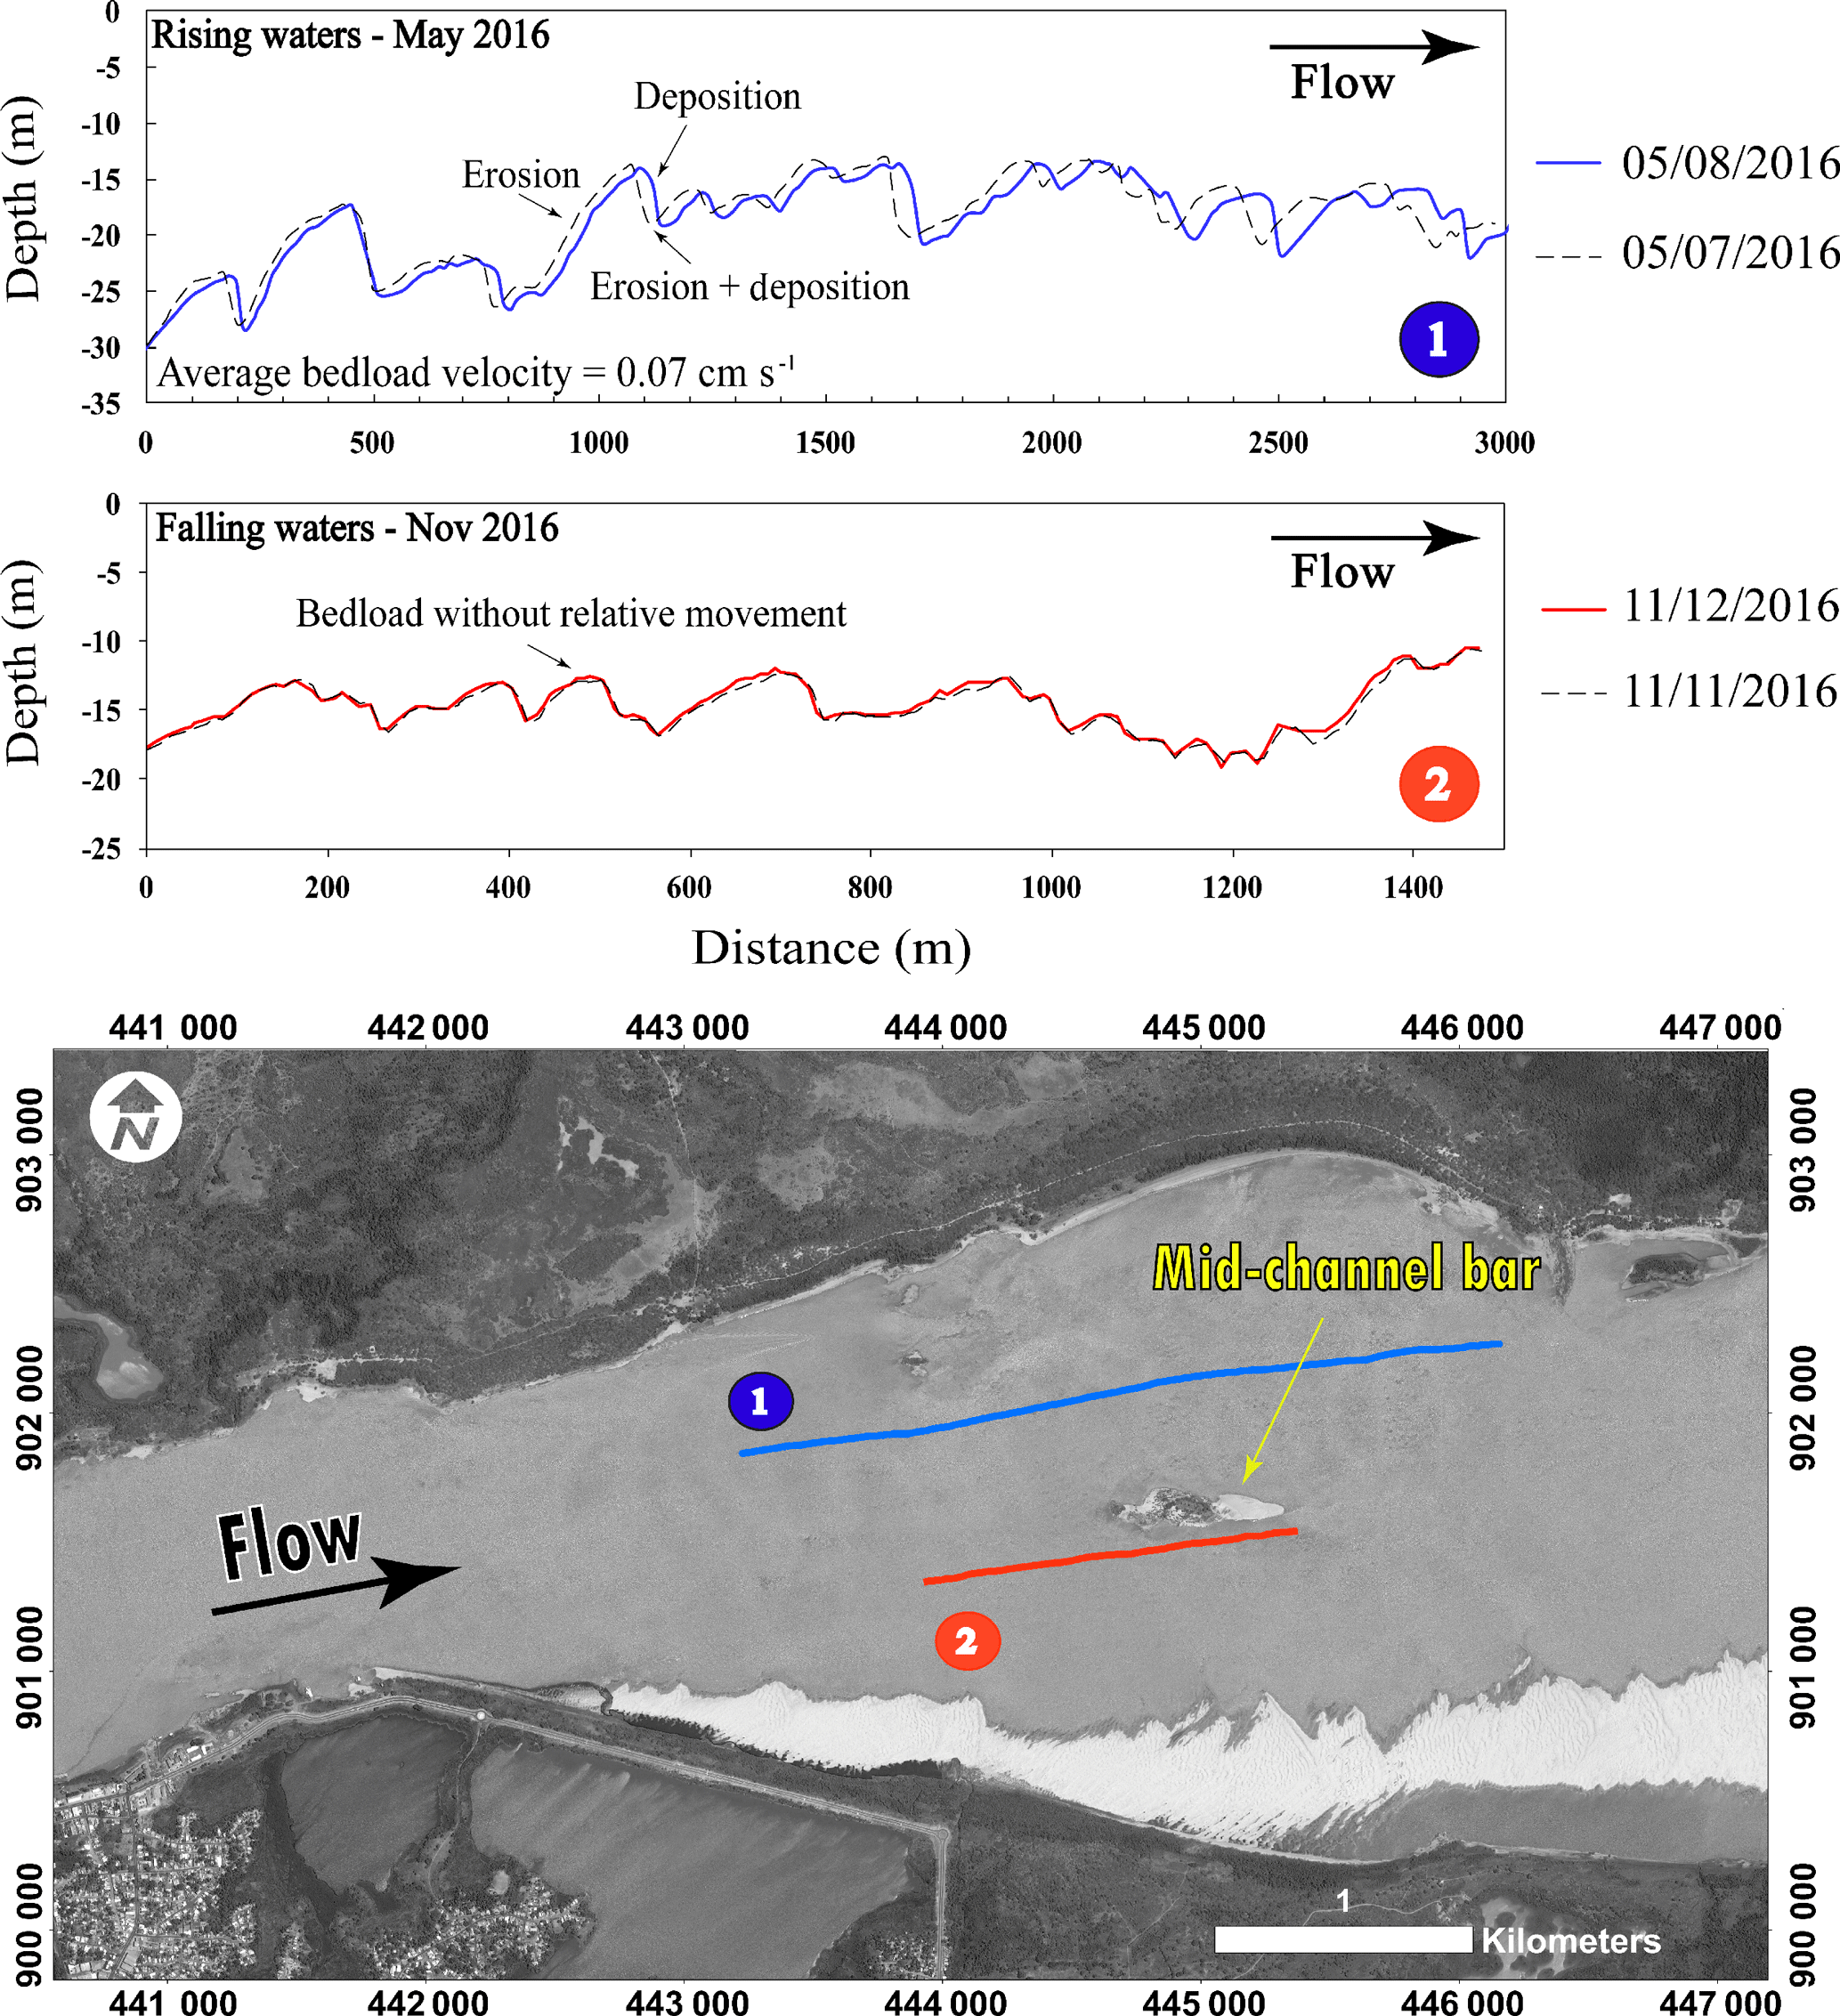
Figure 7Kinematics of sand dunes at Ciudad Bolivar revealed through bathymetric profiles (upper figures) and a plan view of the profile transects (lower figure). (1) corresponds to rising waters, while (2) corresponds to falling waters.
The volume of deposition/erosion over the mid-channel bar, and their interrelationship with discharge in the Orinoco River was estimated through processing from DEM of Difference (DoD) maps on time series of bathymetric and topography data. Likewise, the analysis of longitudinal bathymetric transects 24 h apart, allowed investigation of the evolution and the kinematics of the sand dunes in this study reach. The results of this study highlighted the effect of seasonal floods on bank accretion/erosion in this fluvial island.
Furthermore, several bathymetric transects perpendicular to the flow were repeated every 24 h, which allowed understanding of the migration rates of sand waves and dunes in the study section. These comparisons made in relatively short periods of time facilitated the analysis of the kinematics of the sand dunes, in order to get a clearer idea about the evolution of these bed forms at different flow conditions.
This paper presents a detailed methodology for the collection and processing of data associated with numerical terrain models, allowing measurements of morphological changes of a fluvial island, which is representative of the lower Orinoco, one of the most important rivers in South America and worldwide.
From the results of DoD analysis to quantify the deposition/erosion volume of this mid-channel bar, it was possible to determine that during the time between the two surveys, sedimentation played a more important role than erosion. Also, evaluating the vectors of mean flow velocity in both periods, a marked decrease from 0.384 to 0.156 m s−1 was observed. When the discharge began to decrease, part of the sediment load in suspension was subjected to deposition causing a vertical growth of the sediments on the bar, especially in the most downstream part of the island, where a sand dune developed in a needle shape.
One of the aspects that will have to be addressed in future work will be the sedimentary balance. For this, it is necessary to evaluate the same periods of time in different years to understand the morphological changes during the variations in the hydrological regime. The next field campaigns will focus on these objectives. The quality of the DEMs obtained with the implementation of this combined methodology of ADCP transects and RTK-DGPS measurements allowed high-resolution bathymetric models to be created, where it is possible to observe the sand-wave patterns.
Enhancing knowledge of the role of morphological changes (volume) with this new methodology is an opportunity to gain better understanding of river bed sediment transport. This type of study will support dredging projects in the Orinoco River to maintain navigability, which will contribute to the management of this important river basin.
A multimedia file of this simulation is available for downloading from Yepez (2017).
The authors declare that they have no conflict of interest.
This article is part of the special issue “Water quality and sediment transport issues in surface water”. It is a result of the IAHS Scientific Assembly 2017, Port Elizabeth, South Africa, 10–14 July 2017.
The field campaigns on the Orinoco River were supported by the SO-HYBAM
project and ECOS-Nord/Fonacit (V14U01), as well as by the Bolivarian
National Armada of Venezuela and COEA-IVIC laboratory. The first author was
financially supported by IRD-ARTS Grant 2017-2018 and Venezuela's
Fundayacucho Grant No. E-223-14-2014-2. The paper greatly benefited
from the thorough reviews of anonymous referees.
Edited by: Kate Heal
Reviewed by: two anonymous referees
Acuña, G.: VGM 17, el nuevo modelo geoidal LGFS-LUZ de ultra-alta-resolución 30 × 30 m para Venezuela y regiones vecinas, Notas de Geodesia Geométrica, Laboratorio de Geodesia Física y Satelital, Dpto. de Geodesia Superior, Escuela de Ingeniería Geodésica, Facultad de Ingeniería, La Universidad del Zulia, February 2017, in preparation, available at: http://ggenluz.blogspot.fr/2017/01/comienza-la-produccion-de-vgm17-el.html (last access: 5 February 2018), 2017.
Brasington, J., Langham, J., and Rumsby, B.: Methodological sensitivity of morphometric estimates of coarse fluvial sediment transport, Geomorphology, 53, 299–316, https://doi.org/10.1016/S0169-555X(02)00320-3, 2003.
Carrivick, J. L., Geilhausen, M., Warburton, J., Dickson, N. E., Carver, S. J., Evans, A. J., and Brown, L. E.: Contemporary geomorphological activity throughout the proglacial area of an alpine catchment, Geomorphology, 188, 83–95, https://doi.org/10.1016/j.geomorph.2012.03.029, 2013.
Depetris, P. J. and Paolini, J.: Biogeochemical aspects of South American rivers: The Paraná and the Orinoco, in: Biogeochemistry of Major World Rivers, edited by: Degens, E. T., Kempe, S., Richey, J., J. Wiley & Sons, Chichester, 105–125, 1991.
Dinehart, R. and Burau, J.: Repeated surveys by acoustic Doppler current profiler for flow and sediment dynamics in a tidal river, J. Hydrol., 314, 1–21, https://doi.org/10.1016/j.jhydrol.2005.03.019, 2005.
Fuller, I., Passmore, D., Heritage, G., Large, A., Milan, D., and Brewer, P.: Annual sediment budgets in an unstable gravel-bed river: the River Coquet, northern England, Geological Society, London, Special Publications, 191, 115–131, https://doi.org/10.1144/GSL.SP.2002.191.01.08, 2002.
Laraque, A., Castellanos, B., Steiger, J., Lopez, J. L., Pandi, A., Rodriguez, M., Rosales, J., Adèle, G., Perez, J., and Lagane, C.: A comparison of the suspended and dissolved matter dynamics of two large inter-tropical rivers draining into the Atlantic Ocean: the Congo and the Orinoco, Hydrol. Process., 27, 2153–2170, https://doi.org/10.1002/hyp.9776, 2013.
Lawler, D., Grove, J., Couperthwaite, J., and Leeks, G.: Downstream change in river bank erosion rates in the Swale-Ouse system, northern England, Hydrol. Process., 13, 977–992, https://doi.org/10.1002/(SICI)1099-1085(199905)13:7<977::AID-HYP785>3.0.CO;2-5, 1999.
Lewis Jr., W. M. and Saunders III, J. F.: Cross-sectional variation in the chemistry and suspended sediment load of the Orinoco River at Ciudad Bolívar, Acta Cientifica Venezolana, 35, 382–385, 1984.
Lewis Jr., W. M. and Saunders III, J. F.: Concentration and transport of dissolved and suspended substances in the Orinoco River, Biogeochemistry, 7 , 203–240, 1989.
Leyland, J., Hackney, C. R., Darby, S. E., Parsons, D. R., Best, J. L., Nicholas, A. P., Aalto, R., and Lague, D.: Extreme flood-driven fluvial bank erosion and sediment loads: direct process measurements using integrated Mobile Laser Scanning (MLS) and hydro-acoustic techniques, Earth Surf. Proc. Land., 42, 334–346, https://doi.org/10.1002/esp.4078, 2016.
López, J. and Perez-Hernandez, D.: Some Morphological Aspects of the Orinoco River, in: IAHR Symposium on River, Coastal and Estuarine Morphodynamics, Genova, Italy, 6–10 September 1999.
Mat Salleh, M. and Ariffin, J.: Flow and Sediment Matrix in Mid-Channel Bar Formation, Int. J. Sci. Eng. Res., 4, 1757–1764, 2013.
Paolini, J., Hevia, R., and Herrera, R.: Transport of carbon and minerals in the Orinoco and Caroni rivers during the years 1983–1984, Mitteilungen aus dem Geologisch-Paläontologischen Institut der Universität Hamburg, 64, 325–338, 1987.
Parsons, D., Jackson, P., Czuba, J., Engel, F., Rhoads, B., Oberg, K., Best, J., Mueller, D., Johnson, K., and Riley, J.: Velocity Mapping Toolbox (VMT): a processing and visualization suite for moving-vessel ADCP measurements, Earth Surf. Proc. Land., 38, 1244–1260, https://doi.org/10.1002/esp.3367, 2013.
Silva León, G.: La cuenca del río Orinoco: visión hidrográfica y balance hídrico (The Orinoco River basin: hydrographic view and its hydrological balance), Revista Geografica Venezolana, 46, 75–108, 2005.
Warne, A. G., Meade, R. H., White, W. A., Guevara, E. H., Gibeaut, J., Smyth, R. C., Aslan, A., and Tremblay, T.: Regional controls on geomorphology, hydrology, and ecosystem integrity in the Orinoco Delta, Venezuela, Geomorphology, 44, 273–307, https://doi.org/10.1016/S0169-555X(01)00179-9, 2002.
Wheaton, J. M., Brasington, J., Darby, S. E., and Sear, D. A.: Accounting for uncertainty in DEMs from repeat topographic surveys: improved sediment budgets, Earth Surf. Proc. Landf., 35, 136–156, https://doi.org/10.1002/esp.1886, 2010.
Williams, R.: DEMs of difference, Geomorphological Techniques, vol. 2, no 3.2, 2012.
Williams, R., Brasington, J., Vericat, D., Hicks, M., Labrosse, F., and Neal, M.: Chapter twenty-monitoring braided River change using terrestrial laser scanning and optical bathymetric mapping, Dev. Earth Surf. Proc., 15, 507–532, https://doi.org/10.1016/B978-0-444-53446-0.00020-3, 2011.
Yepez, S., Laraque, A., Martinez, J. M., De Sa, J., Carrera, J. M., Gallay, M., and Lopez, J. L.: Retrieval of suspended sediment concentrations using LANDSAT-8 OLI data in the Orinoco River (Venezuela), Journée Thématique du Programme National de Télédétection Spatiale: Apport des missions Sentinel – Copernicus à l'observation de la Terre, CNES, Paris, 24 March, https://doi.org/10.13140/RG.2.2.36296.32005, 2016.
Yepez, S.: Evolution of a mid-channel bar during falling waters (Orinoco River – Venezuela), https://doi.org/10.13140/RG.2.2.14443.64802, 2017.