the Creative Commons Attribution 4.0 License.
the Creative Commons Attribution 4.0 License.
 | 29 May 2018
Impacts of landcover changes on streamflows in the Middle Zambezi Catchment within Zimbabwe
Webster Gumindoga
Hodson Makurira
Bezel Garedondo
We investigate the impacts of land cover changes on the river flows of the Middle Zambezi tributary catchments in Zimbabwe. Trend analysis on rainfall and streamflow was carried out using the Mann-Kendall test at monthly and annual time steps. Rainfall analysis indicated an increasing trend which was not statistically significant (p<0.05) for all stations. Annual streamflow time series indicated negative decreasing trends which were not statistically significant (p<0.05) except for the rainfall months of November and December. The study deduced that the changes in rainfall did not affect hydrological catchment behaviour and changes in streamflow were thus caused by anthropogenic factors such as land cover changes. Statistical tests indicated a weak but significant correlation between rainfall and streamflow which also supports the fact that changes in streamflow are mainly driven by land cover changes. Land cover change assessments were done through supervised classification of Landsat images for the years 1989, 1998, 2008 and 2014. All catchments exhibited increases in cultivation area and decreases in forest and grassland. The semi-distributed HBV-Light model was applied for change detection modelling of the gauged Musengezi catchment. We conclude that the HBV Light model can be successfully used to simulate flows for the catchment.


The Zambezi River Basin is the fourth largest African freshwater catchment and the largest river system in Southern Africa covering an area of 1.37 million km2 with a discharge averaging around 2600 m3 s−1 into the Indian Ocean (Beilfuss, 2012). The population of the basin is estimated at over 30 million (World Bank, 2010). Approximately 7.5 million (25 %) live in the main urban centres and the remainder in rural areas (ZAMCOM/SADC/SARDC, 2015). The expected increase in population, hence increase in consumptive use, will be coupled with land use changes that may, in turn, have an impact on the flow regimes of the basin. The Middle Zambezi part of the basin in Zimbabwe is also experiencing these increased pressures including increasing demands for water. Besides population increase, changes in agricultural practices and deforestation have been witnessed. It is necessary to investigate to what level these environmental pressures influence river flow changes and, also, to propose measures to mitigate negative impacts on river flow regimes. Land use and land cover change drives many environmental models such as hydrological models within large and smaller river basins. The recent interests towards integrated management of land and water has renewed the need of quantifying the hydrological impacts of land use changes (Gumindoga et al., 2014) The integrated management of land and water resources will facilitate more productive and sustainable utilisation of the natural resources available in the basin.
This study seeks to understand and quantify the impacts of land cover changes on river flows in the Middle Zambezi Basin so as to devise ways of mitigating their impacts. GIS and remote sensing techniques will be integrated into a semi-distributed hydrological model to evaluate the historical impacts. This improved understanding on hydrology, land use management, land cover change interactions is critical for improved water and ecosystem management.
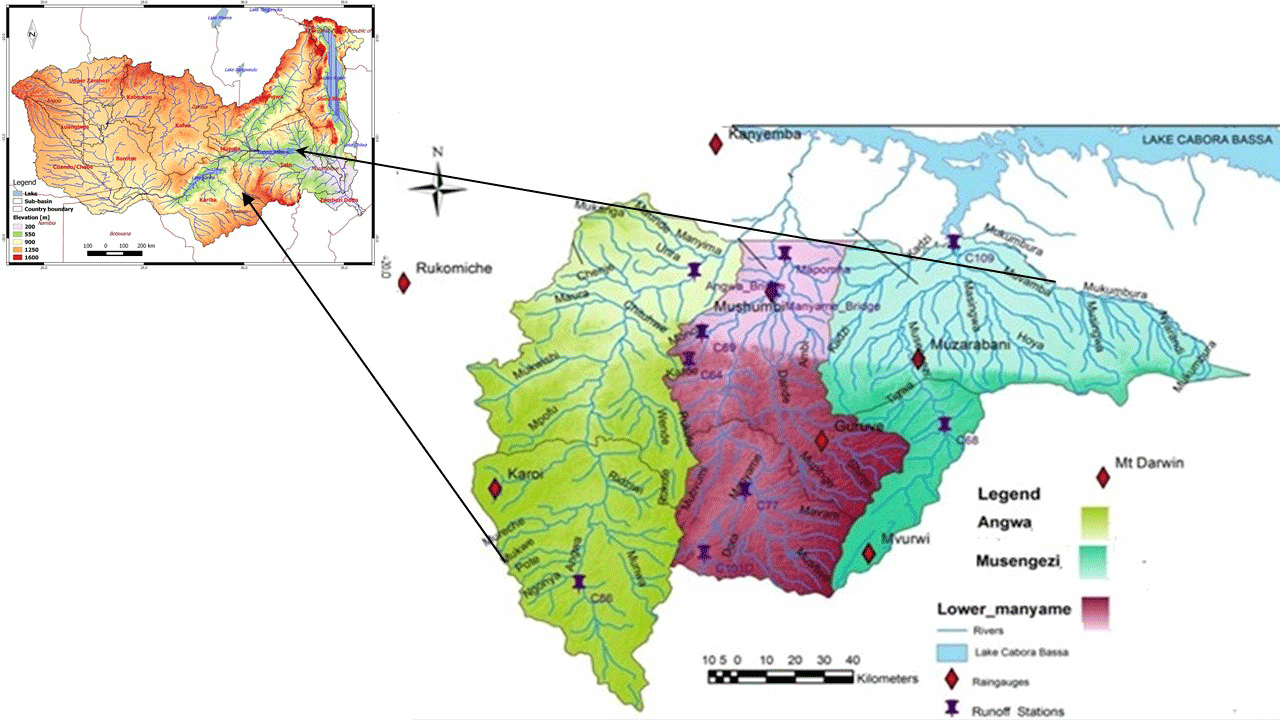
Figure 1Zambezi River Basin with sub basins, major lakes, rivers, elevation. The location of Angwa, Lower Manyame and Musengezi Catchments from the Zambezi Basin is also shown.
The Middle Zambezi Basin stretches from Victoria Falls to Lake Cabora Bassa. On the Zimbabwe side it has many tributaries and amongst them are the Angwa, Lower Manyame and Musengezi catchments all these draining directly into Lake Cabora Bassa (Fig. 1). Only Manyame River is perennial, with the rest being ephemeral. These three river systems are part of the Manyame Catchment of Zimbabwe. The Angwa catchment has a total area of 9479 km2, and is made up of two subzones CA1 and CA2 according to the ZINWA subzone demarcations. The Lower Manyame catchment, comprising of two sub zones CH1 and CH2, has a total area of 6308 km2. The Musengezi catchment with subzones CUG1 and CUG2 has a total area of 6925 km2. All, except for the Manyame, are independent of upstream flow contributions.
The lower parts of these catchments lie in the Zambezi Valley in the Mbire and Muzarabani districts and experience flash floods which are partly a result of backwater effects when the downstream Lake Cahora Bassa records high storages as well as flows from upper catchments of the main rivers (Matingo, 2017). Average daily temperatures in the three catchments range from 24 to 32 ∘C, with the highest temperatures recorded on the northern parts of the catchments in the Zambezi valley reaching as high as 40 ∘C. The Mbire and Muzarabani districts receive low rainfall of approximately 450–650 mm year−1 and is classified as one of the driest agro ecological regions of Zimbabwe.
3.1 Data acquisition
3.1.1 Hydro-meteorological data
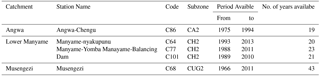
Runoff data was obtained for four stations (C86, C64, C77, C77, C101 and C68) in the lower Manyame, Musengezi and Angwa catchments. The stations have varied lengrhs of records ranging between 19 and 43 years. The details of runoff and rainfall stations are outlined in Table 1.
3.1.2 Satellite images
Freely available Landsat images were acquired from https://earthexplorer.usgs.gov/ (last access: 23 May 2018). The data was used for land use and land cover change mapping for Angwa, Lower-Manyame and Musengezi catchments. Landsat TM, ETM+ and Landsat 8 images were acquired between the years 1989 and 2014 which had approximately similar rainfall and distribution for each study catchment. The images were for the same season between June and September being the dry season for the three catchments. During the dry season, chances of obtaining minimum cloud cover of, preferably 0 %, are high. In addition, during this cool dry season, grass would have senesced, while the crops would have been removed from the fields thus allowing for better classification of land cover. The Angwa catchment is covered by four tiles with path/row combination 170/071, 170/072, 171/071 and 171/072. The lower Manyame catchment is covered by 2 tiles path/row combination 170/071 and 170/072. The path/row combination for the 3 tiles covering Musengezi catchment is 170/071, 170/072 and 169/071.
3.1.3 Digital Elevation Data
In hydrologic modelling, high-resolution spatially distributed elevation data is required. The ASTER (30 m resolution) DEM required for DEM hydro-processing (catchment extraction) in ILWIS Software was downloaded from https://earthexplorer.usgs.gov/ (last access: 23 May 2018).
3.1.4 Evapotranspiration
Evapotranspiration was derived from Moderate Resolution Imaging Spectroradiometer (MODIS 16) satellite. The data was obtained for monthly time steps and was then processed in ILWIS to get the monthly average evapotranspiration over the gauged part of Musengezi catchment.
3.2 Trend analysis in rainfall and stream flow
The hydrological functions of a catchment can be altered by climatic factors and human interferences which can be evaluated through trend analysis of hydro-meteorological records (Rientjes et al., 2011). The study determined trends in streamflows at stations C68, C86, C77 and C101. Rainfall data was obtained for Guruve, Muzarabani, Kanyemba, Karoi, Rukomiche, Mvurwi and Mt. Darwin stations.
The data was tested for normally distribution, stationarity, consistency and homogeneity as described in Dahmen and Hall (1990). The hydro-meteorological data was visually screened perfore perfoming normality tests, plausibility checks, data consistency and homogeneity tests and trend analyses (Uhlenbrook et al., 2010). The Mann–Kendall (MK) test, a non-parametric rank based method was used to test for trends in the streamflow records and long-term rainfall (Mann, 1945; Kendall, 1975) as given in Eq. (1):
With standard deviation:
Where:
-
-
n is the number of data
-
Yj and Yi are the data values in two consecutive periods
-
ti is the number of ties, i.e. equal values, of extent i and n is the number of tied groups.
The test statistic S is asymptotically normal with zero mean and standard deviation σs; as computed from Eq. (3) (Hirsch and Slack, 1984). For cases where the sample size n is larger than 10, the standard normal variate p is computed by using the following equation (Rientjes et al., 2011).
Upward trends are characterised by a positive value of S, whilst downward trends signal a negative value (Partal and Kahya, 2006).
3.3 Change detection in rainfall and streamflow
The year at which there was a change in stream flow was identified using the moving average t test (Rientjes et al., 2011; Zheng et al., 2007). The test statistic of the t test is given by:
and
Where:
-
x1 and x2 = mean annual stream flow of the N years before the potential change point and the N years after the potential change point, respectively;
-
N1 and N2 = the number of years in the first and second period;
-
s1 and s2 = standard deviations in the first and second periods;
-
s = pooled standard deviation.
N1 and N2 was equal for this study. Flow indices in each period were estimated, after having identified periods where mean annual flows are significantly different. These statistics include a high flow index (Q5/Q50) and a low flow index (Q95/Q50), where Qk is the flow with probability of exceedance of k % of the time. The Weibull plotting position formula was applied to estimate exceedance probabilities as the approach relates to minima (i.e. smallest extreme values) as compared to Gumbel and Fréchet formula, for instance, that relate to maxima (i.e. largest extreme values).
3.4 Image classification for Land use/cover Changes
Processing of the downloaded images involved image rectification or geo-referencing and image enhancement. Image enhancement was done by preparing a colour composite of Landsat bands 5, 4 and 3 for Landsat TM images and bands 6, 5, 4 for Landsat 8 images (images visualised in their true colour) for each study year and catchment. The ILWIS software was used to perform image analysis and classification to obtain the land cover map. Ground truthing was achieved using a handheld GPS where a total of 150 points corresponding to the different landcover classes were taken for accuracy assessment.
Table 2The Mann Kendal test statistic (Test Z) for trend analysis for monthly and annual rainfall for Mvurwi, Guruve and Muzarabani and the Sen's slope estimate (Q).
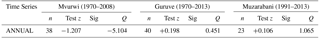
The “+” sign means an increasing trend and the “−” sign means a decreasing trend. *: statistically significant at 5 % level.
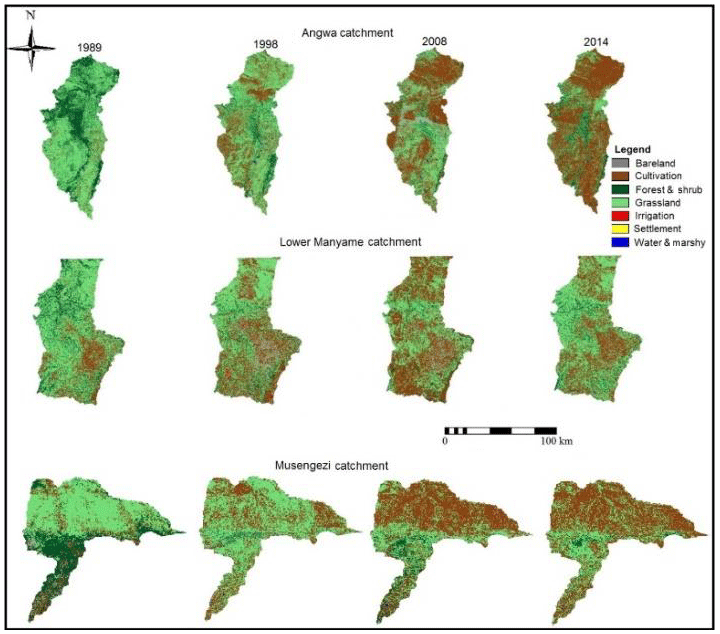
Figure 2Middle Zambezi catchment land cover classification results for the years 1989, 1998, 2008 and 2014.

Figure 3(a) Observed and simulated streamflow at C68 (1998–2008) and (b) streamflow hydrograph comparisons under the four land cover change periods.
3.5 Determining the impacts of land use and land cover changes on the streamflows using the HBV Light Model
The HBV light model (Seibert and McDonnell, 2010) was applied to examine the time series of model residuals which basically means calibration for a period before (or after) change and simulation of runoff that would have been observed without land-cover changes (reconstruction of natural runoff series) following Seibert and McDonnell (2010). Runoff was simulated at a daily timesteps with daily precipitation and temperature and monthly long term potential evapotranspiration as input variables to the model (Seibert and Vis, 2012). Areal rainfall and temperature time series were interpolated for different elevation zones. The semi-distributed model structure was adopted with three vegetation zones for each of the 6 elevation zones. The classified land cover maps for the year 2008 were then used to define vegetation zones in each catchment which include cultivation, water and forest. The DEM was used for estimation of catchment boundaries and elevation.
Daily discharge data obtained from ZINWA for gauging station C68 was also used as input into the model as well as average daily rainfall and mean temperatures of the surrounding stations (Mvurwi, Guruve and Muzarabani) obtained from the Meteorological Office.
3.6 Model Calibration and validation
Model calibration (October 1998 to September 2006) was achieved by use of Monte Carlo simulations (MCs) procedure, where best performing parameter sets were randomly generated from various model simulations. Model parameters were then manually adjusted, in order to obtain a process-based representation of the hydrological characteristics in the study catchments (Uhlenbrook et al., 2010). The objective of MCS is to explore the entire parameter space to find the best performing parameter sets. The Nash–Sutcliffe efficiency (Nash and Sutcliffe, 1970) (NSE) and the relative volumetric error (RVE) were used to assess the model efficiency. Model validation was done for the period October 2007 to September 2008.
3.7 Model application for land cover change impacts
The land cover map for the year 2008 was used in calibrating the model and obtaining of optimal parameter sets as available meteorological data was up to the year 2008. Parameters were calibrated for a reference period and the simulated runoff compared to observed runoff in periods with potential change (Seibert and McDonnell, 2010). To detect if there has been any changes as a result of land use, all the optimized parameters and the input variables derived from running the model for the period 2000 to 2008 were held constant as in Gumindoga et al. (2014), then the land cover parameters were varied to 1989, 1998 and 2014 ones and the model simulated again to observe if there were any differences to the runoff simulated In the model setup, only the catchment characteristics derived from land cover maps were changed, the precipitation, temperature and evapotranspiration values which were applied to simulations for the period 1998 to 2008 remained unchanged thus model forcing remained unchanged making the effect of land cover change explicit in the model though this maybe an over simplification.
4.1 Rainfall trend analysis
Results of the trend test for Mvurwi, Guruve and Muzarabani indicated that there was a decreasing trend in the monthly received rainfall for September, October and December to July (Table 2). The month of May is the only month that had a statistically significant decreasing trend at 5 % level of significance.
The Sen's estimator (Q) for true slope of linear trend showed negative slopes for seven months of the year that include the rainfall season months for Zimbabwe and a positive slope for November. The dry season periods of June to September showed zero for the Sen's slope.
Similarly, trends for Kanyemba station were not significant for all months while Rukomiche station showed an increasing trend for months of December, January and March which are all in the wet season.
Trends for Karoi station were found to be statistically insignificant for all months of the year. All the trends for Mt Darwin station were not significant.
4.2 Streamflow trend analysis
Analysis of annual streamflow for station C68 located in Musengezi catchment showed a negative trend that is not statistically significant (p=0.05). Analysis on monthly streamflows showed negative, downward trends for eleven months of the year and a positive trend for February only. Months in the dry season between May and August showed statistically significant negative downward trends.
Statistically significant trends were also indicated for the months of November and December which all fall within the rainy season. Streamflows at station showed three clear segments where change of trend was detected. The mean annual discharge was 3.26 m3 s−1 for the period 1967 to 1972, then increased to 4.97 m3 s−1 for the period 1976 to 1983 and decreased to 4.74 m3 s−1 between 1995 to 2011.
Monthly streamflows at C101 in Lower Manyame Catchment showed significant negative, downward trends for the months of July, August and November while trends for all the other months were not significant at p=0.05 with June and September showing negative trends and the rest of the months showing positive increasing trends.
4.3 Results of image classification
Land cover changes were analysed for the period 1989, 1998, 2008 and 2014 for the three study catchments of Angwa, Lower Manyame and Musengezi. All catchments exhibited increases in cultivation area and decreases in forest and grassland (Fig. 2). The overall accuracy for Angwa catchment, Lower-Manyame and Musengezi Catchment is 88.57, 85.71 and 86.54 % respectively. Results of the overall accuracies are all above 85 % which means the images represent well the land cover features on the ground and are therefore suitable for further use. Highest accuracies were obtained for Bareland, Water and Marshy, Cultivation and Irrigation.
4.4 Model calibration and validation results
For calibration period, a reasonably good model performance with a Nash Sutcliffe Efficiency (NSE) of 0.61 was obtained using the land cover map of 2008 which were considered as the baseline conditions. A Relative Volume Error (RVE) and Percentage Bias (PBIAS) of 7.2 and 8.5 % respectively were obtained which as well indicates a reasonable performance. The model underestimated the peak flows and overestimated the low flows. The model validation was for the period 2006 to 2008. The model reproduced the observed streamflow hydrograph but under estimated the peak flows as a result underestimating the total observed streamflows. A NSE of 0.57 was obtained with a RVE and PBIAS of 8.9 and 8.7 % respectively indicating a reasonable model performance as well.
4.5 Simulation results under land cover changes
Simulation results for the period 1998 to 2008 served as the reference to simulations of the historic and future periods (Fig. 2: top). The simulations followed the pattern in the observed streamflow. However, it was observed that peak flows were under estimated and low flows over estimated. The simulated hydrographs represented the baseflows well. Figure 3b shows the streamflow hydrograph comparisons under the four land cover change periods.
-
Increasing but insignificant trends were observed in rainfall received over the studied catchments while decreasing insignificant trend were observed in streamflows. This strongly suggests that the changes observed in streamflows are not directly caused by changes in rainfall but other drivers such as, possibly, land use changes.
-
Angwa, Lower Manyame and Musengezi have undergone notable land use and land cover changes over time.
-
Change detection modelling results indicated that changes in streamflows are caused by land use and land cover changes as was indicated by the changed simulation results of the mean flows and peak flows between the period 1989 and 1998 to 2014.
We recommend for policies that curb massive human induced deforestation that has been affecting the Middle Zambezi Basin. The cultivation of flood-prone land should also be prohibited. The regular analysis of land cover change on hydro-meteorological time series is urgently needed to ascertain the scales of changes from time to time. Integrated land use plans should be developed and implemented. Future studies should estimate actual evapotranspiration to evaluate how the basin water balance is affected by deforestation and land use changes.
Data are not publicly accessible due to restrictions imposed by the supplier of the data.
The authors declare that they have no conflict of interest.
This article is part of the special issue “Understanding spatio-temporal variability of water resources and the implications for IWRM in semi-arid eastern and southern Africa”. It is a result of the IAHS Scientific Assembly 2017, Port Elizabeth, South Africa, 10–14 July 2017.
The authors greatly appreciate the DANIDA Fellowship under the
WaterNet Phase 3 for funding this research.
Edited by: Jean-Marie Kileshye-Onema
Reviewed by: two anonymous referees
Beilfuss, R.: A Risky Climate for Southern African Hydro: Assessing hydrological risks and consequences for Zambezi River Basin dams, International Rivers Network (IRN), 60 pp., https://doi.org/10.13140/RG.2.2.30193.48486, 2012.
Dahmen, E. and Hall, M. J.: Screening of hydrological data: tests for stationarity and relative consistency, 49, International Institute for Land Reclamation and Improvement, Wageningen, the Netherlands, 1990.
Gumindoga, W., Rientjes, T., Shekede, M. D., Rwasoka, D. T., Nhapi, I., and Haile, A. T.: Hydrological Impacts of Urbanization of Two Catchments in Harare, Zimbabwe, Remote Sens.-Basel, 6, 12544–12574, 2014.
Hirsch, R. M. and Slack, J. R.: A nonparametric trend test for seasonal data with serial dependence, Water Resour. Res., 20, 727–732, 1984.
Kendall, M.: Rank correlation measures, Charles Griffin, London, 202, 1975.
Mann, H. B.: Nonparametric tests against trend, Econometrica, 13, 245–259, 1945.
Matingo, T.: Evaluation of sub daily satellite rainfall estimates through flash flood modelling in the Lower Middle Zambezi Basin, MSc Thesis, University of Zimbabwe, Department of Civil Engineering, 2017.
Nash, J. and Sutcliffe, J.: River flow forecasting through conceptual models part I – A discussion of principles, J. Hydrol., 10, 282–290, 1970.
Partal, T. and Kahya, E.: Trend analysis in Turkish precipitation data, Hydrol. Process., 20, 2011–2026, 2006.
Rientjes, T. H. M., Haile, A. T., Kebede, E., Mannaerts, C. M. M., Habib, E., and Steenhuis, T. S.: Changes in land cover, rainfall and stream flow in Upper Gilgel Abbay catchment, Blue Nile basin – Ethiopia, Hydrol. Earth Syst. Sci., 15, 1979–1989, https://doi.org/10.5194/hess-15-1979-2011, 2011.
Seibert, J. and McDonnell, J. J.: Land-cover impacts on streamflow: a change-detection modelling approach that incorporates parameter uncertainty, Hydrolog. Sci. J., 55, 316–332, 2010.
Seibert, J. and Vis, M. J. P.: Teaching hydrological modeling with a user-friendly catchment-runoff-model software package, Hydrol. Earth Syst. Sci., 16, 3315–3325, https://doi.org/10.5194/hess-16-3315-2012, 2012.
Uhlenbrook, S., Mohamed, Y., and Gragne, A. S.: Analyzing catchment behavior through catchment modeling in the Gilgel Abay, Upper Blue Nile River Basin, Ethiopia, Hydrol. Earth Syst. Sci., 14, 2153–2165, https://doi.org/10.5194/hess-14-2153-2010, 2010.
World Bank: The Zambezi River Basin: A Multi-Sector Investment Opportunities Analysis – Summary Report, World Bank, available at: https://openknowledge.worldbank.org/handle/10986/2958 (last access: 23 May 2018), 2010.
ZAMCOM/SADC/SARDC: Zambezi Environment Outlook 2015, Harare, Gaborone, 2015.
Zheng, H., Zhang, L., Liu, C., Shao, Q., and Fukushima, Y.: Changes in stream flow regime in headwater catchments of the Yellow River basin since the 1950s, Hydrol. Process., 21, 886–893, https://doi.org/10.1002/hyp.6280, 2007.