the Creative Commons Attribution 4.0 License.
the Creative Commons Attribution 4.0 License.
 | 05 Jun 2018
Study on reservoir time-varying design flood of inflow based on Poisson process with time-dependent parameters
Jing Huang
Jianchang Li
The time-varying design flood can make full use of the measured data, which can provide the reservoir with the basis of both flood control and operation scheduling. This paper adopts peak over threshold method for flood sampling in unit periods and Poisson process with time-dependent parameters model for simulation of reservoirs time-varying design flood. Considering the relationship between the model parameters and hypothesis, this paper presents the over-threshold intensity, the fitting degree of Poisson distribution and the design flood parameters are the time-varying design flood unit period and threshold discriminant basis, deduced Longyangxia reservoir time-varying design flood process at 9 kinds of design frequencies. The time-varying design flood of inflow is closer to the reservoir actual inflow conditions, which can be used to adjust the operating water level in flood season and make plans for resource utilization of flood in the basin.


Design floods are the key basis for reservoir designing and operating. Whether it can fully reflect the law of flood evolution in flood season is of great significance to the flood control and development of reservoirs. During the process of reservoir operation, it is necessary to determine the design floods which closes to the reservoir actual water conditions. The time-varying design flood is a dynamic design flood, which considers the shortage of water resources and followed the law of flood evolution in reservoir operation. The time-varying design flood is close to the actual runoff process of reservoir. Compared with the annual maximum design flood, it can not only dynamic reflect changes of inflow, but also do not require artificial smoothing. The method of deriving the time-varying design flood is a combination of the peak over threshold method (Wang, 1999) and the model of Poisson process with time-dependent parameters (Wang, 2000). In hydrology, the key of limiting the accuracy of design flood calculation is too little data available for the sample (Li et al., 2016). On this basis, this paper adopts the method of peak over threshold for flood sampling and takes fixed days as a calculation period. Compared with the traditional application of peak over threshold method, this way can well expand the capacity of sample data, dynamically reflect the actual flood characteristics of reservoir and improve the accuracy of time-varying design flood. This method is a good way to make up for the lack of research on time-varying design flood at home and abroad.
Optimizing design floods and hydrological forecasting are two most effective ways to optimize flood control scheduling and improve profitability, attracting more and more scholars' attention. This paper improves the method of designing the flood process line from the aspects of sampling method and frequency curve, making it have the characteristic of time-varying and meet the requirements of time-varying design flood.
2.1 Peaks over threshold
In the process of deducing the design flood, the traditional annual maximum method only considers the distribution of extreme values in the measured data. It cannot reflect the actual characteristics of the flood and is not suitable for the period of reservoir operation. The peak over threshold method often takes one year as a calculation period. The traditional way of using the method of peak over threshold not only increased sample size but also enhanced the physical correlation among sample individuals (Eastoe, 2012). In order to meet the assumptions of independence and the series are drawn from the same distribution (Lang et al., 1999), it need to control the over-threshold intensity in ∼ 2–3 times/year (Zhou et al., 2011). Thus, the design flood process can only indicate the general trend of the inflow process. Applying the method of peak over threshold in a calculation period of fixed days can significantly enhance its own advantages.
2.2 Probability model
The flood over-threshold series is a series of the part of all individuals (flood peak, a fixed period floods) which exceed the threshold. It can be expressed as:
Where Y is the over-threshold; X is a random variable in the flood; y0 is the threshold, which is selected based on the design frequency and the calculation period.
2.3 Threshold selection
When performing the over-threshold series frequency analysis, the samples must satisfy the assumptions of independence and the series are drawn from the same distribution. The assumptions can be achieved by choosing a reasonable threshold (y0). At present, the criterion of threshold selection is mainly the American Water Resources Association Standard (Zhou and Huang, 2014). But, it is only suitable for the calculation period of one year. Considering the threshold selection criteria and the model assumptions, this paper proposes a way to solve problems of the threshold selection and the rationality of the model established. The way is to detect whether the intensity of over-threshold occurred at any given time always obeys Poisson distribution at a certain set threshold. Considering the selection of the threshold value is related to the design frequency and the calculation period of flood, this paper proposes a parallel judgment that the design parameters should be combined with two or more flood parameters (the peak flow, the maximum flood volume of fixed period) of reservoirs in comparative analysis.
2.4 Poisson process with time-dependent parameters
Compared to the traditional method of designing flood process, the advantage of the Poisson process with time-dependent parameters model lies in the two time-dependent parameters (over-threshold average bt and over-threshold intensity rt). The dependent parameter is the embodiment of the time-varying characteristics of the model. It makes the model can fully reflect the actual hydrological characteristics of the reservoir, and without the need to smooth.
The total duration of the study is divided into t periods (t=1, 2, …, n). The number of occurrences per unit time K is random. K is assumed to follow the Poisson distribution (Önöz and Bayazit, 2001). The probability of occurrence of k-times over-threshold per unit time can be expressed as:
Where: rt is a parameter, which means the intensity of the over-threshold series occurrences over the period t.
Further, assuming the over-threshold series follows an exponential distribution (Wang, 2000), the frequency curves can be expressed as:
Where: bt is a parameter, which means the average number of the over-threshold series over the period t; y is the value of over-threshold. Because of the over-threshold intensity conforms to the Poisson distribution, its recurrence period E(T) can be expressed as:
Based on the above calculation steps, the formula of time-varying design flood can be directly given here:
Each symbol has the same meaning as above.
3.1 Introduction of Longyangxia reservoir
Longyangxia, a large reservoir with multi-year regulation capacity in the upper reaches of the Yellow River, is characterized by a good correlation relationship between flood peak and flood volume (Li et al., 2007). The flood season of Longyangxia reservoir is from July to September. Most of the flood peak appeared in July or September, and August was relatively low. Usually, the peak of flood appears in July is sharp and skinny. On the contrary, the peak of flood appears in September is short and fat. The duration of each flood is about 40–50 days (China Hydropower Consulting Group, Northwest Institute of survey and design, 2005). Combining the peak over threshold method, which applied in a calculation period of fixed days, with the Poisson process with time-dependent parameters model, this paper will show everyone the process of deducing the time-varying design floods of Longyangxia reservoir.
3.2 Threshold selecting
According to the flood control tasks of the Longyangxia reservoir, this paper selects 9 kinds of design frequencies peak flows and flood volume of 3 days (this paper only takes flood volume of 3-day as an example to explain the time-varying design flood volume estimation method) by using peak over threshold method for the runoff data of 1956–1997 (42 years) from 15 June to 15 October. In order to judge the reasonableness of each threshold, the K-S test was used to test the fitting degree of over-threshold intensity with Poisson distribution. However, there are still a lot of threshold values after screening by K-S tests. This paper further proposes a screening method based on the comparative analysis of the peak flow, the maximum flood volume of 15 days and the maximum flood volume of 45 days of each design frequency for Longyangxia reservoir. The final results are shown in Table 1.
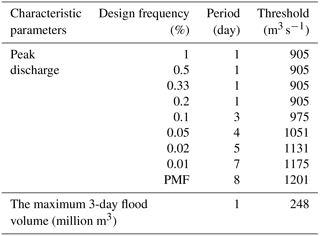
As the design frequency decreases, the length of the calculation period and the threshold gradually increase (Table 1). The fitting degree between the intensity of over-threshold and the Poisson distribution determines the threshold value and the length of calculation period at a certain design frequency. The larger the design frequency, the smaller the calculation period, which is in line with the laws of nature. When the design frequency is large, the model can provide detailed daily changes of flood characteristics to users. On the contrary, when the design frequency is small, the model can provide users with a reasonable flood trend line. However, for the calculation of the flood volume of fixed period, setting one day as a calculation period can help the user visually judge the information of flood. In this way, the model can not only ensure the rationality of the result but also improve the design flood accuracy.
3.3 The time-varying design flood of Longyangxia reservoir
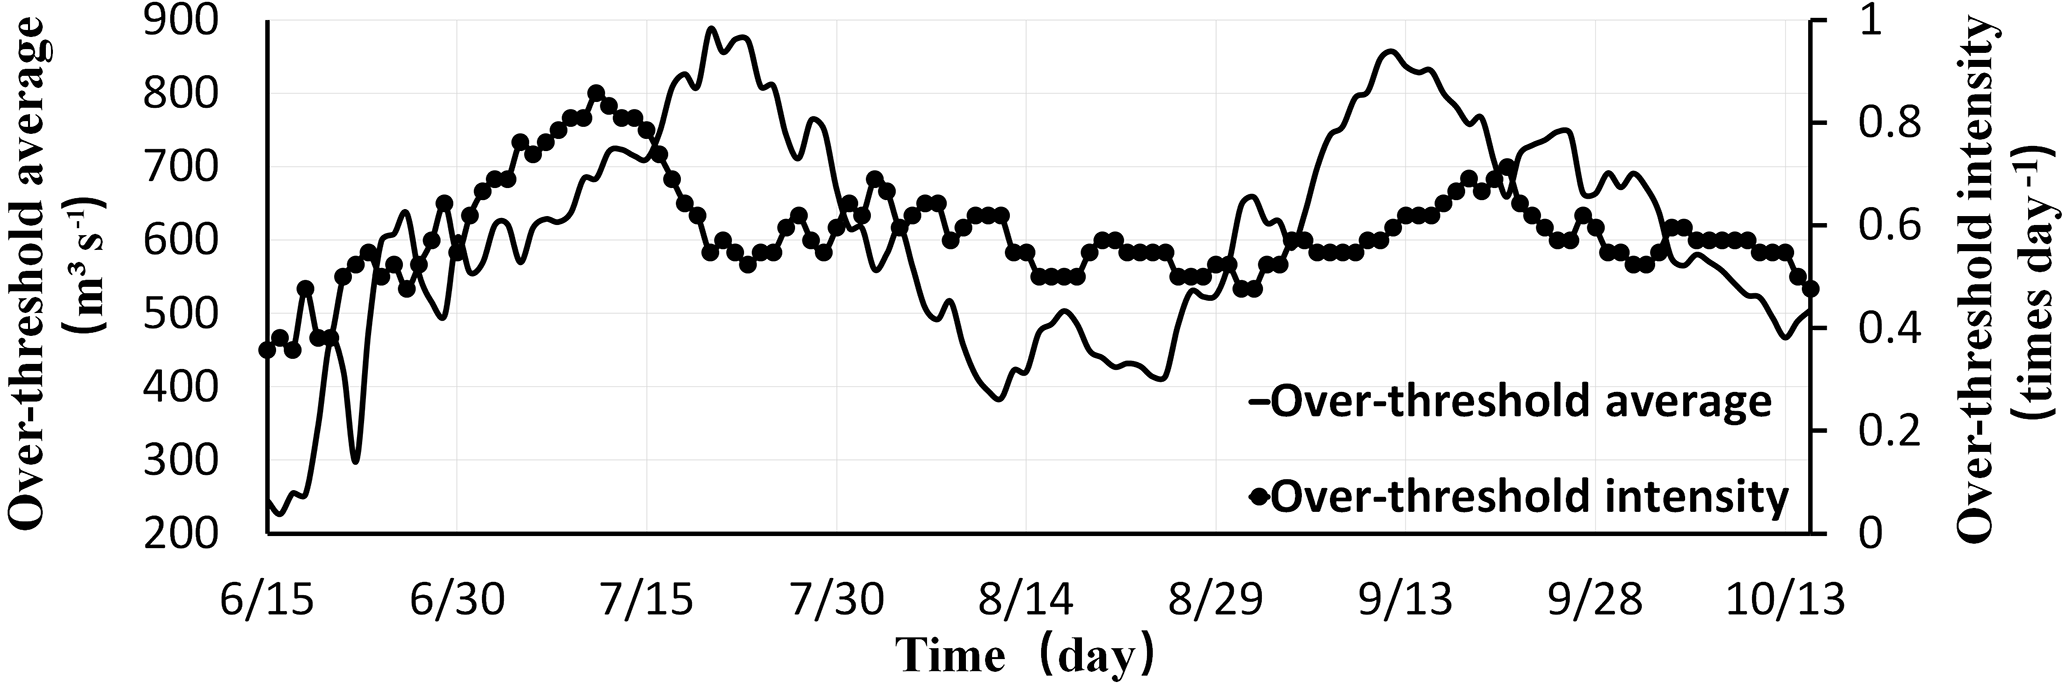
Take the 100 year time-varying design flood estimation process as an example, the data can be divided into 123 periods (t=1, 2, 3, …, 123) by the calculation period of 1 day. According to the peak flow data, this paper sets the threshold as 905 m3 s−1, and uses programming to filter out 3035 over-thresholds. The process of time-dependent parameters (over-threshold average bt and over-threshold intensity rt) changes with time, as shown in Fig. 1.
Two time-vary parameters are stochastic (Fig. 1). The peak appears in July is sharp and skinny. On the contrary, the peak appears in September is short and fat (shown by over-threshold average bt). The trend of time-dependent parameters are in line with the characteristics of flood in the Yellow River basin. So, the time-varying parameters can characterize the actual flood characteristics of Longyangxia reservoir. After data test proved that the 9 kinds of design frequencies of time-dependent parameters are all able to reflect the actual characteristics of the flood. This conclusion is not repeated here.
The average duration of each flood is 45 days. The 9 kinds of design frequencies time-varying flood of Longyangxia reservoir shown in Fig. 2.
Considering the information given in Table 1 and Fig. 2, as the design frequency decreases from 1 % to PMF, the calculation period of time-varying design floods increases from 1 day to 8 days. The threshold has been increased from 905 to 1201 m3 s−1. Maybe someone will have questions. When the design frequency is small, the model does not give a detailed flood change process line. Will this affect the accuracy of flood control calculation? After simulating the reservoir flood control test, the result given by the model will not affect the flood control process. Compared with the traditional annual maximum design flood, the flood peak of time-varying design flood appears in the second half. This is a huge challenge for reservoir flood control. However, when using time-varying design flood as the basis for reservoir operation planning, it can not only ensure dam safety but also increase reservoir efficiency.
The 9 kinds of time-varying design frequencies flood volume of the 3 day line of Longyangxia, shown in Fig. 3.
The time-varying design flood volume of the 3 days is in accordance with the actual hydrological characteristics of the Yellow River Basin (Fig. 3). When the date and the fixed period is known, the fixed period of time-varying design flood volume process can be directly used to judge the magnitude of flood. For example, on 1 July, when the 3 day flood volume of the reservoir is between 974 and 1079 million m3, the flood can be regarded as reached the 1000 year design flood standards. So, the schedule of reservoir flood control can be prepared according the 1000 year design flood. In order to improve the accuracy, users can combine the time-varying design flood curve of peak flow with the time-varying design flood curve of flood volume in fixed periods, to make a comprehensive judgment of the magnitude of inflow.
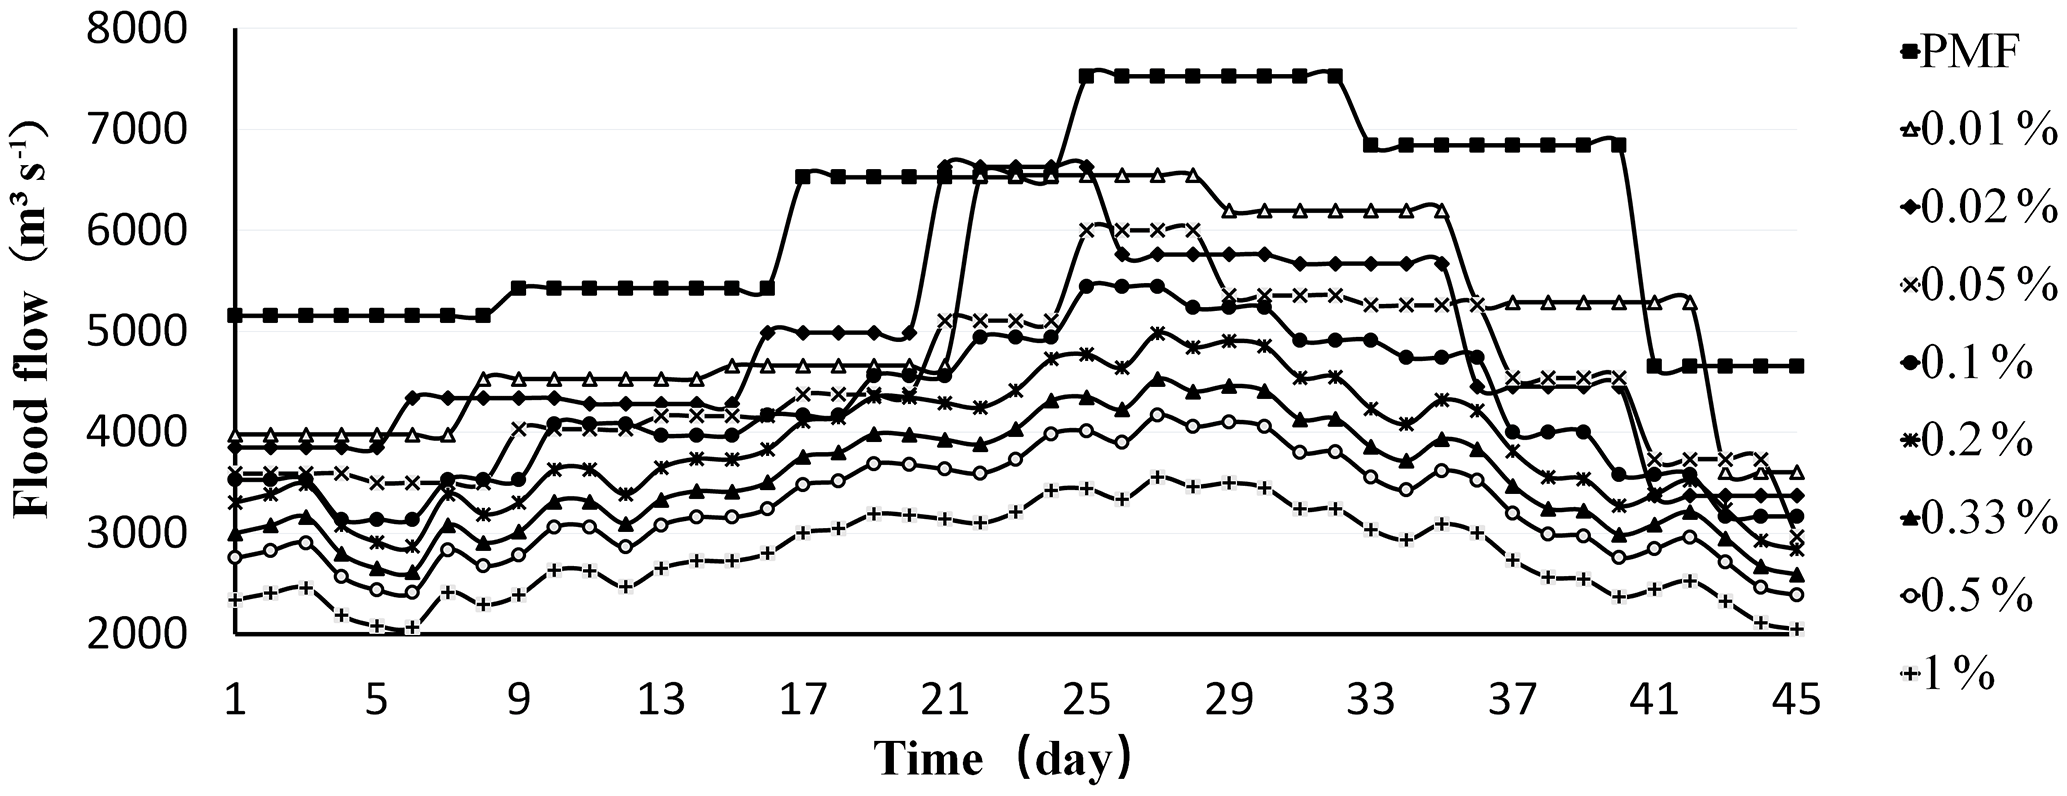
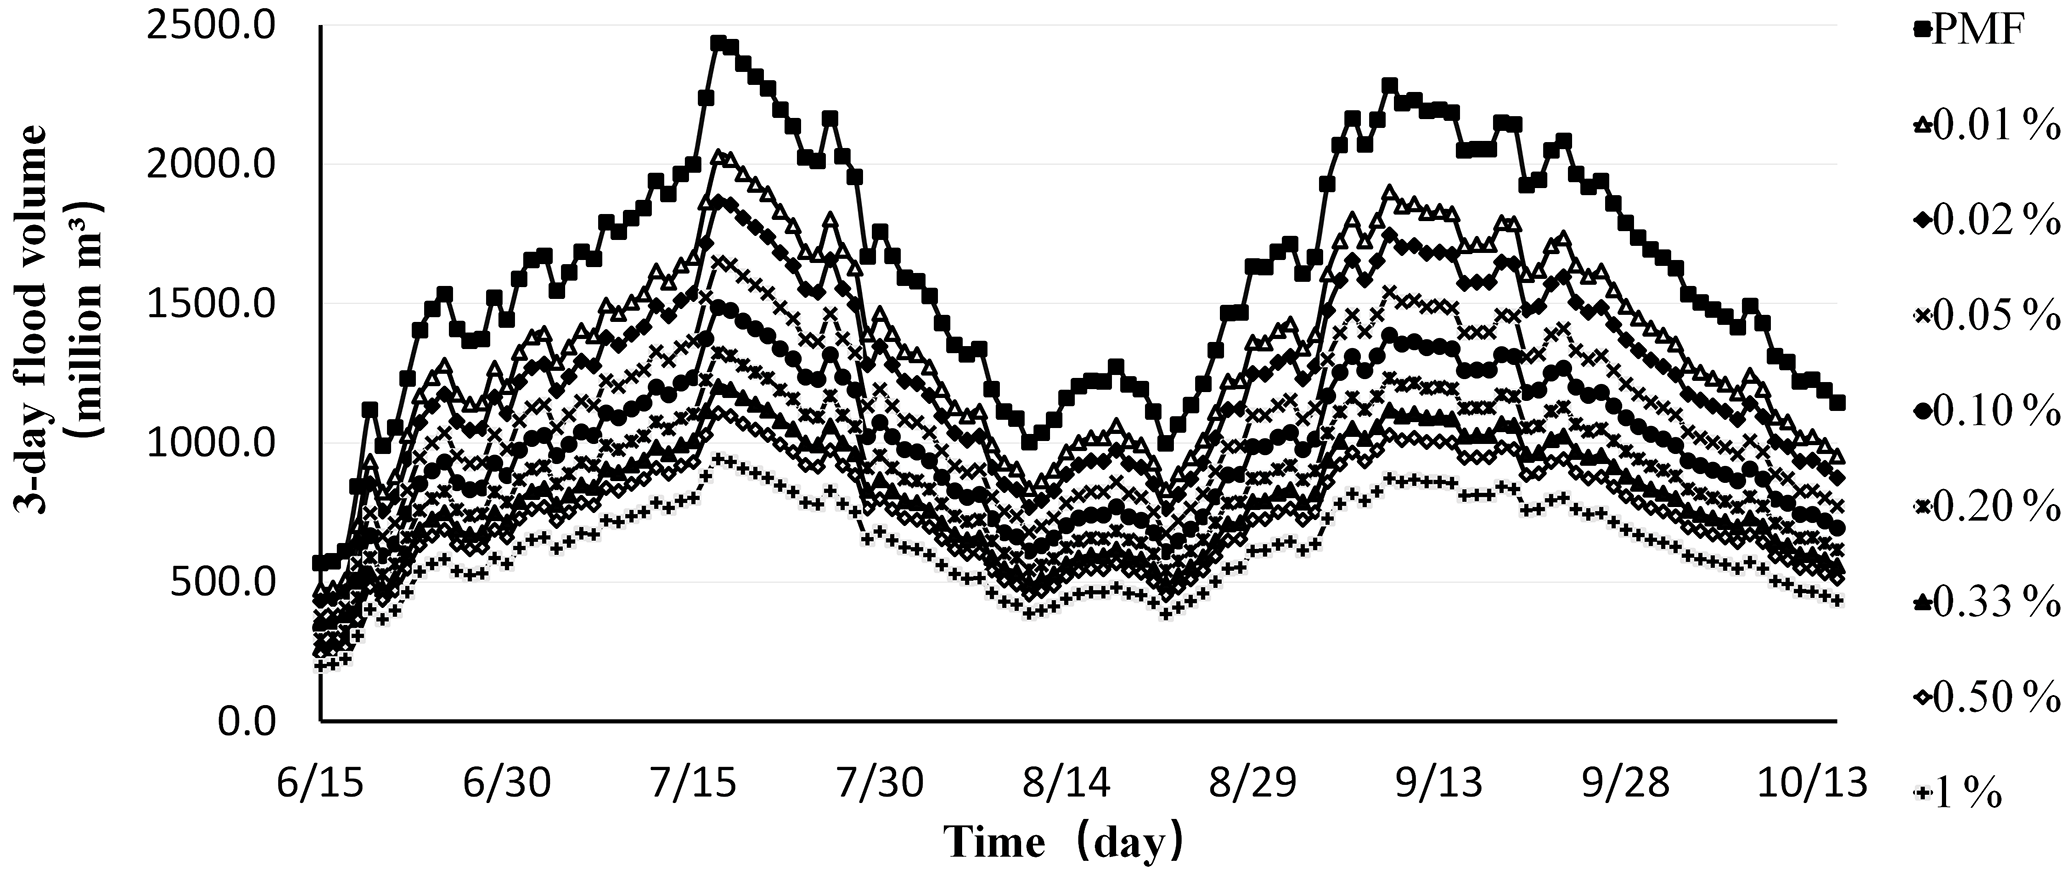
Figure 3The change process of 3 day time-varying design flood volume at 9 kinds of design frequencies.
This paper sets fixed days as the calculation period of the peak over threshold method, which greatly enhances its own advantages. Such as, this way makes full use of the measured data, greatly increases the sample size, and provides a basis for describing the flood features of the river basin. For the new application way of the peak over threshold method, this paper puts forward the principle of threshold selection. Compared with the traditional design flood, the time-varying design flood of inflow has the advantage of deduced flood process closer to the actual situation, and does not require manual smoothing.
Under the background of the global water resources shortage, it is more reasonable to design the reservoir operation plan based on the time-varying design flood. Because it can fully reflect the reservoir flood situation. In addition, the time-varying design flood can also be used for the research on the utilization of flood resources, such as the hydrological forecast, the adjustment of reservoir operation levels in flood season and so on.
The data are not publicly accessible because they related to the reservoir distribution of benefits and other issues.
The authors declare that they have no conflict of interest.
This article is part of the special issue “Innovative water resources management – understanding and balancing interactions between humankind and nature”. It is a result of the 8th International Water Resources Management Conference of ICWRS, Beijing, China, 13–15 June 2018.
This study was financially supported by National Key Projects of China
“Water resources efficient development and utilization” (2017YFC0405900,
2016YFC0402208, 2016YFC0401903) and National Natural Science Foundation of
China (No. 51641901). The author would like to give special thanks to
anonymous reviewers.
Edited by: Dingzhi Peng
Reviewed by: two anonymous referees
China Hydropower Consulting Group, Northwest Institute of survey and design: Study on the Recent Dispatch and Utilization of Longyangxia-Liujiaxia Reservoir, R, 2005.
Eastoe, E. F.: Modelling the distribution of the cluster maxima of exceedances of subasymptotic thresholds, J. Biometrika, 99, 43–55, https://doi.org/10.1093/biomet/asr078, 2012.
Lang, M., Ouarda, T. B. M. J., and Bobée, B.: Towards operational guidelines for over-threshold modelling, J. Hydrol., 255, 103–117, https://doi.org/10.1016/S0022-1694(99)00167-5, 1999.
Li, D., Guo, S. L., and Yin, J. B.: PDS/GP model with variable parameters and its application for flood frequency analysis, J. Hydraul. Eng., 47, 1269–1276, https://doi.org/10.13243/j.cnki.slxb.20151322, 2016.
Li, J. Q., Yao, Z. Z., Jia, H. S., and Ji, C. M.: Feasibility argumentation on the dynamical flood control limited water level of Liujiaxia reservoir in flood season, J. Hydraul. Eng., 5, 1–6, https://doi.org/10.3969/j.issn.1003-1243.2007.05.001, 2007.
Önöz, B. and Bayazit, M.: Effect of the occurrence process of the peaks over threshold on the flood estimates, J. Hydrol., 244, 86–96, https://doi.org/10.1016/S0022-1694(01)00330-4, 2001.
Wang, S. X.: Flood frequency analysis of PDS, Yangtze River, 30, 23–15, https://doi.org/10.16232/j.cnki.1001-4179.1999.08.010, 1999.
Wang, S. X.: Poisson process with time-dependent parameters model, J. Hydropower and New Energy, 39, 18–21, https://doi.org/10.13622/j.cnki.cn42-1800/tv.2000.04.006, 2000.
Zhou, C. and Huang, Y. J.: Comparison of Annual Maximum Sampling Method and Peaks over Threshold Method in Design Flood Analysis, J. Water Resources Power, 32, 172–175, 2014.
Zhou, C., Chen, Y. F., and Wei, L.: Application of fitting curve method to frequency analysis of POT floods series, J. Water Resources and Power, 29, 48–50, https://doi.org/10.3969/j.issn.1000-7709.2011.03.014, 2011.