the Creative Commons Attribution 4.0 License.
the Creative Commons Attribution 4.0 License.
 | 05 Jun 2018
Hydrological regionalisation based on available hydrological information for runoff prediction at catchment scale
Qiaoling Li
Zhijia Li
Yuelong Zhu
Yuanqian Deng
Ke Zhang
Cheng Yao
Regionalisation provides a way of transferring hydrological information from gauged to ungauged catchments. The past few decades has seen several kinds of regionalisation approaches for catchment classification and runoff predictions. The underlying assumption is that catchments having similar catchment properties are hydrological similar. This requires the appropriate selection of catchment properties, particularly the inclusion of observed hydrological information, to explain the similarity of hydrological behaviour. We selected observable catchments properties and flow duration curves to reflect the hydrological behaviour, and to regionalize rainfall-runoff response for runoff prediction. As a case study, we investigated 15 catchments located in the Yangtze and Yellow River under multiple hydro-climatic conditions. A clustering scheme was developed to separate the catchments into 4 homogeneous regions by employing catchment properties including hydro-climatic attributes, topographic attributes and land cover etc. We utilized daily flow duration curves as the indicator of hydrological response and interpreted hydrological similarity by root mean square errors. The combined analysis of similarity in catchment properties and hydrological response suggested that catchments in the same homogenous region were hydrological similar. A further validation was conducted by establishing a rainfall-runoff coaxial correlation diagram for each catchment. A common coaxial correlation diagram was generated for each homogenous region. The performances of most coaxial correlation diagrams met the national standard. The coaxial correlation diagram can be transferred within the homogeneous region for runoff prediction in ungauged catchments at an hourly time scale.


Flash floods are one of the most destructive hazards in the world, particularly in China. According to the statistics of the National Development and Reform Commission, China has 670 large rivers with the catchment areas over 3000 km2, more than 8600 small and medium rivers with the catchment areas ranging between 200 and 3000 km2, and much more mountainous gullies with the areas under 200 km2. There has been no or few available streamflow data (ungauged) to derive reasonable rainfall runoff relationships for the small and medium rivers, despite the national initiative for hydrological monitoring system for small and medium rivers in China from 2011. The question is how to build an appropriate rainfall runoff relationship for accurate and timely runoff prediction at the ungauged catchments? Many hydrologists focus on the concept and method of regionalisation transferring of hydrological information/response from gauged to ungauged environments.
In the literature, numerous regionalisation approaches have been proposed for runoff predictions from a catchment scale to global scale and from a short-term flood event to long-term series (Li and Zhang, 2017). The most popular regionalisation approaches are generally based on (1) spatial proximity, (2) regression, (3) physical and climatic similarity, (4) hydrological signatures/indices, (5) integrated similarity such as the combination of spatial proximity and physical similarity.
Hydrologists have tried to compare the performances of different approaches in ungauged catchments but results are not in agreement. Young (2006) compares two regionalisation approaches in 260 catchments in UK and finds that the regression-based approach is more accurate than the spatial proximity-based approach. Oudin et al. (2008) test three approaches in 913 catchments in Frances and conclude that the spatial proximity-based approach performs the best, and the regression-based approach perform the worst with the physical similarity approach in the middle. Zhang and Francis (2009) analyse several approaches in 210 catchments in Australia and show that the spatial proximity-based approach is slightly better than the physical similarity approach. Bao et al. (2012) investigate different regionalisation approaches for 55 catchments in China and find that the similarity based approaches are more accurate than the regression based approach, and become much more accurate from humid to arid regions. Parajka et al. (2013) conducts an integrated analysis on 34 studies including 3874 catchments and conclude that the performances of different approaches largely depend on the selected rainfall runoff models and research sites. The similarity-based approaches outperform other approaches in many catchments.
The main difficulty for the similarity approaches is to identify a suitable metric of similarity for the target catchments. Several recent studies have implemented data mining and machine learning techniques to identify similarity metrics for catchments in different climates. Further improvement is still necessary to increase regionalisation performance in catchment of the dryer regions. Only few regionalisation studies have been published with Chinese data and much less for prediction at short time scale for ungauged Chinese catchments (Ragettli et al., 2017). This could be attributed to strict Chinese data sharing policies that limit data availability.
The aim of this study is to regionalize rainfall-runoff response for short term runoff prediction in small and medium catchments of China. For this purpose, we performed a principal component analysis for each category of catchments properties and developed a clustering scheme to classify catchments. Daily flow duration curves were employed as an index of hydrological response. The integrated catchment properties and daily flow duration curves were investigated to assess hydrological similar catchment and determine the homogenous regions. We further evaluated the transferability of coaxial correlation diagrams within the homogenous region.
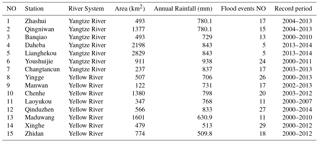
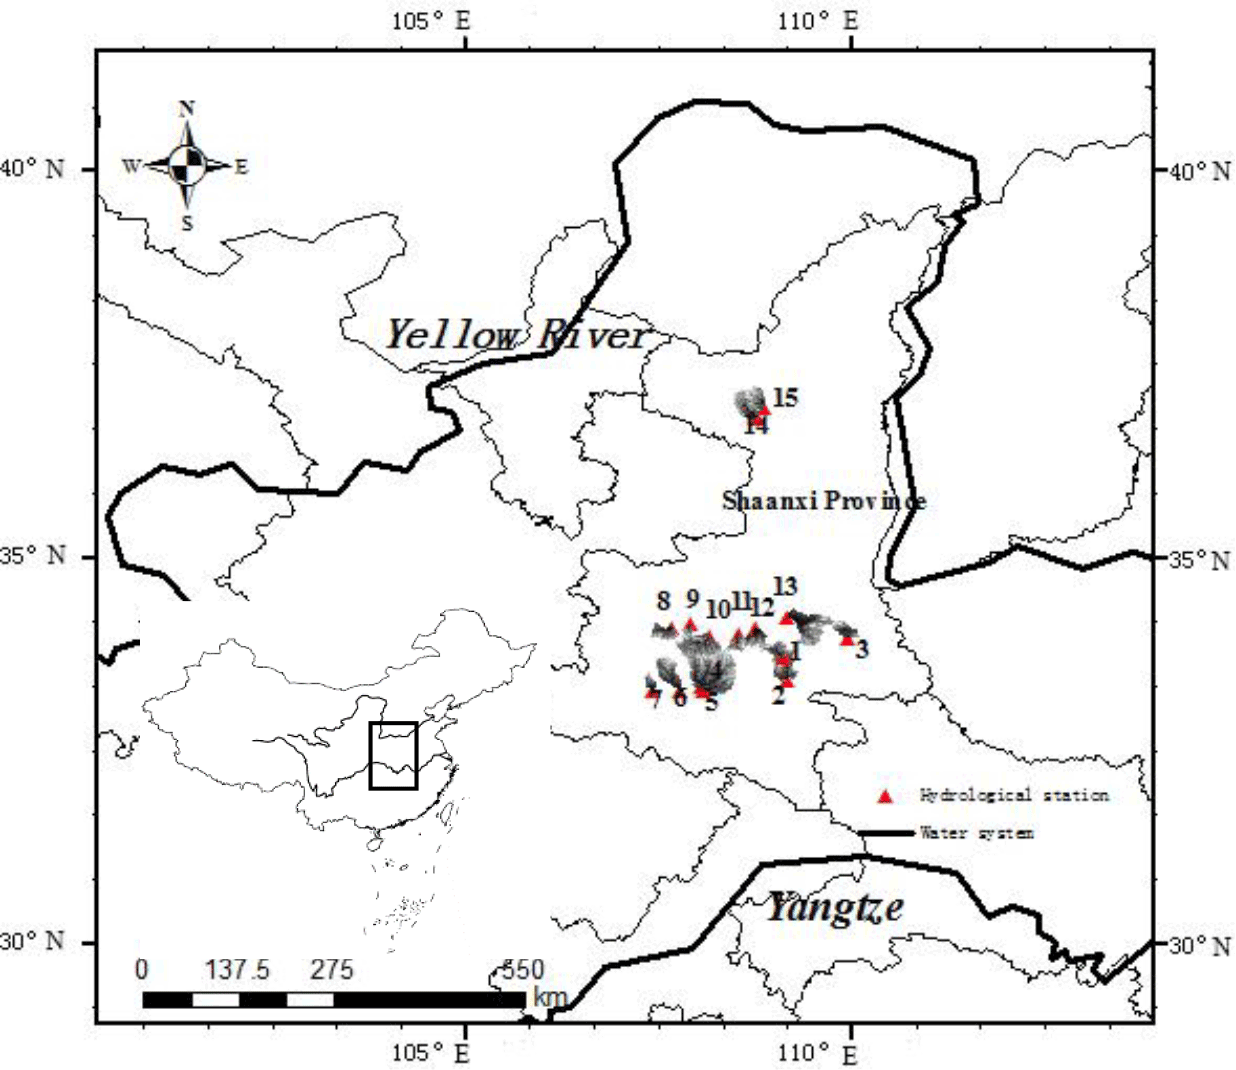
Fifteen gauged catchments located in Shanxi Province were identified as the study area (Fig. 1) based on three criteria (1) data availability of daily/hourly rainfall and runoff (2) the catchments were unimpaired and unregulated (3) the catchments provide a range of catchment types and climatology. The catchments are classified by the Qin Mountain into “South” and “North” with climate changing from humid to semi-humid and semi-arid zones. The catchment areas range from 122 to 2829 km2. Each catchment has 10–15 years of available daily continuous rainfall and runoff data with 11–29 flood events except Daheba and Lianghekou. Table 1 lists the period of record and the number of flood events used for the generation of flow duration curves and coaxial correlation diagrams for each catchment. These hydro-meteorological data were obtained under the collaboration with the Hydrology and Water Resources Bureau of Shanxi Province. Except for the hydro-meteorological data, the regionalisation methods require catchment attributes such as topography attributes extracted from a digital elevation model (http://www.csdb.cn/), fraction of land cover and land use derived from the Global Land Cover Database and Soil Map of China (Wu et al., 2003), to reflect the characteristics of rainfall runoff responses.
3.1 Study design
The hydrological regionalisation study is conducted by two ways (Fig. 2). One is the similarity analysis based on flow duration curves using root mean square errors:
Where n is the total number of percent exceedance, Qxi and Qyi are the discharges of any two catchments at the ith percent exceedance. The RMSE measures the difference between the discharges of each two catchments at the same percent exceedance.
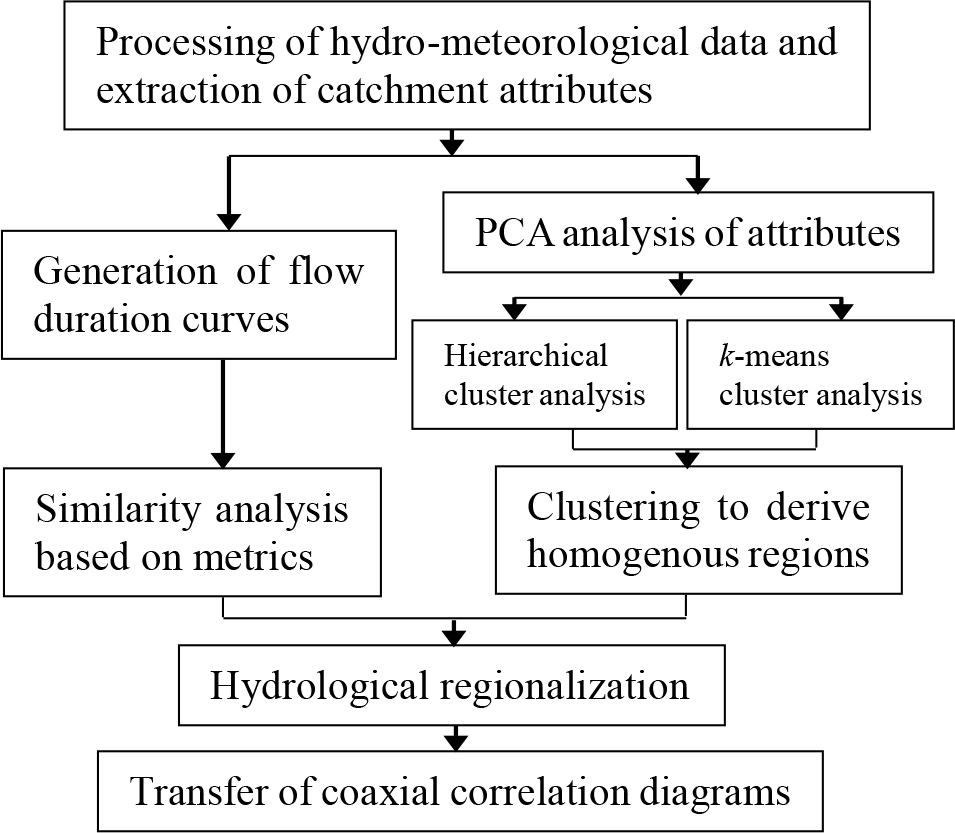
The other is clustering analysis to derive homogenous regions. Firstly we performed a principal component analysis (PCA, Legendre and Legendre, 1998) for catchment characteristics including topography, land cover and land use, soil, and catchment structure such as area and channel length, to select uncorrelated metrics representing the catchment responses. Then k-means clustering analysis and hierarchical clustering analysis were selected to group the catchments into a number of classes (homogenous regions). Hydrological regionalisation was based on the results of both flow duration curves and homogenous regions. Finally the coaxial correlation diagram was generated for each catchment and transfer was performed within the homogenous regions.
3.2 Clustering analysis
In this study, clustering was defined as the grouping of similar catchments. Cluster analysis methods are broadly classified into hierarchical and partitional clustering methods.
Hierarchical clustering analysis grouped PCA results (in a transformed space of catchment attributes) step by step to build clusters. Inter-class distances were calculated using between-groups linkage, within-groups linkage, nearest neighbour, furthest neighbour, centroid clustering, median clustering, and ward's method based on a Euclidean distance measure respectively. Cluster analyses were carried out using these linkage methods for 4–7 clusters.
k-means clustering is one of the most used partitional cluster analysis methods (Parracho et al., 2016). The method was applied to the PCA results in SPSS and the number of clusters k=5 was subjectively determined based on the number and geographical location of catchments and the PCA results. 5 random cluster centers were initialized and each attribute in the domain was assigned to the nearest center. Then the optimum centers were recalculated and the assignment of each attribute was repeated until the clustering did not change.
3.3 Coaxial correlation diagrams
A coaxial correlation diagram, commonly used tools for runoff prediction, particularly in China, integrates the main factors affecting rainfall-runoff response (Li et al., 2015). To make a coaxial correlation diagram, we need as many flood events as possible with areal average rainfall and the consequent runoff, as well as antecedent rainfall. The coaxial correlation diagram was established for each catchment using observed daily and hourly rainfall, and hourly runoff data. The performances of the coaxial correlation diagrams were evaluated using a Qualified Rate which is computed by the Runoff Absolute Error and Allowed Error (Sun et al., 2008). The coaxial correlation diagrams were also established for homogenous zones and evaluation was conducted for each catchment.
4.1 The Similarity based on flow duration curves
Fifteen flow duration curves were constructed from daily runoff data of the entire record period listed in Table 1. Figure 3 shows the flow duration curve for each catchment. Daily discharges changed slightly at the south catchments and greatly at the north catchments, particularly during the high flow period (with the percent exceedance between 0 and 10 %) and low flow period (with the percent exceedance between 90 and 100 %).
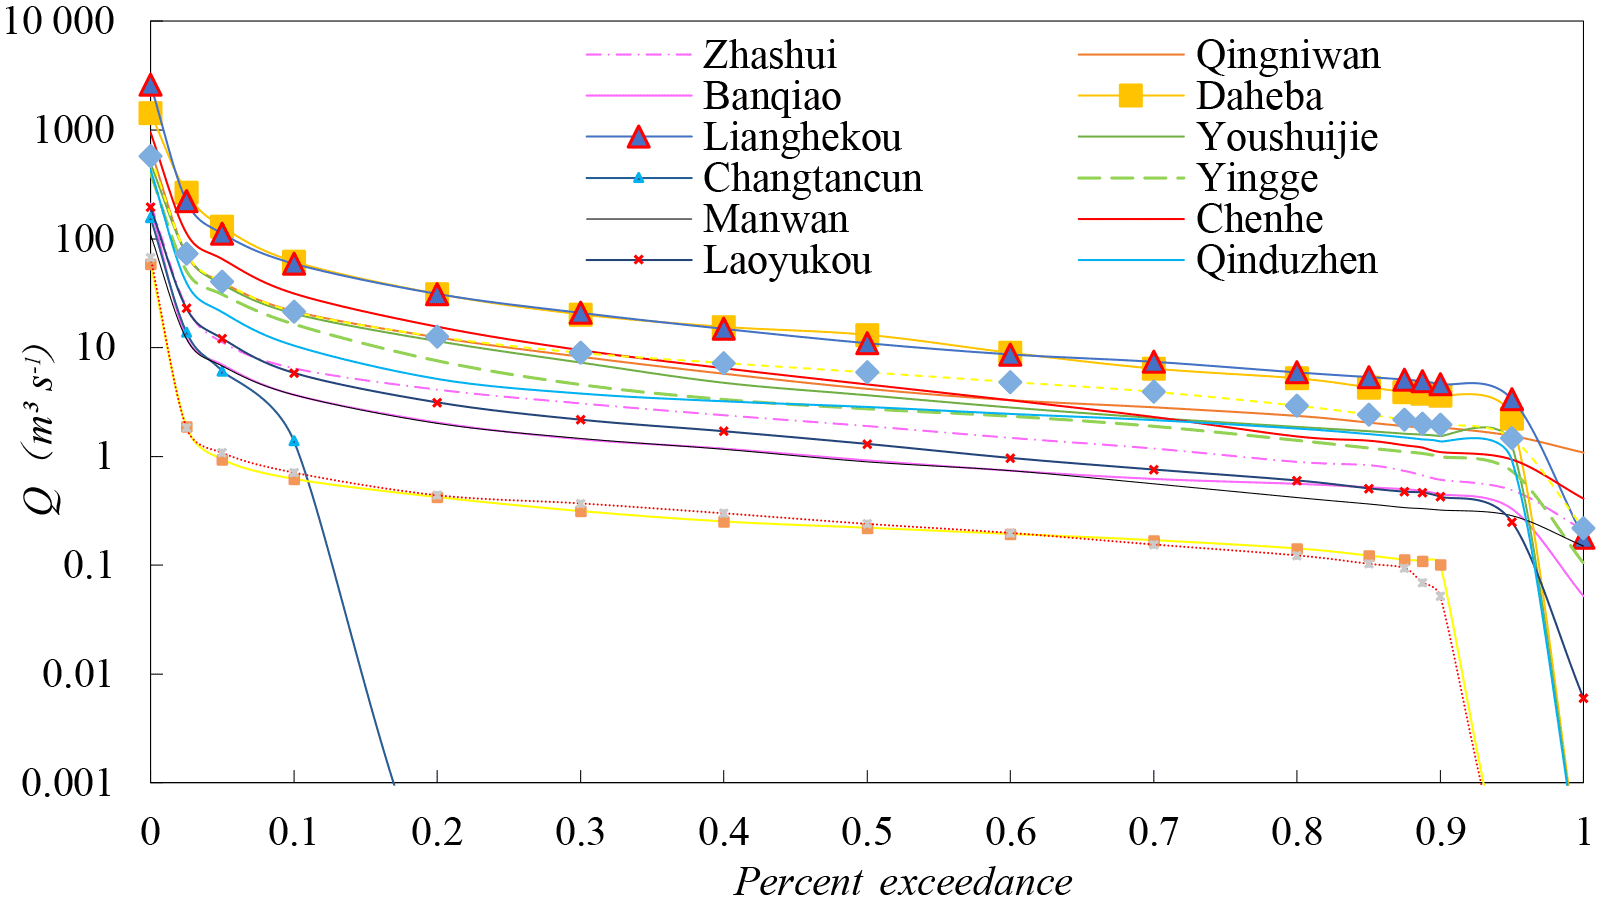
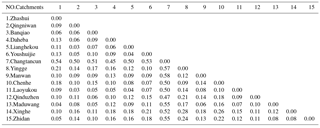
Table 2 summarises the root mean square errors between each pair of catchments. The smaller the value was, the more similar the two catchments were. Most of the values were smaller than 0.1 indicating that similarities lies in the corresponding catchments. The catchments of Qingniwan, Banqiao, Lianghekou, and Laoyukou had smaller root mean square errors with other catchments. The catchments of Yingge, Manwan, Qinduzhen, Xinghe, Zhidan, and particularly Changtancun showed larger root mean square error with other catchments.
4.2 Homogeneous regions based on cluster analyses
The fifteen catchments were classified into different groups depend on the number of clusters. 4, 5, 6, and 7 clusters were selected with seven linkage methods. Figure 4 showed the results of hierarchical clustering analyses combining ward's method and Euclidean distance using 4 clusters. The figure illustrates that the fifteen catchments were grouped into four regions: (1) Daheba, Lianghekou, Youshuijie, Changtancun, Zhashui, and Qingniwan; (2) Zhidan and Xinghe; (3) Chenhe, Laoyukou, Qinduzhen, and Manwan; (4) Banqiao, Maduwang, and Yingge. The results produced from other linkage methods and other number of clusters were different from this method and they were not shown in this paper.
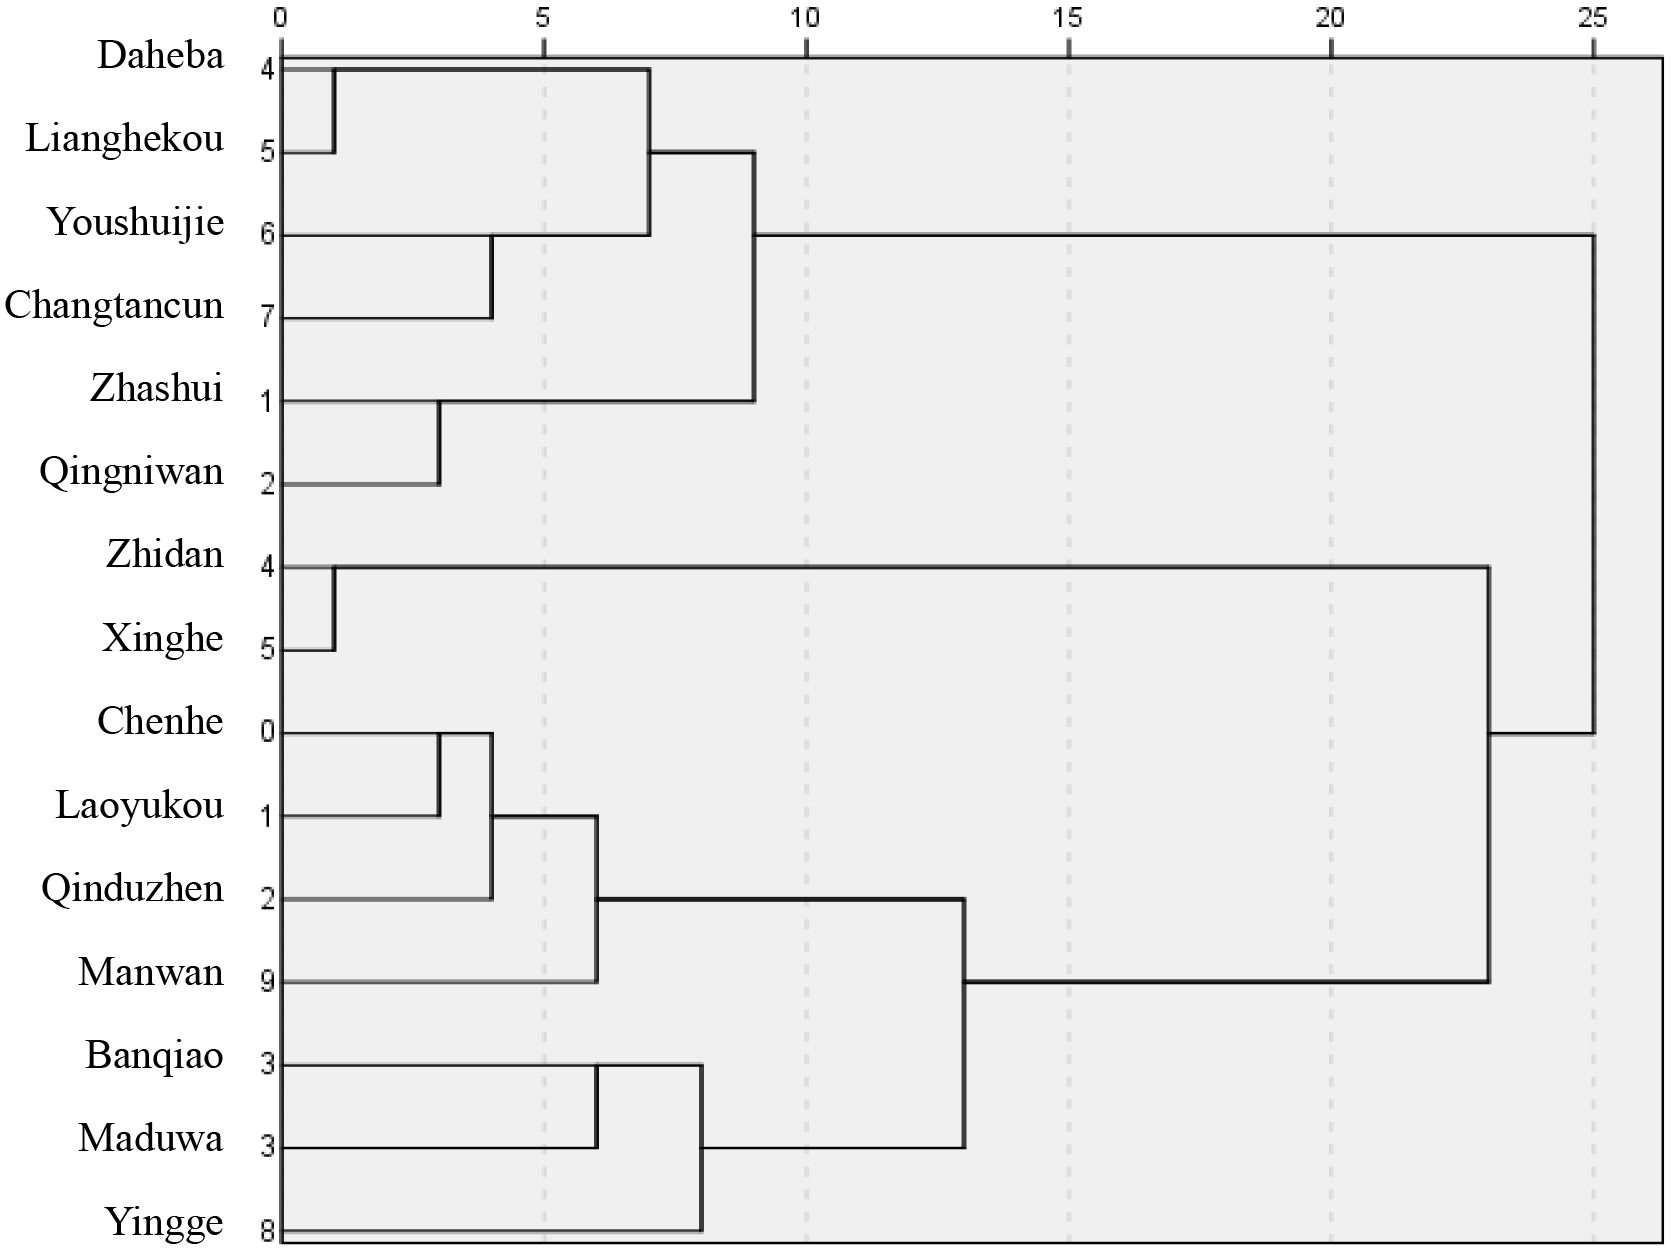
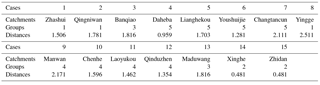
Table 3 presents the grouping results using the k-means clustering with the number of clusters k=5. The distances between the cases and the centers of their affiliated groups were shown in the fourth column.
4.3 Integrated hydrological regionalisation
An integrated analysis was conducted employing flow duration curves, the hierarchical clustering method with seven linkage methods, and k-means clustering method. It was found that the fifteen catchments could be classified into four homogeneous regions: (1) Daheba, Lianghekou, Youshuijie, Changtancun, Zhashui, and Qingniwan belong to the I zone; (2) Chenhe, Laoyukou, Qinduzhen, Manwan, and Yingge belong to the II zone; (3) Banqiao and Maduwang belong to the III zone; (4) Zhidan and Xinghe belong to the IV zone.
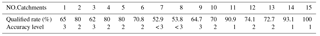
For a further evaluation, the coaxial correlation diagram was generated for each catchment based on visual judgment and computer aids design according to the distribution of flood events plots (Fig. 5). The performances of each coaxial correlation diagram were presented in Table 4. The results suggest that the performances of most coaxial correlation diagram met the national standard with the Qualified Rates no less than 60 % (Sun et al., 2008) except for Changtancun and Yingge, as the characteristics of flood events within these two catchments differed greatly from each other.

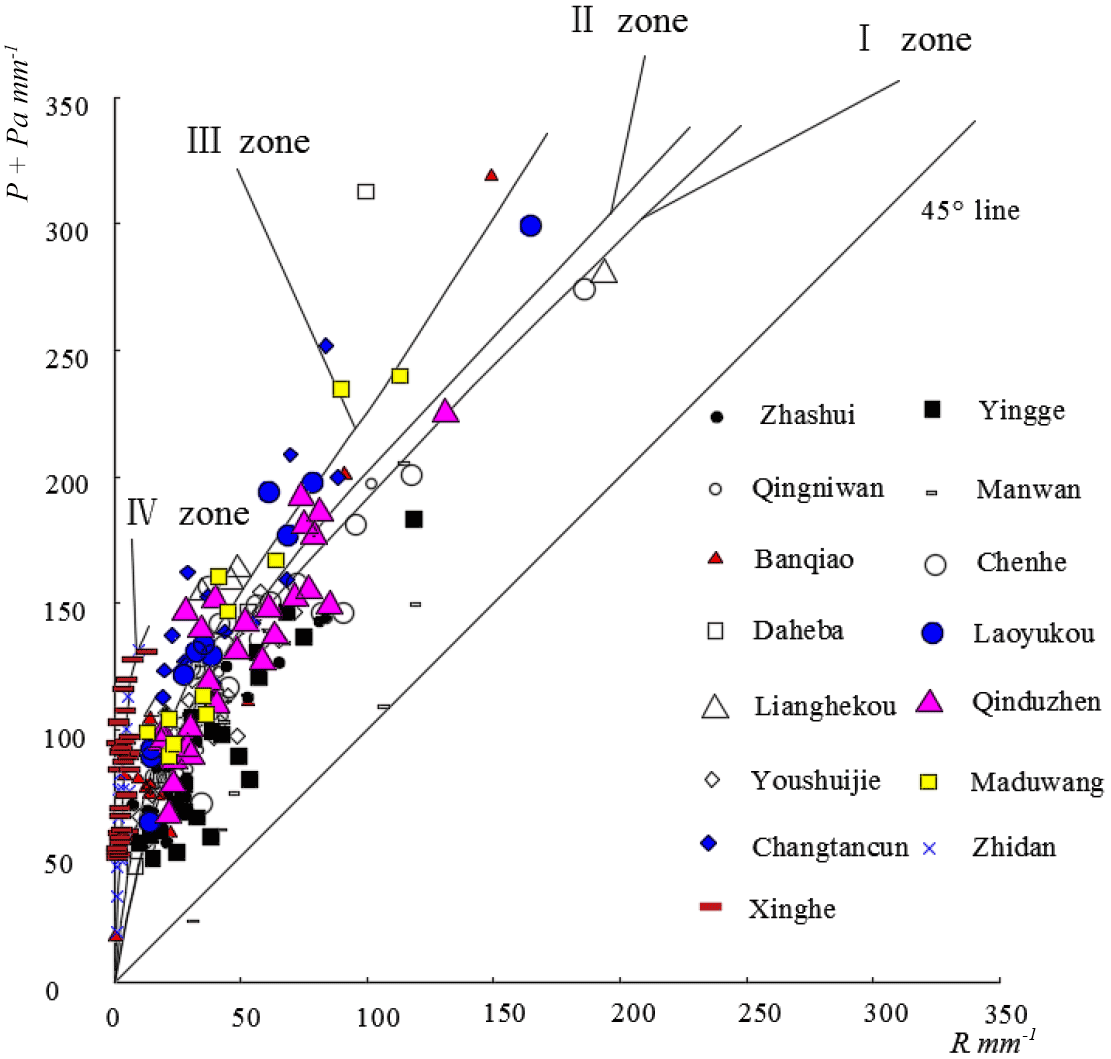
Four coaxial correlation diagrams were generated for the corresponding homogeneous zones (Fig. 6). The coaxial correlation diagrams of zone I and zone II were closer to the 45∘ line, indicating that catchments had a larger antecedent soil moisture. They were generally located in semi-humid and humid regions. In contrast to this, the coaxial correlation diagrams of zone I and zone II were farther suggesting that the antecedent soil was drier in these regions. The performance of the common correlation diagram in a homogenous zone was a bit worse than the performance of the independent diagram for each catchment.
This paper explored hydrological regionalisation using flow duration curves and clustering analysis methods in order to provide a possible way of runoff prediction in ungauged catchments. The flow duration curves could give steady-state pictures of the entire hydrological regimes and represented similarities among them. It is worth noting that flow duration curves cannot keep steady-state under climate change and human activities. The root mean square errors of the fifteen flow duration curves between catchments suggested the similarities among them. The regionalisation was then performed employing hierarchical clustering methods with seven linkage method and k-means clustering method. The clustering results differed as the linkage methods and clusters varied for hierarchical clustering analyses. The number k=5 was adopted for k-means clustering method and it is suggested that analyses with other numbers of clusters be carried out.
The fifteen catchments were grouped into four homogenous regions based on an integrated analysis. The coaxial correlation diagram was generated for each catchments and each homogenous zone with the performance of the latter a bit worse. It is argued that the common coaxial correlation diagram for the homogenous zone could be transferred within the catchments of the zone for runoff prediction. Further study is needed to combine several coaxial correlation diagrams according to the characteristics of flood events. In summary, this study presents a way of hydrological regionalisation using available hydrological information which could be useful for runoff prediction in ungauged catchments.
The hydrological data used in this study was obtained under the collaboration with Hydrological Bureau of Shanxi Province of China, since we have a joint project (National Key R&D Program of China, 2016YFC0402705). The data cannot open to the public at the present time.
The authors declare that they have no conflict of interest.
This article is part of the special issue “Innovative water resources management – understanding and balancing interactions between humankind and nature”. It is a result of the 8th International Water Resources Management Conference of ICWRS, Beijing, China, 13–15 June 2018.
This work was supported by the Fundamental Research Funds for the Central
Universities (2018B11014), the National Key R&D Program of China
(2016YFC0402705), and Natural Science Foundation of China (41201028,
51679061, 41130639).
Edited by: Dingzhi
Peng
Reviewed by: two anonymous referees
Bao, Z., Zhang, J., Liu, J., Fu, G., Wang, G., He, R., Yan, X., Jin, J., and Liu, H.: Comparison of regionalization approaches based on regression and similarity for predictions in ungauged catchments under multiple hydro-climatic conditions, J. Hydrol., 466–467, 37–46, https://doi.org/10.1016/j.jhydrol.2012.07.048, 2012.
Legendre, P. and Legendre, L.: Numerical Ecology, Elsevier, Amsterdam, 1998.
Li, H. and Zhang, Y.: Regionalising rainfall-runoff modelling for predicting daily runoff: Comparing gridded spatial proximity and gridded integrated similarity approaches against their lumped counterparts, J. Hydrol., 550, 279–293, https://doi.org/10.1016/j.jhydrol.2017.05.015, 2017.
Li, Q., Li, Z., Chen, L., and Yao, C.: Regionalization of coaxial correlation diagrams for the semi-humid and semi-arid catchments in Northern China, Proc. IAHS, 368, 317–322, https://doi.org/10.5194/piahs-368-317-2015, 2015.
Oudin, L., Andreassian, V., Perrin, C., Michel, C., and Le Moine, N.: Spatial proximity, physical similarity, regression and ungaged catchments: a comparison of regionalization approaches based on 913 French catchments, Water Resour. Res., 44, W03413, https://doi.org/10.1029/2007WR006240, 2008.
Parajka, J., Viglione, A., Rogger, M., Salinas, J. L., Sivapalan, M., and Blöschl, G.: Comparative assessment of predictions in ungauged basins – Part 1: Runoff-hydrograph studies, Hydrol. Earth Syst. Sci., 17, 1783–1795, https://doi.org/10.5194/hess-17-1783-2013, 2013.
Parracho, A. C., Melo-Goncalves, P., and Rocha, A.: Regionalisation of precipitation for the Iberian Peninsula and climate change, Phys. Chem. Earth, 94, 146–154, https://doi.org/10.1016/j.pce.2015.07.004, 2016.
Ragettli, S., Zhou, J., Wang, H., Liu, C., and Guo, L.: Modeling flash floods in ungauged mountain catchments of China: A decision tree learning approach for parameter regionalization, J. Hydrol., 555, 330–346, https://doi.org/10.1016/j.jhydrol.2017.10.031, 2017.
Sun, J., Zhang, J., Wang, J., Liang, J., Zhang, S., Chen, S., Le, J., Rui, X., Ge, S., Li, L., Liu, Z., Cheng, L., Sun, C., Yu, R., Tao, Y., Gao, X., Deng, C., Zhou, L., Li, Y., Chen, Z., and Wang, J.: Standard for hydrological information and hydrological forecasting, Beijing: Standards Press of China, GB/T 22482–2008, 2008.
Wu, B., Xu, W., Huang, H., and Yan, C.: The Land Cover Map for China in the Year 2000, GLC2000 database, European Commission Joint Research Centre, 2003.
Young, A. R.: Stream flow simulation within UK ungauged catchments using a daily rainfall-runoff model, J. Hydrol., 320, 155–172, https://doi.org/10.1016/j.jhydrol.2005.07.017, 2006.
Zhang, Y. and Francis, H.: Relative merits of different methods for runoff predictions in ungauged catchments, Water Resour. Res., 45, https://doi.org/10.1029/2008WR007504, 2009.