the Creative Commons Attribution 4.0 License.
the Creative Commons Attribution 4.0 License.
 | 05 Jun 2018
Framework for quantifying flow and sediment yield to diagnose and solve the aggradation problem of an ungauged catchment
Sagar Kumar Tamang
Wenjun Song
Jose Vasconcelos
J. Brian Anderson
Estimating sediment deposition in a stream, a standard procedure for dealing with aggradation problem is complicated in an ungauged catchment due to the absence of necessary flow data. A serious aggradation problem within an ungauged catchment in Alabama, USA, blocked the conveyance of a bridge, reducing the clearance under the bridge from several feet to a couple of inches. A study of historical aerial imageries showed deforestation in the catchment by a significant amount over a period consistent with the first identification of the problem. To further diagnose the aggradation problem, due to the lack of any gauging stations, local rainfall, flow, and sediment measurements were attempted. However, due to the difficulty of installing an area-velocity sensor in an actively aggrading stream, the parameter transfer process for a hydrologic model was adopted to understand/estimate streamflow. Simulated discharge combined with erosion parameters of MUSLE (modified universal soil loss equation) helped in the estimation of sediment yield of the catchment. Sediment yield for the catchment showed a significant increase in recent years. A two-dimensional hydraulic model was developed at the bridge site to examine potential engineering strategies to wash sediments off and mitigate further aggradation. This study is to quantify the increase of sediment yield in an ungauged catchment due to land cover changes and other contributing factors and develop strategies and recommendations for preventing future aggradation in the vicinity of the bridge.


Soil erosion is the process of degradation of the top layer of soils by mechanical forces of wind or water. About USD 30–40 billion is lost in the US alone due to on and off-site effects such as loss in agricultural productivity, blockage of conveyance of irrigation channel, etc. (Morgan, 2009). One of the most important dataset for modeling soil erosion and quantifying the sediment yield is the streamflow. Streamflow data can be obtained from gauges installed in a stream or be simulated/projected using a hydrologic model. Even in the case of a hydrologic model, streamflow data is necessary as the model's resemblance to reality can be increased through calibration with the existing gauged data (Sivapalan, 2003). However, gauged data is not available in all streams due to financial constraints and installation difficulties. Runoff response prediction in an ungauged catchment remains a complex problem. Considering the scope and importance of the prediction in the ungauged basin (PUB), the International Association of Hydrological Sciences put forward PUB as an initiative for the decade of 2003–2012.
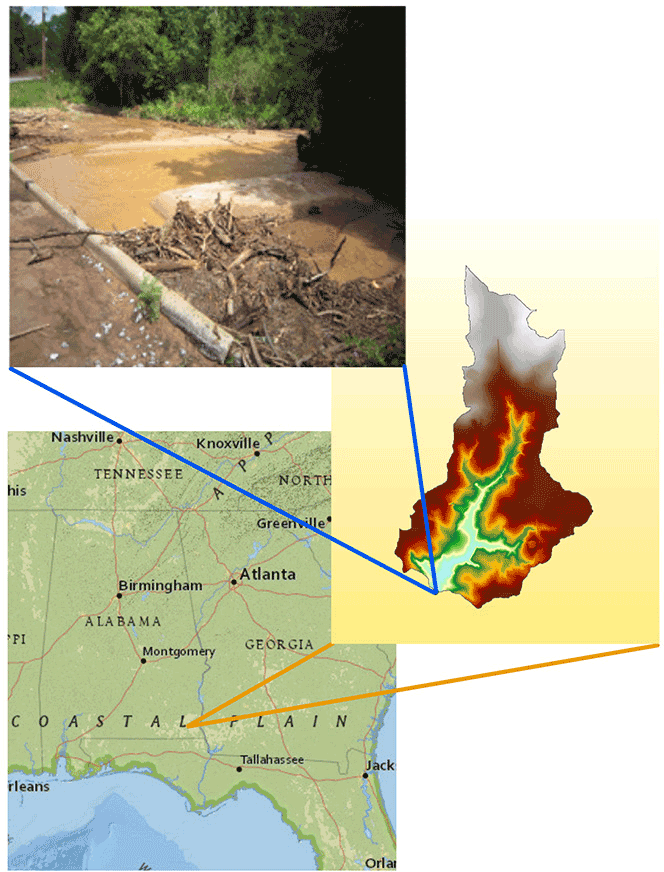
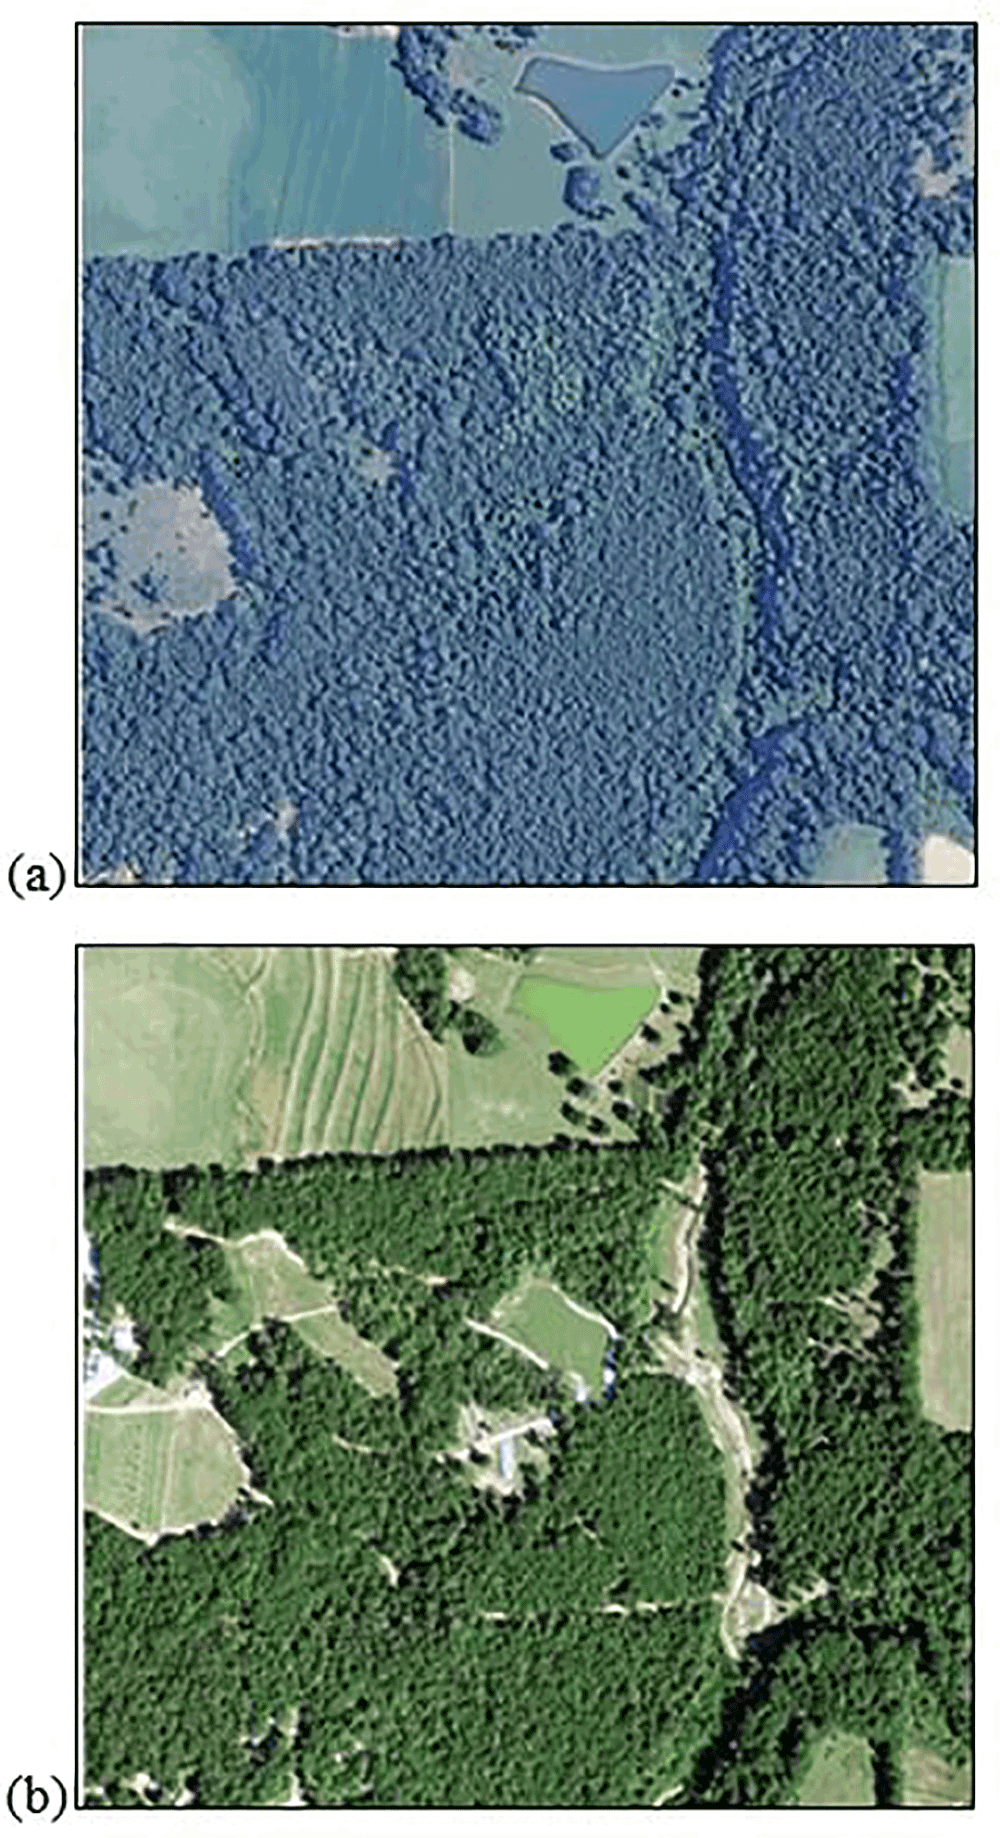
Soapstone Branch, a tributary of the Little Choctawhatchee River located in Dale County, Alabama (AL) has been experiencing a serious aggradation problem (Fig. 1). This problem was first identified in 2013 and aggravated over time reducing the conveyance of the Dean Road bridge from 2.44 m (8 ft.) to a couple of inches by 2014. A detailed study of historical aerial imageries for the Soapstone branch catchment revealed significant land cover changes over a period of several years. In the period from 2011 to 2015, change in land cover due to clear cutting of the trees in the vicinity of the stream channel is clearly visible (Fig. 2). For understanding these effects on the process of aggradation and for quantifying the amount of sediments, a hydrological model together with a sediment model was necessary.
Installation attempts of the area-velocity sensor to record the streamflow data as required in the calibration of the hydrological model failed due to severe aggradation occurring in the stream. The sensor was buried after each storm event and was unable to capture flow dynamics. Therefore, a need for parameter transfer of a hydrological model from a nearby catchment was felt.
It has been well established that among different options for selecting donor catchment for parameter transfer process, spatial proximity performs best. Choctawhatchee river catchment draining near Newton, AL and covering an area of 1776.7 sq. km. (686 sq. miles) was selected as donor catchment for parameter transfer process to Soapstone Branch catchment (7 sq. km. (2.7 sq. miles)). Also, for verifying the parameter transfer process of Soil Moisture accounting (SMA) model, Double Bridges Creek catchment draining near Enterprise, AL and covering an area of 54.4 sq. km. (21 sq. miles) was also selected. Both of the catchments were selected based on their spatial proximity and gauged data availability.
Different types of data viz. digital elevation model (DEM from AlabamaView), land cover data (National Land Cover Database–NLCD), soil data (Soil Survey Geographic Database–SSURGO), streamflow data (U.S. Geological Survey), daily evapotranspiration data (from National Oceanic and Atmospheric Administration–NOAA), and precipitation data (from U.S. Climate Reference Network's quality controlled dataset; Auburn University Mesonet; Local Climatological data from NOAA) were obtained for donor and receiver catchments. Three rainfall stations viz. Troy, Union Springs, and Dothan were used for donor catchment whereas, for receiver catchments, rainfall data from Dothan was used due to data availability and spatial proximity (Tamang, 2017).

Figure 3Nash-Sutcliffe Efficiency of the Model Output due to Percent Change in Parameter Values.
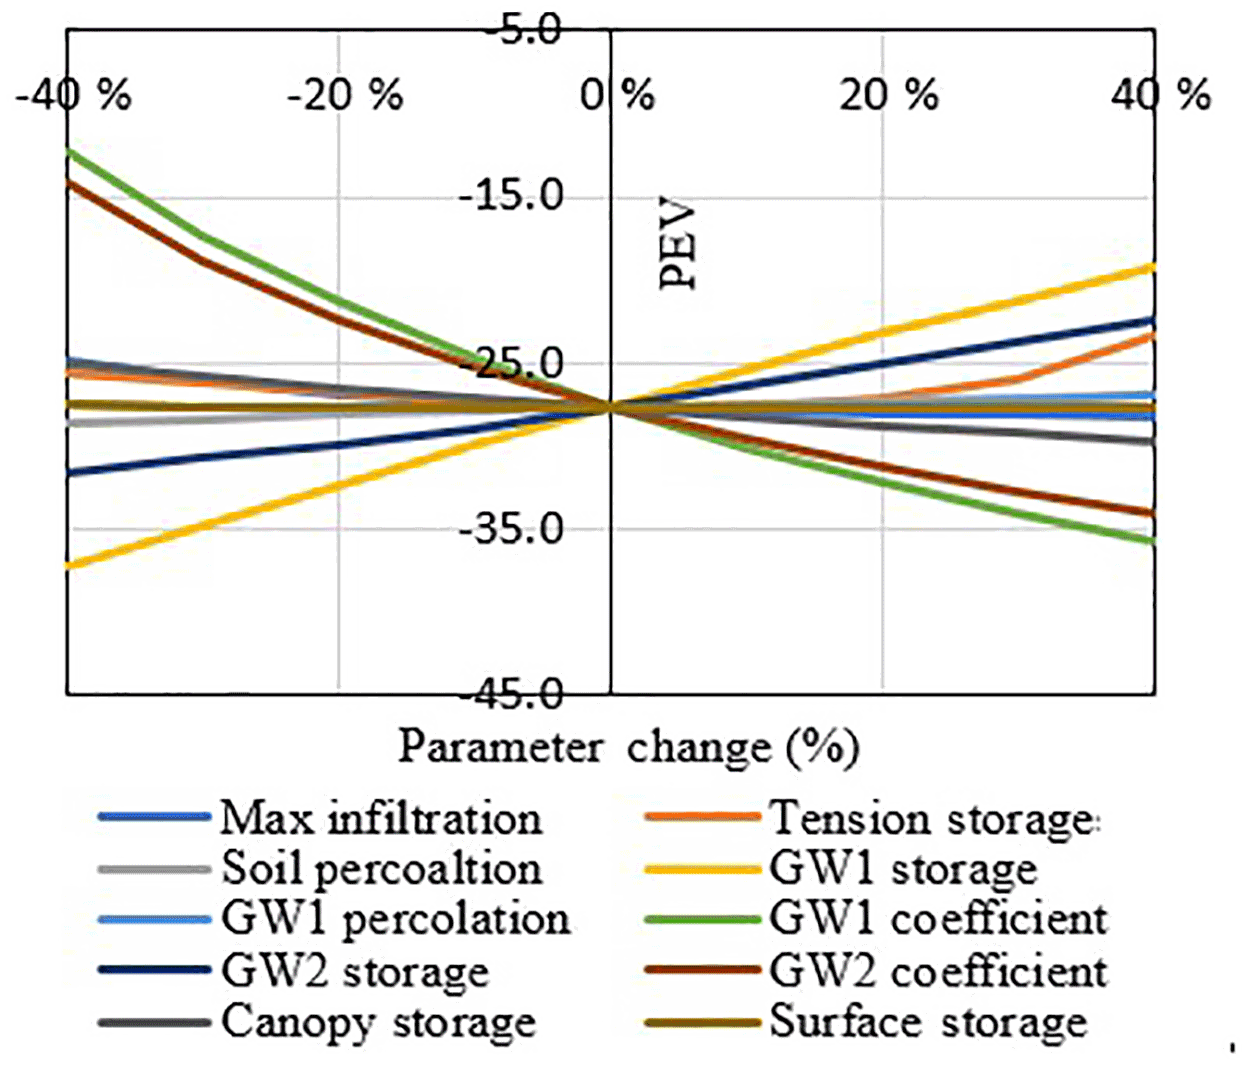
Figure 4Percent Error in Volume of the Model Output due to Percent Change in Parameter Values.
3.1 Hydrologic Model
Hydrologic Engineering Center's Hydrologic Modeling System (HEC-HMS, Feldman, 2000) was developed by US Army Corps of Engineers. HEC-HMS consists of four different models to represent each component of the runoff process viz. models to compute runoff volume, direct runoff, baseflow, and channel routing. HEC-HMS is capable of performing both event and continuous hydrologic simulations. The Soil Moisture Accounting (SMA) algorithm is a continuous, semi-distributed and empirical loss method available within HEC-HMS. It consists of series of different layers for the movement of water within the land-based components (Bennett, 1998).
3.2 Modified Universal Soil Loss Equation
One of the most widely adopted methods for estimating soil erosion worldwide is Universal Soil Loss Equation (USLE). Modified Universal Soil Loss Equation (MUSLE) is an advancement over USLE, developed by replacing the rainfall erosivity factor with the runoff energy factor (Williams, 1975). Unlike USLE for annual sediment application, MUSLE is an event-based soil loss model which considers the effect of runoff energy on generating sediment. The mathematical expression for MUSLE is given by:
Where S is the sediment yield in tons, Q is the runoff volume in acre-ft, qp is the peak discharge (ft3 s−1 or cfs), K is the soil erodibility factor, LS is the topographic factor (ft), C is the cover management factor, and P is the support practice factor.
3.3 Hydraulic Model
HEC's River Analysis System (HEC-RAS) version 5.0.3 (Brunner, 2016) was used in the present study. The model enables the simulation of the river using the two-dimensional (2-D) flow equations, also referred to as the shallow water equations. Inflows can be admitted through boundaries at the edge of the solution domain or even through direct rainfall. Use of 2-D solution is particularly adequate to consider effects of river meandering, proposed alternatives for stream modification and changes of velocity magnitude across the Dean-Road bridge cross-section.
4.1 Catchment Delineation
Catchment delineation for the study area was performed using HEC's Geospatial Hydrologic Modeling Extension: HEC-GeoHMS (Doan, 2000). A stream definition of 0.4 sq. km was selected by using a trial and error method to match the generated streams with the natural streams. This procedure divided the donor catchment into 15 subcatchments and seven subcatchments for Soapstone Branch watershed.
4.2 Land Cover Map Generation
Unsupervised classification using the Iterative Self-Organizing Data Analysis Technique (ISODATA, Nellis et al., 1998) with 40 classes of the similar spectral signature was applied to 2011 and 2015 National Agriculture Imagery Program (NAIP) dataset using ERDAS IMAGINE 2016 software. Using multispectral NAIP imagery, these 40 classes were categorized into 4 different land use types viz. forest (34.4 % in 2011; 28.7 % in 2015), agricultural land (56.3 % in 2011; 58.1 % in 2015), rangeland (8.7 % in 2011; 12.6 % in 2015), and water (0.6 % in 2011 and 2015). For improving the accuracy of land cover classification, the cluster busting technique was applied (Civco et al., 2002).
4.3 Parameter Transfer from Donor Catchment
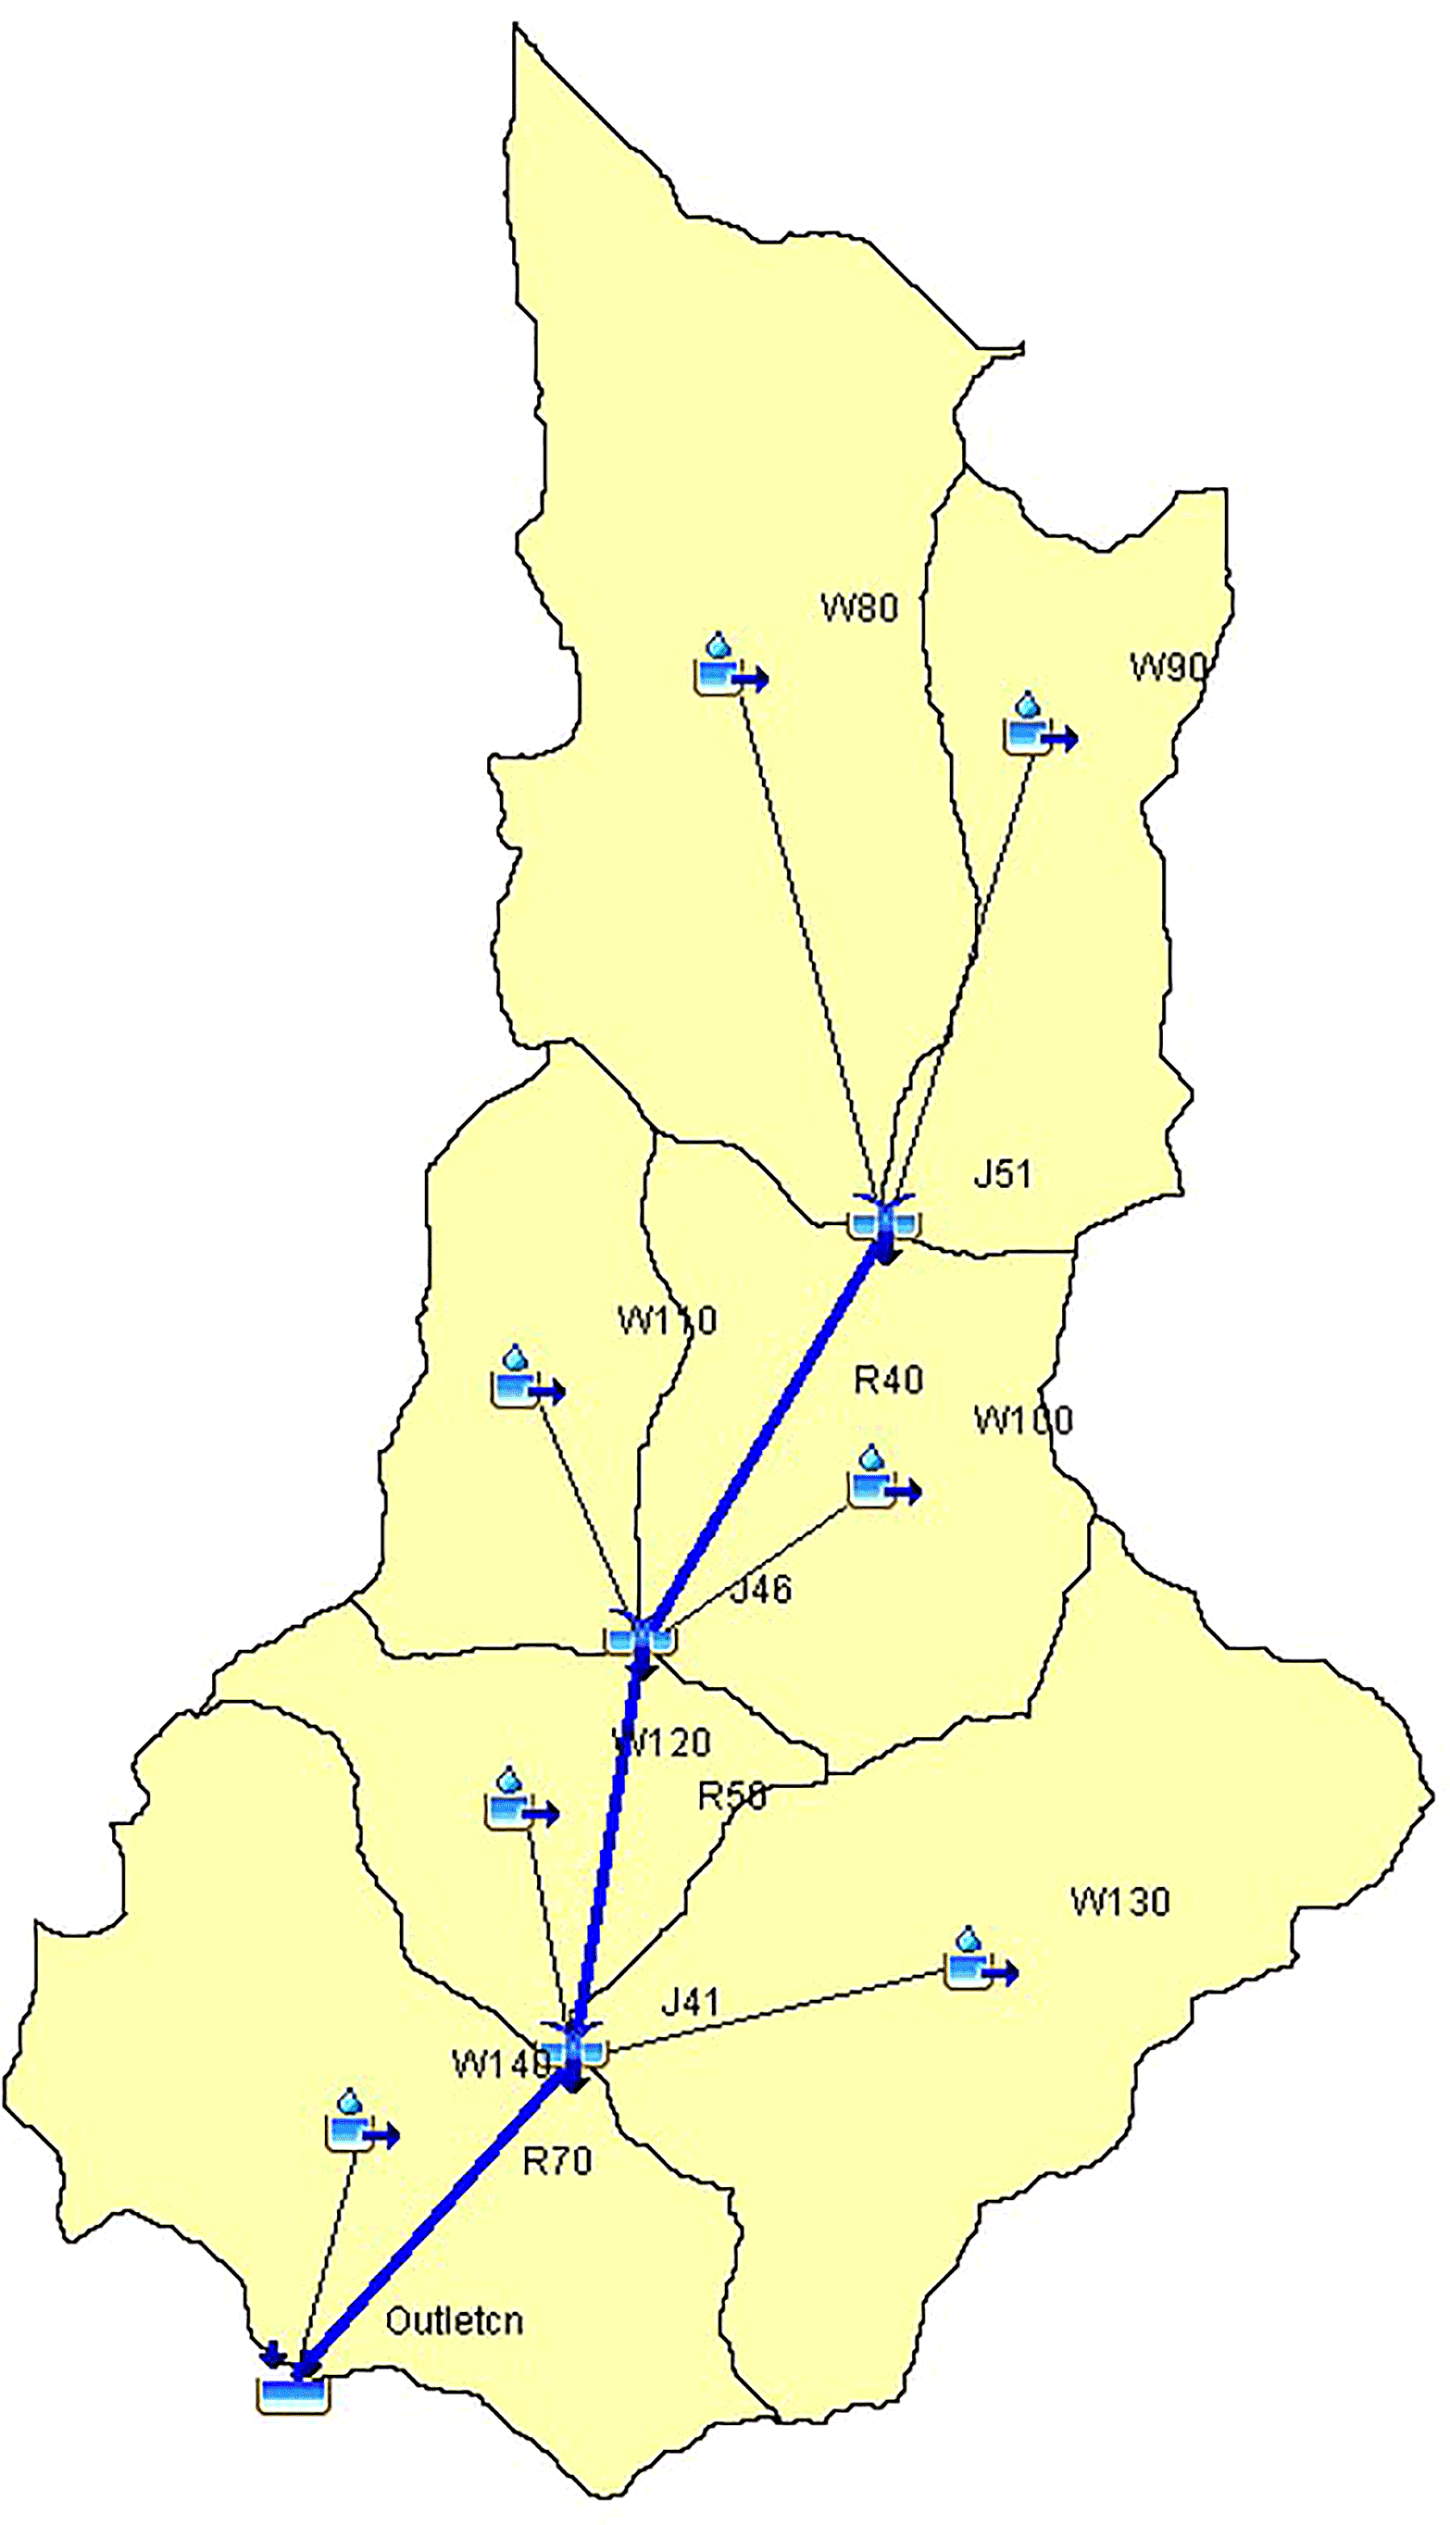
Sensitivity analysis is an important tool for decision makers to identify sensitive or important variables (Pannel, 1997). Therefore, a local sensitivity analysis was performed by varying the values of parameters ±10 % from initial estimates and their effect on Nash-Sutcliffe model efficiency (NSE) and percent error in volume (PEV) is shown in Figs. 3 and 4. On the basis of their sensitivities, parameters were ranked and then highly sensitive thus important parameters together with calibration parameters were then transferred to the receiver catchment. Finally, areal average values of highly sensitive and calibration parameters from the donor catchment were then applied to each of the seven subbasins (Fig. 5) of the Soapstone Branch catchment.
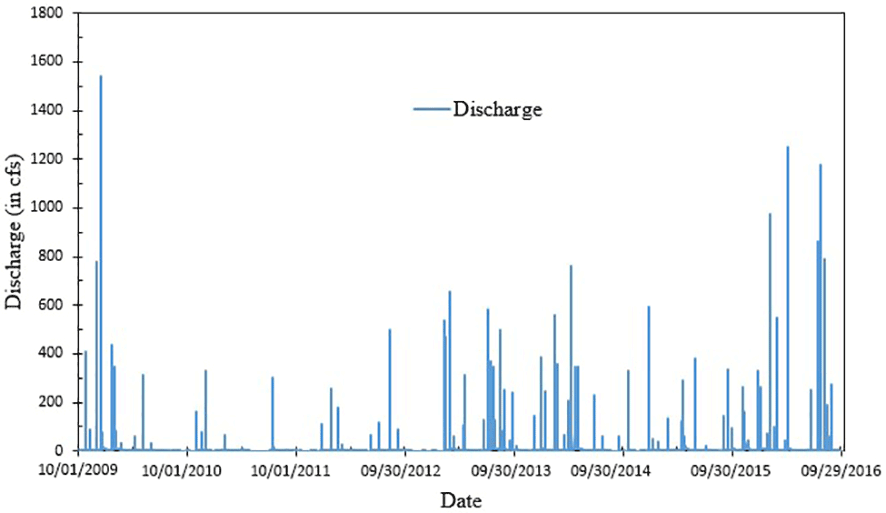


Figure 9Effects of Stream Modification in the Water Velocity at the Dean-Road Bridge Cross Section Calculated by HEC-RAS.
4.4 HEC-HMS Model Setup
HEC-GeoHMS was used for background map development and creating the distributed-basin schematic model file for each of three study catchments. It was also used in checking of errors in catchment model development and connectivity of streams. HEC-HMS model setup for Soapstone branch catchment is shown in Fig. 5 as an example.
4.5 MUSLE Model Development

Figure 10Comparison between Shear Stresses in the Channel Obtained with the Large Trapezoidal and Small Trapezoidal Cross Section Alternatives.
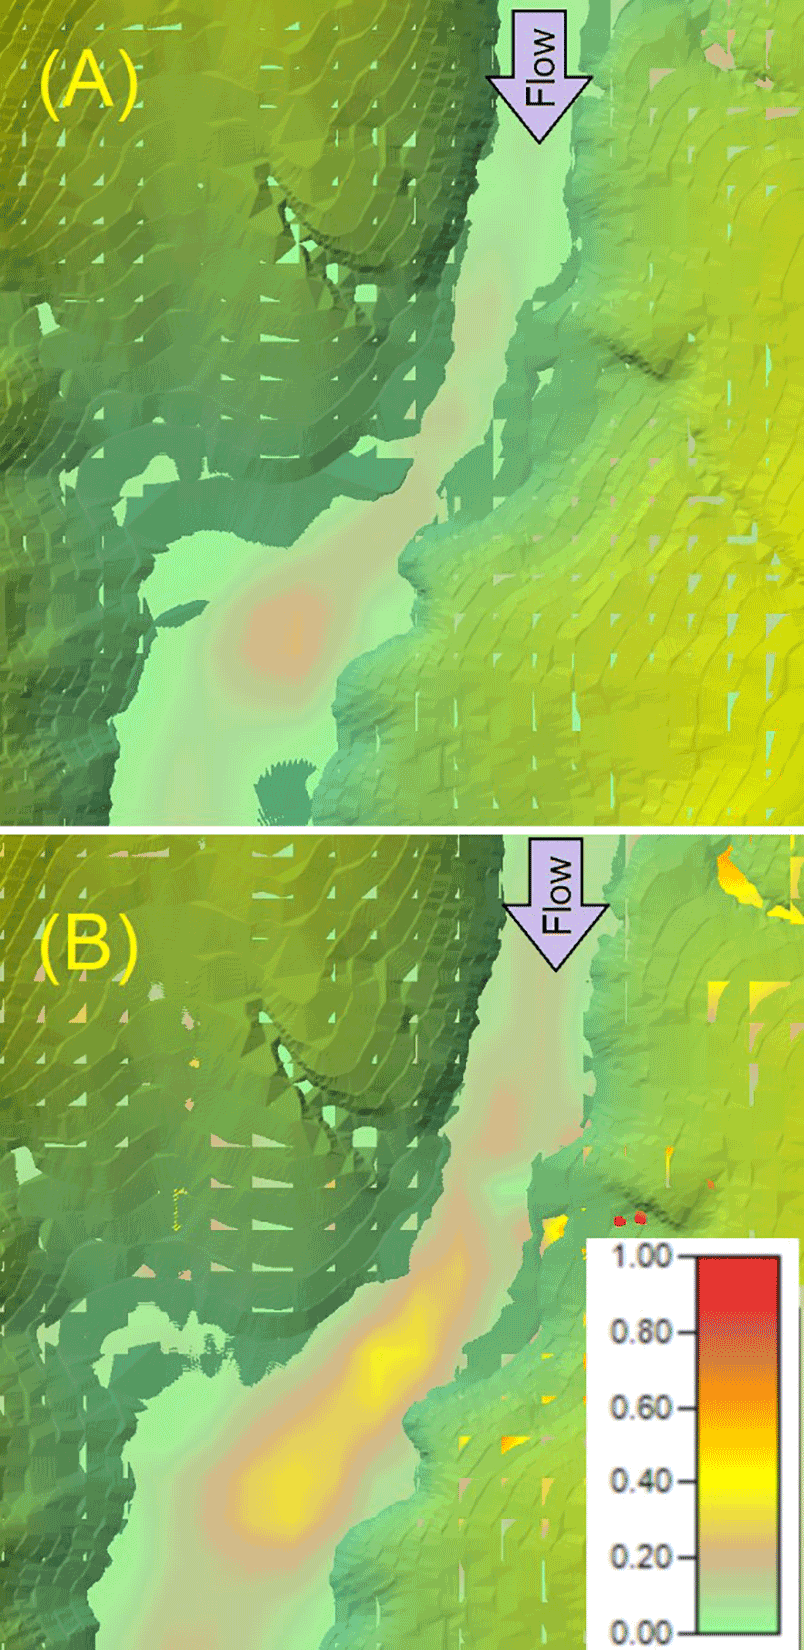
Figure 11Comparison between Shear Stresses in the Channel Obtained with the Large Trapezoidal (a) and Small Trapezoidal (b) Cross Section Alternatives.
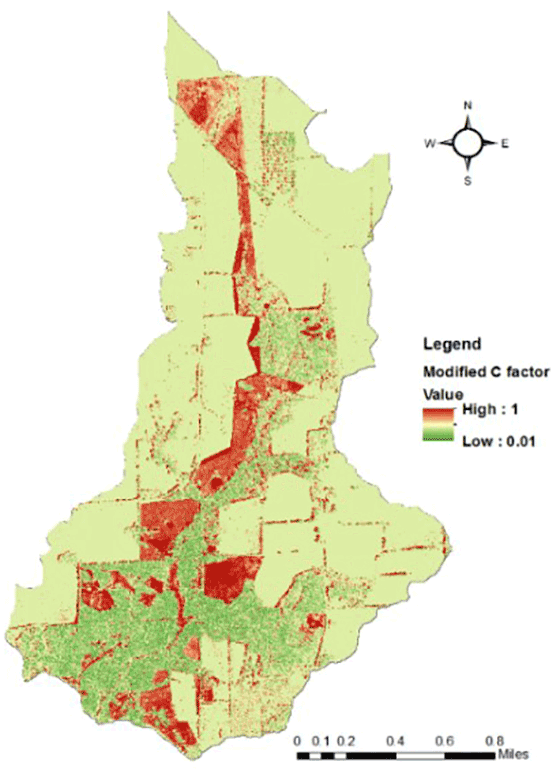
K factor was obtained from soil data available from SSURGO using the online USDA soil data viewer (https://www.nrcs.usda.gov/wps/portal/nrcs/detail/soils/home/?cid=nrcs142p2_053620). LS factor was calculated from slope length and slope gradient values obtained from 3.28 m (1 ft.) resolution DEM of the catchment. The C factor was developed from land cover maps provided by NLCD. However, the most recent available NLCD data is for 2011 and unable to account for land cover changes that occurred during the year 2011–2015. NAIP provides multispectral imagery at a spatial resolution of 1 m every 2 years making it suitable for our study. The C factor for the catchment was developed using normalized difference vegetation index (Gitas et al., 2009) for two different years 2011 and 2015 (Fig. 6) to account for the land cover change in the catchment. Since NAIP imagery was collected during the agricultural growing season (August–September) every two years in the continental US, the computed C factor values are conservative due to the absence of specific information on agricultural practices in the catchment, a conservative value of 1 was selected for P factor.
4.6 HEC-RAS Model Setup
The DEM for Dale County, AL served as a base for the needed elevations for the HEC-RAS 5 model. Mesh sizes were selected so that the typical 2-D cell was around 1.5 to 2 m wide and there would be at least five cells across the bridge cross section. Recorded stage levels were used for model calibration and assessment. Through modification of DEMs using an algorithm implemented in Excel VBA, various alternatives of stream bed elevation near the bridge were considered, emulating the possible strategies for stream modification
5.1 Streamflow Simulation
A calibration period of three years from October 2009–September 2012 and a validation period of three years from October 2012–September 2015 were adopted for the donor catchment. NSE values of 0.73 during calibration and 0.63 during validation period were obtained which are rated as good and satisfactory performance by a continuous hydrologic model (Moriasi et al., 2007), respectively. The receiver catchment (Double Bridges Creek) is a gauged catchment, however to test the efficiency of the model parameter transfer process, it was assumed as an ungauged catchment for the model parameter transfer. The discharge was then simulated for the receiver catchment during a transfer validation period of three years from October 2009–September 2012. NSE value of 0.64 was obtained, which is rated as satisfactory performance for the continuous hydrological model (Moriasi et al., 2007). In 2010, some parts of Alabama experienced severe to extreme drought. Cumulative annual rainfall during this year varied from 508–1778 mm (20–70 in.). throughout Alabama (Tamang, 2017). Due to the fewer number of rainfall stations in both donor and receiver catchment and the discrepancy during this year introduced by the coarser spatial resolution of precipitation data have reduced the NSE values. The semi-distributed HEC-HMS model for Soapstone Branch catchment was then run from October 2009–September 2016 (Fig. 7) after transferring parameters from the donor catchment. During the study period, the annual average precipitation was 1361.4 mm (53.6 in.) with a standard deviation of 365.8 mm (14.4 in.) and range of 922 mm (36.3 in.). An initial warmup period of 9 months was selected to minimize the effects of initial estimated moisture value on the simulation. As seen from Fig. 7, streamflow was low and had fewer storm events in 2010 and 2011 whereas, the remaining years experienced higher streamflow and frequent storm events. The highest streamflow of 43.9 cumecs (1550 cfs) during the study period occurred on 14 December 2009 due to a storm event of 134.1 mm (5.28 in.).
5.2 Effects of stream modification in water velocity
Two alternative cross-sections modifications near the Dean Road bridge site were simulated thus far using HEC-RAS 5. The geometric characteristics of the stream modification are presented in Fig. 8. The small trapezoidal alternative creates more significant blockage to the flow, which reflects on the higher velocities across the bridge, as shown in Fig. 9.
The small trapezoidal stream modification alternative also creates an increase in backwater effect, and both these have an impact on the resulting shear stress under the bridge. The large trapezoidal peak shear stress is in the range of 0.49 kg m−2 (0.10 lb ft−2), which is 70 % smaller than the corresponding value for the small trapezoidal solution (Fig. 10). Also, as it may be noticed, the region with larger shear stresses downstream from the bridge site are much wider in the small trapezoidal alternative (Fig. 11).
5.3 Annual Sediment Yield
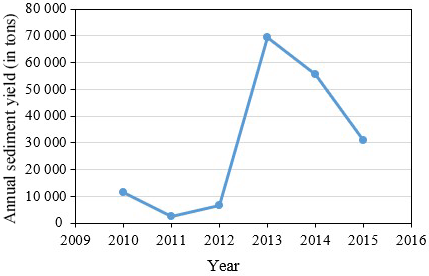
In order to apply event-based MUSLE to continuous streamflow simulation, a threshold of 0.28 cumecs (10 cfs) was selected for sediment generation. SMA model discharge was applied to MUSLE equation to calculate event sediment yield and each event output for a year were summed up to obtain annual sediment yield from 2010–2015 (Fig. 12). In the calculation of sediment yield by MUSLE, 2011 C factor value of 0.347 was determined and applied from 2011–2012 whereas, 2015 C factor value of 0.648 was applied from 2013–2015. During the study period, 2013 had the highest number of storm events i.e. 24 generating sediment whereas 2011 had the lowest number of storm events that generated sediment i.e. 4. The event on 22 February 2013 produced the maximum sediment yield of ∼ 9400 tons. It was also found that the maximum annual sediment yield of 69 439 tons in the catchment was in 2013 which is consistent with the first identification of the aggradation problem. Also, the recent land-cover changes in the catchment have accounted for 34 % increase in sediment yield. The uncertainty of the proposed model for sediment yield computation is dependent on two different parameter sets viz. parameters from hydrologic model and parameters forming the remaining MUSLE equation. Since the discharge is computed for the Soapstone branch only after validating the parameter transfer to an assumed ungauged receiver catchment, the uncertainty associated with the discharge parameters is low and can be considered within the range of satisfactory performance. Also, the attempts were made to reduce the uncertainty of remaining MUSLE parameters by obtaining the data of highest spatial and temporal resolution available, and conservative values viz. 1 m resolution DEM for LS factor, conservative values of C and P factor.
Significant land cover changes in the vicinity of stream negatively altered the discharge and sediment output of the Soapstone Branch catchment and reduced the conveyance of the bridge in the downstream. In the absence of discharge data, parameter transfer approach with an empirical sediment yield method was used to simulate discharge and compute sediment yield. Different cross section modifications were simulated, and it was found that narrowing the stream works best in increasing velocity and washing the sediment off to downstream. An overall goal of the study to quantify the flow and sediment yield in an ungauged catchment was achieved and a recommendation strategy of narrowing the stream thus creating a small depth bank was suggested.
The study is from an on-going project and data are not currently available.
The authors declare that they have no conflict of interest.
This article is part of the special issue “Innovative water resources management – understanding and balancing interactions between humankind and nature”. It is a result of the 8th International Water Resources Management Conference of ICWRS, Beijing, China, 13–15 June 2018.
The authors would like to thank two anonymous reviewers whose valuable
suggestions and comments have greatly improved the quality of the paper.
Also, the authors would like to thank Alabama Department of Transportation
(ALDOT) for funding the project 930-925 (Grant number G00009876) “Analysis
and potential solutions to sediment deposition in Dean Road Bridge watershed,
Midland City, Alabama”.
Edited by: Dingzhi Peng
Reviewed by: two anonymous referees
Bennett, T. H.: Development and application of a continuous soil moisture accounting algorithm for the Hydrologic Engineering Center Hydrologic Modeling System (HEC-HMS), University of California, Davis, 1998.
Brunner, G. W.: HEC-RAS River Analysis System User Manual, version 5.0, US Army Corps of Engineers Report No. CPD 68, 2016.
Civco, D. L., Hurd, J. D., Wilson, S. M., and Zhang, Z.: A comparison of land use and land cover change detection methods, in: ASPRS annual convention proceedings (on CD-ROM), Washington, DC, 2002.
Doan, J. H.: Geospatial hydrologic modeling extension HEC-GeoHMS user's manual, U.S. Army Corps of Engineers Hydrologic Engineering Center, Davis, Calif., 2000.
Feldman, A. D.: Hydrologic modeling system HEC-HMS technical reference manual, U.S. Army Corps of Engineers Hydrologic Engineering Center, Davis, Calif., 2000.
Gitas, I. Z., Douros, K., Minakou, C., Silleos, G. N., and Karydas, C. G.: Multi-temporal soil erosion risk assessment in N. Chalkidiki using a modified USLE raster model, EARSeL eProceedings, 8, 40–52, 2009.
Moriasi, D. N., Arnold, J. G., Van Liew, M. W., Bingner, R. L., Harmel, R. D., and Veith, T. L.: Model evaluation guidelines for systematic quantification of accuracy in watershed simulations, T. ASABE, 50, 885–900, 2007.
Morgan, R. P. C.: Soil erosion and conservation, John Wiley & Sons, 2009.
Nellis, M. D., Harrington, J. A., and Wu, J.: Remote sensing of temporal and spatial variations in pool size, suspended sediment, turbidity, and Secchi depth in Tuttle Creek Reservoir, Kansas, 1993, Geomorphology, 21, 281–293, 1998.
Pannel, D. J.: Sensitivity analysis: strategies, methods, concepts, examples, Agr. Econ., 16, 139–152, 1997.
Sivapalan, M.: Prediction in ungauged basins: a grand challenge for theoretical hydrology, Hydrol. Process., 17, 3163–3170, 2003.
Tamang, S. K.: Quantifying flow and sediment yield of an ungauged catchment using a combination of continuous soil moisture accounting and even-based curve number method, Department of Civil Engineering, Auburn University, Auburn, AL, 2017.
Williams, J. R.: Sediment-Yield Prediction with Universal Equation Using Runoff Energy Factor, Present and Prospective Technology for Predicting Sediment Yield and Sources ARS-S-40, 244-52, 1975.