the Creative Commons Attribution 4.0 License.
the Creative Commons Attribution 4.0 License.
 | 05 Jun 2018
Analysis of the spatial-temporal change of the vegetation index in the upper reach of Han River Basin in 2000–2016
Jinkai Luan
Lianpeng Zhang
Qiang Huang
Jiuliang Feng
Mu Lin
Guobao Li
Han River is the water source region of the middle route of South-to-North Water Diversion in China and the ecological projects were implemented since many years ago. In order to monitor the change of vegetation in Han River and evaluate the effect of ecological projects, it is needed to reveal the spatial-temporal change of the vegetation in the upper reach of Han River quantitatively. The study is based on MODIS/Terra NDVI remote sensing data, and analyzes the spatial-temporal changes of the NDVI in August from 2000 to 2016 at pixel scale in the upper reach of Han River Basin. The results show that, the area with increasing NDVI between 0 and 0.005 per year accounts for 62.07 % of the area of upper reach of Han River Basin, and the area with changing rate between −0.005 and 0 per year accounts for 26.65 % of the research area. The area with significant decreasing trend only accounts for 2.76 %, while area significant increasing trend accounts for 13.47 %, and the area with increasing NDVI is much larger than the area with reducing NDVI. The vegetation index of each county is evaluated and found that, the areal proportion with significant decreasing trend in Hantai is the biggest, reaching 35.57 %. The areal proportion with significant increasing trend in Zhenba County, Ziyang County, Xunyang County, Zhashui County, Shangzhou District, Shanyang County and Yun County is larger than the others, and the areal proportions are more than 20 %. The largest areal proportion with significant increasing trend is in Shangzhou District and it reaches 31.11 %. On the whole, the area ratio in all districts and counties with increasing NDVI is much larger than the area ratio with decreasing NDVI.


Vegetation is a link between soil, atmosphere and water (Li et al., 2011), and plays a coordinating role in the balance of the earth ecosystem, climate change and water cycle (Sun et al., 1998; Mao et al., 2012). At the same time, vegetation is one of the most important and sensitive components of global land cover, which can reflect the impacts of climate change and human activities in a short period (Zhang et al., 2008). As the best indicator of vegetation growth and coverage, Normalized difference vegetation index (NDVI) is the surface characteristic parameter of remote sensing data, which reflects the distribution characteristics and changes of vegetation, and is the basic data of vegetation research (Zhao, 2012; Marchetti et al., 2016; Wu et al., 2017; Birtwistle et al., 2016).
Based on MODIS NDVI remote sensing data, Liu et al. (2017) analyzed the vegetation change in the southern Mu Us desert from 2000 to 2013, and concluded that the average annual NDVI showed an upward trend with an annual growth rate of per year, and also analyzed the level of NDVI year by year transfer. Luo et al. (2017) used the trend analysis, R/S analysis, partial correlation analysis and residual analysis methods to analyze the spatial and temporal variation characteristics of NDVI in the past 2000–2013 years. Based on the MODIS NDVI vegetation data from 2001 to 2010 in Qaidam Basin, Xu and Yang (2014) used linear trend analysis method, and analyzed the variation characteristics of vegetation in the Qaidam Basin in a decade. Liu et al. (2015) found that the vegetation NDVI showed a significant upward trend in North China in 1981–2006 years, with an increase rate of 0.009/10a, and pointed out that there was obvious spatial difference in this change. Zhang et al. (2013) found that the annual growth rate of NDVI in Inner Mongolia grassland growth season was 0.735 %, among which the typical grassland growth was the most obvious, and 31.807 % of grassland NDVI showed a downward trend. After studying the vegetation index of Yulin in Shaanxi Province, the authors found that the vegetation index of most areas of Yulin has shown a significant increase in recent 17 years (Luan et al., 2017). Using the trend analysis method, Lv et al. (2014) analyzed the temporal and spatial variation of vegetation cover in the Yarlung Zangbo River Basin based on the pixel size and found that the improved area of NDVI in the watershed was larger than the degraded area, showing a slowly rising trend overall, but the persistence of this trend showing a significant spatial difference. Bai et al. (2014) used correlation analysis and spatial statistical analysis to analyze the temporal and spatial variation characteristics of 2000-2010 vegetation NDVI in Northern Shaanxi Province. It is found that the vegetation NDVI in Northern Shaanxi has experienced 3 stages, from relatively rapid growth to small fluctuations, and then to steady growth. Li and Chen (2014) analyzed the temporal and spatial distribution of NDVI in the arid region of northwest China from 1982 to 2006 and found that the NDVI of vegetation coverage and growing season increased significantly before 2000 but decreased after 2000. The obvious decrease is in Yili Valley, Zhongtian Mountain and plain areas, showing an increasing trend in the mountainous areas or at the source of rivers and on some banks of some rivers. Generally, the analysis of NDVI spatial and temporal variation is based on the linear regression analysis, which can be used to analyze the variation and spatial distribution of NDVI.
Han River Basin is the water source of the Middle Route Project of South-to-North Water Diversion and the water diversion project from Han to Wei River. In recent years, the ecological protection projects such as comprehensive watershed management and vegetation conservation have been carried out extensively. The implementation of these projects, especially the “Changzhi” and “Danzhi” project has achieved a certain effect (Gao, 2012; Wang, 2012; Wang et al., 2011). With the implementation of the ecological protection project, the vegetation in the Han River Basin has been improved to some extent. In order to reveal the temporal and spatial characteristics of vegetation change and evaluate the implementation effect of ecological engineering, it is an effective method to quantify the vegetation index by remote sensing.
In the related research, Ma (2013) carried on the trend line analysis to the annual average NDVI of the whole Han River Basin in Shaanxi Province in 2000–2010 years, compared the NDVI in 2000 and 2010, but did not carry on the spatial and temporal variation analysis and the change degree evaluation based on the pixel scale. At present, there are few studies on the temporal and spatial variation characteristics of vegetation index in the upper reach of Han River Basin, especially the spatial variability of vegetation index at pixel scale. Therefore, taking the upper reach of the Han River Basin as the research area, NDVI of August (growing season) from 2000 to 2016 was analyzed by linear regression trend line on the pixel scale to evaluate the NDVI variation of each pixel. Finally, the vegetation index of each district in the upper reach of the Han River Basin was evaluated to reveal the changes of vegetation on each scale in each county in recent years. This may provide reference for policy making and effect evaluation of ecological protection of water sources in the middle route of South-to-North Water Diversion Project.
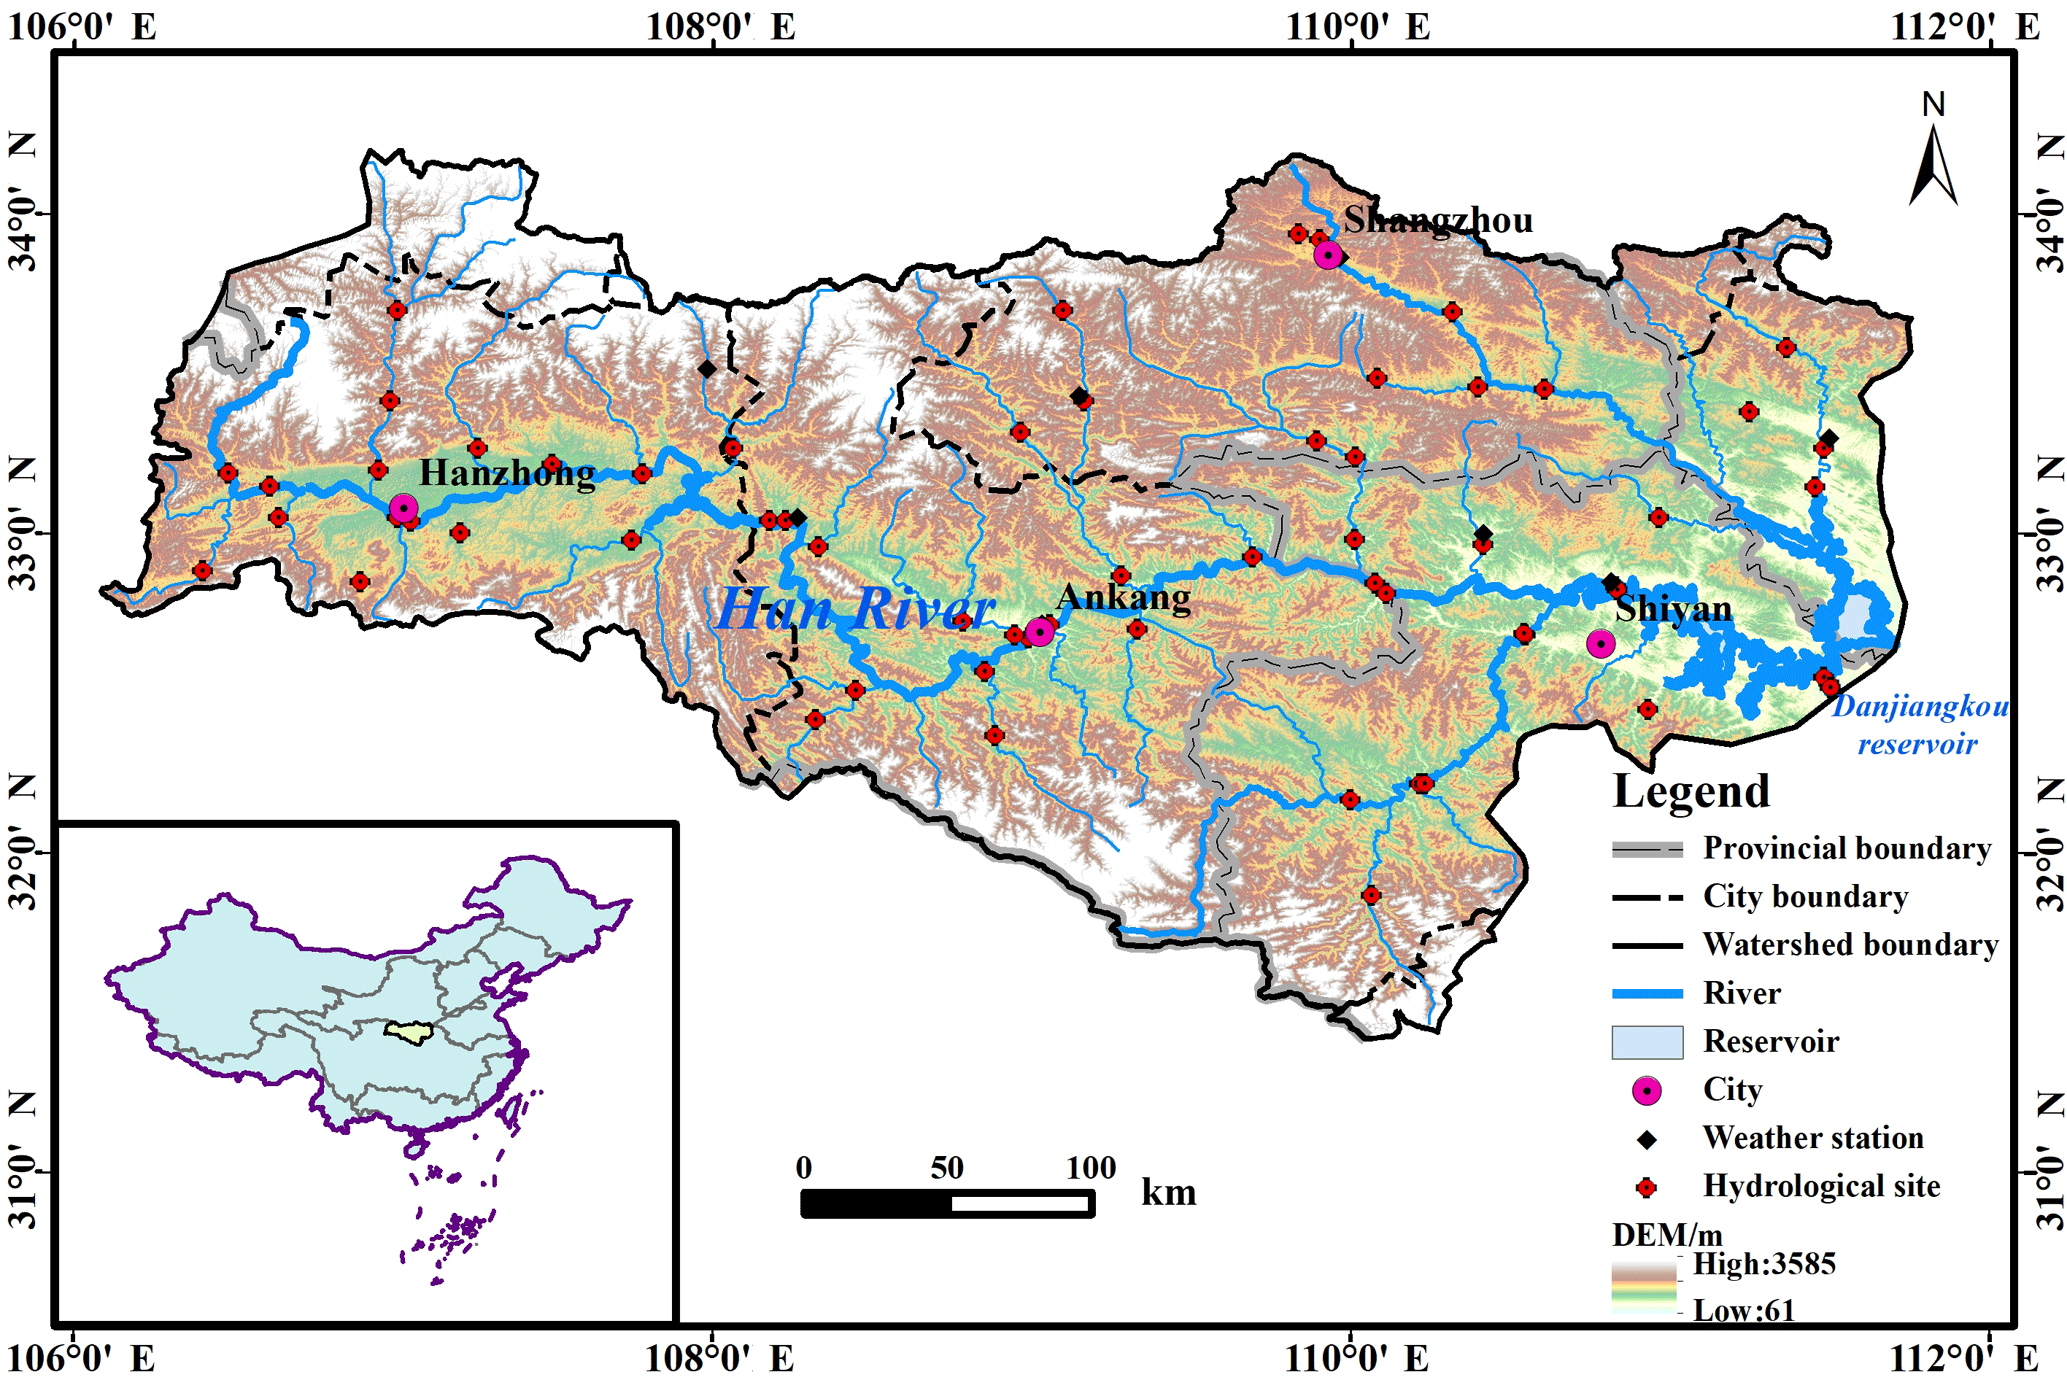
Han River is the largest tributary of the Yangtze River, with the total length of 1577 km, the basin area of 159 000 km2, and the average annual water resources 56.6 billion m3. Taking Danjiangkou Reservoir and Zhongxiang as the boundaries of upper, middle and lower reach, it flows into the Yangtze River in Wuhan, and the upper reach of the Han River Basin are located above Danjiangkou Reservoir (Fig. 1). The basin includes Hanzhong City in Shaanxi Province, Ankang City in Shaanxi Province, Shangluo City in Shaanxi Province, Hubei Province Shiyan City, in addition to a small part of Gansu Province and Henan Province. The western region of the study area belongs to the north subtropical monsoon climate, and the eastern part is the transition climate between the north subtropical zone and the warm temperate zone. The climate is mild, the heat is relatively sufficient, and the four seasons are distinct (Zhou et al., 2011).
3.1 Data
Using MODIS NDVI data to analyze vegetation changes is one of the most important ways to study vegetation evolution (Liu and Tian, 2015). So this article uses NDVI remote sensing data from the MODIS/Terra website, the full name of the dataset is MODIS/Terra Vegetation Indices 16-Day L3 Global 250 m SIN Grid V005, referred to as MOD13Q1. MOD13Q1 data is a 16-day composite with a spatial resolution of 250 m. The data file contains data for 12 fields. Valid NDVI values are between −1 and 1.
In this paper, two images of h26v5 and h27v5 are used. Firstly, the downloaded images are combined, cropped and re-projected by using the software MODIS Reprojection Tool (MRT). In this study, only NDVI images were analyzed in August, MOD13Q1 data had 2 images in August, and the images were maximized and composited. So we get an image every year, and 17 images in 2000–2016 years.
3.2 Linear regression trend line analysis
Linear regression trend line analysis is a method of regression analysis for a set of variable with time. The method can analyze the change trend of each pixel in the study area, and simulate the Greenness Rate of Change (GRC) of vegetation. GRC is defined as the slope of the linear regression equation for the inter-annual variability of the Seasonally Integrated Normalized Difference Vegetation Index (SINDVI) over a period of time (Song and Ma, 2008; Stow et al., 2003). In this paper, the NDVI of each pixel for 17 years can be used to simulate the change trend of NDVI of this pixel during the 17 years and to estimate the variation range. The regression slope is calculated by the least square method. The formula is as follows:
where i is the ith year from 1 to 17 years; NDVIi is the NDVI value in ith year. If slope > 0, NDVI has shown an increasing trend; slope = 0, NDVI has not changed; slope < 0, NDVI showed a decreasing trend.
4.1 Temporal and spatial variation characteristics of NDVI
By means of linear regression trend line analysis, the pixel NDVI spatial distribution slope map (Fig. 2) and different levels of slope area in 2000–2016 years in August (Table 1) are obtained. The slope of the whole basin was between −0.054 and 0.041, and the vegetation index increased more than the decrease range. The area of green region in Fig. 2 is larger than the area of red region, indicating that the area of increased vegetation index in recent 17 years is larger than the area of reduced vegetation index. There was no obvious regularity in the distribution of the areas where vegetation index increased and decreased.

Figure 2Distribution of NDVI linear regression slope in upper reach of Han River Basin from 2000 to 2016.
Table 1NDVI variance linear regression trend line analysis of changes in upper reach of Han River Basin from 2000 to 2016.
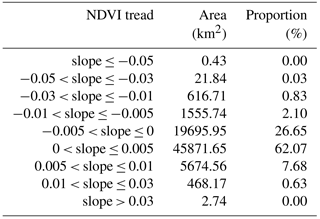
Table 1 is a linear regression trend line analysis of vegetation index in Han River Basin, the area of reduced NDVI is 21 890.67 km2, accounting for 29.61 % of the total area of the whole basin. The area of slope between 0 and −0.005 is 19 695.95 km2, accounting for 26.65 % of the total area of Han River Basin (above Danjiangkou). The area of increased NDVI is 52 017.12 km2, accounting for 70.39 % of the total area of the river basin, in which the area of slope between 0 and 0.005/a accounts for 62.07 %. It shows that over 70 % of the Han River basin (above the Danjiangkou) has shown an increasing trend in NDVI in recent years, and the increasing value is basically between 0 and 0.005/a. The vegetation coverage of the Han River basin (above the Danjiangkou) is gradually increasing.
4.2 Evaluation of variation degree about NDVI
In order to quantitatively analyze the degree of NDVI change in the study area, correlation coefficient analysis is conducted between annual NDVI images and time series to obtain the regression coefficient of each NDVI value and year, that is rxy, and the coefficient was tested at the significant level of 0.05, and the distribution is shown in Fig. 3.

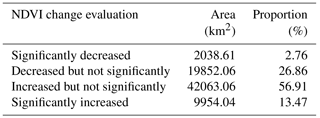
If the rxy value is greater than 0.05 significance level (p < 0.05) r0.05=0.482, the trend of NDVI increase or decrease is considered significant. As shown in Fig. 3, the distribution of area significantly decreased, decreased but not significantly, increased but not significantly and significantly increased was disorganized. So it is necessary to quantitatively analyze the area and proportion of each region (Table 2). In Table 2, the areas with significant reduction accounted for only 2.76 % of the whole basin, the areas with lower but less significant accounted for 26.86 %, the areas with increased but not significant accounted for 56.91 %, and the areas with significant increase accounted for 13.47 %. By comparing with Table 1, it is found that the region of slope ≤ −0.005/a is substantially reduced. In general, the index of vegetation in the upper reaches of the Han River shows an increasing trend, which means that the vegetation coverage gradually increases. According to the Soil and Water Conservation Bulletin of the Yangtze River Basin, it was found that the total area of water and soil erosion in the Danjiangkou reservoir area and the upper reaches of Danjiangkou was 20 762 km2. The Danjiangkou reservoir area and upstream is a key region of the national soil and water conservation area, and the soil erosion is serious before. The soil and water conservation project has achieved a certain effect and the vegetation coverage increased.
Table 2NDVI change evaluation in upper reach of Han River Basin from 2000 to 2016.
4.3 Evaluation of the change degree of NDVI in each county
Because the spatial variation of each level of change is irregular, in order to find out the changes of vegetation in each county in recent years, we evaluate the NDVI of each county in the upper reach of the Han River basin, which will provide a reference for better environmental policy. Since there are many counties in the upper reach of the Han River basin and only a small part of some counties are located in the upper reach of the Han River basin, Therefore, this paper selects Taibai County of Baoji City, Hantai District, Lueyang County, Ningqiang County, Mianxian County, Nanzheng County, Liuba County, Chenggu County, Yang County, Xixiang County, Zhenba County and Foping County; Ningshan County, Shiquan County, Hanyin County, Ziyang County, Hanbin District, Langao County, Xunyang County, Pingli County, Zhenping County and Baihe County; Shangzhou District, Zhashui County, Zhen'an County, Sanyang County, Danfeng County and Shangnan County, Xixia County in Henan Province, Zhuxi County, Zhushan County, Yunxi County, Fang County and Yun County in Hubei Province County and Shiyan City (Maojian District, Zhangwan District, Shiyan Economic Development Zone), a total of 35 counties, including almost all the upper reach of the entire basin, according to Fig. 1. To evaluate the changes of NDVI in these counties, and determine the proportions of each change degree of each county and city in the upper reach of Han River, as the results are shown in Table 3.
Table 3NDVI change evaluation of every counties and district in upper reach of Han River Basin from 2000 to 2016.
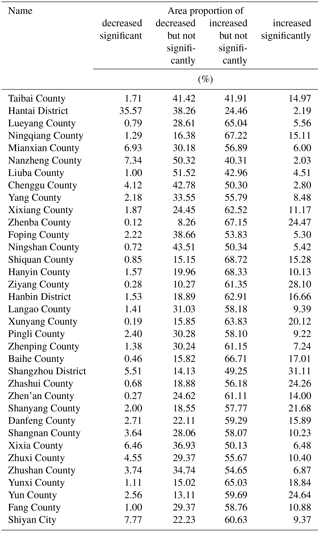
As shown in Table 3, as long as the proportion of Hantai District area is significantly reduced by more than 10 %, and even reached 35.57 %, the proportion of significant reduction in other districts and counties is below 10 %. The proportion of increased but not significant accounted for the largest proportion, basically all districts and counties have reached more than 50 %, and some counties close to 70 %. The proportion of decreasing but not significant proportion was the second, but fluctuated among different districts and counties, between 8.26 ∼ 51.52 %. Significant increase in a larger proportion for Zhenba County, Ziyang County, Xunyang County, Zhashui County, Shangzhou District, Shanyang county and Yun county, were more than 20 %. The largest is in Shangzhou District, and it reached 31.11 %. Overall, the NDVI increased proportion in each county is far greater than the proportion of reduced. The reason for the decrease of vegetation index in Hantai is that in recent years, Hantai district has been actively developing and building industrial parks, and the total area of cultivated land has decreased by 16.56 % from 2000 to 2016.
This paper uses MODIS/Terra NDVI time series data to analyse the temporal and spatial variation characteristics of vegetation index in the upper reach of Han River during growing season (August) in 2000–2016, and the conclusions are the following.
- 1.
According to the linear regression trend line analysis, it was found that 70.39 % of the upper reach of the Han River basin had an increased regional vegetation index, and the area with increasing rate of 0–0.005/a accounts for 62.07 % of the total area; the area with slope between 0 and −0.005 accounts for 26.65 % of the total area in the upper reach of the Han River Basin; the variation of NDVI in the upper reach of the basin is basically between −0.005 and 0.01/a.
- 2.
After the assessment of the change of vegetation index in the upper reach of the Han River Basin, it was found that the significant reduction area accounted for only 2.76 % of the whole basin, and the significant increased area accounted for 13.47 %. The increased area is far greater than the reduced area.
- 3.
In order to reveal the distribution of significant changes in the region, the vegetation index in each county was evaluated and found that the largest proportion of significantly decreased is Hantai and it reached 35.57 %, while the percentage of other districts and counties significantly decreased below 10 %. The Zhaoyang County, Xiyang County, Xunyang County, Shangzhou District, Zhashui County, Shanyang County and Yun County were all significantly increased by more than 20 %, and the largest is Shangzhou District, reaching 31.11 %. On the whole, the area ratio in all districts and counties with increasing NDVI is much larger than the area ratio with decreasing NDVI.
For specific basic data,please contact the author Luan Jinkai (ljk_940202@163.com).
The authors declare that they have no conflict of interest.
This article is part of the special issue “Innovative water resources management – understanding and balancing interactions between humankind and nature”. It is a result of the 8th International Water Resources Management Conference of ICWRS, Beijing, China, 13–15 June 2018.
This work was partially supported by the National Natural Science Foundation
of China (NSFC) (Grant No. 51779203, 51609270, 41330858). Funding was also
provided by the Basic Research Plan of Natural Science of Shaanxi Province
(2016JQ5105) and Project of the plan of science and technology of Yulin
(2016-21). The authors would like to thank the anonymous reviewers for their
comments to improve the paper.
Edited by: Zongxue Xu
Reviewed by: two anonymous referees
Bai, J.-j., Bai, J.-t., and Wang, L.: Spatio-temporal Change of Vegetation NDVI and Its Relations with Regional Climate in Northern Shaanxi Province in 2000–2010, Scientia Geographica Sinica, 34, 882–888, 2014.
Birtwistle, A. N., Laituri, M., Bledsoe, B., and Friedman, J. M.: Using NDVI to measure precipitation in semi-arid landscapes, J. Arid Environ., 131, 15–24, 2016.
Gao, Q.: Problems and Countermeasures of ecological management in Hanjiang River Basin, Shaanxi Agricultural Sciences, 3, 192–195, 2012.
Li, M. J., Hou, X. Y., Ying, L. L., Lu, X., and Zhu, M. M.: Spatial-Temporal Dynamics of NDVI and Its Response to Temperature and Precipitation in the Yellow River Delta during the Period 1998–2008, Resource Science, 33, 322–327, 2011.
Li, Q. and Chen, Y.: Response of spatial and temporal distribution of NDVI to hydrothermal condition variation in arid regions of Northwest China during 1981–2006, Journal of Glaciology and Geocryology, 36, 327–334, 2014.
Liu, B., Sun, Y., Wang, Z. H., and Zhao, T.: Analysis of the vegetation cover change and the relative role of its influencing factors in North China, Journal of Natural Resource, 30, 12–23, 2015.
Liu, D. and Tian, F.: Ecohydrological Evolution Model On Riparian Vegetation In Lower Tarim River, Science Press, Beijing, 37–46, 2015.
Liu, D., Wang, X., Huang, Q., Meng X., and Lin M.: Study on the evolution law of the vegetation index in the southern Maowusu Desert, Journal of Water Resources and Water Engineering, 28, 5–9, 2017.
Luo, M., Jiapaer, G., Guo, H., Zhang, P.-f., Meng, F.-h., and Liu, T.: Spatial-temporal Variation of Growing-season NDVI and Its Responses to Hydrothermal Condition in the Tarim River Basin from 2000 to 2013, Journal of Natural Resource, 32, 50–63, 2017.
Luan, J., Liu, D., Huang, Q., Feng, J., Lin M., and Li G.: Analysis of the spatial-temporal change and impact factors of the vegetation index in Yulin of Shaanxi Province in the last 17 years, J. Ecol., 38, 1–11, 2018.
Lv, Y., Dong, G., Yang, Sh., Zhou, Q., and Cai, M.: Spatio-Temporal Variation in NDVI in the Yarlung Zangbo River Basin and Its Relationship with Precipitation and Elevation, Resource Science, 36, 0603–0611, 2014.
Ma, C.: Multi-scale vegetation cover changes in Shaanxi Hanjiang river basin, Journal of Shaanxi University of Technology (Natural Science Edition), 29, 66–70, 2013.
Mao, D., Wang, Z., Luo, L., and Guang, Y.: Correlation Analysis between NDVI and Climate in Northeast China based on AVHRR and GIMMS Data Sources, Remote Sensing Technology and Application, 27, 77–85, 2012.
Marchetti, Z. Y., Minotti, P. G., Ramonell, C. G., Schivo, F., and Kandus, P.: NDVI patterns as indicator of morphodynamic activity in the middle Paraná River floodplain, Geomorphology, 253, 146–158, 2016.
Song, Y. and Ma, M.: Variation of AVHRR NDVI and its Relationship with Climate in Chinese Arid and Cold Regions, Journal of Remote Sensing, 12, 499–505, 2008.
Sun, H., Wang, Ch., Niu, Zh., Bu, He., and Li, B.: Analysis of the Vegetation Cover Change and the Relationship between NDVI and Environmental Factors by Using NOAA Time Series Data, Journal of Remote Sensing, 2, 204–210, 1998.
Stow, D., Daeschner, S., Hope, A., Douglas, D., Petersen, A., Myneni, R., Zhou, L., and Oechel, W.: Variability of the seasonally integrated Normalized Difference Vegetation Index across the north slope of Alaska in the 1990s, Int. J. Remote Sens., 24, 1111–1117, 2003.
Xu, H.-j. and Yang, T.-b.: Spatial-temporal variations of Vegetation Activities and Its Responses to Climatic Factors in the Qaidam Basin, Journal of Natural Resource, 29, 398–409, 2014.
Wang, X.: Technology and practice of ecological clean small watershed construction in Dan Han River Basin of Shaanxi Province, Soil and water conservation in China, 2, 11–13, 2012.
Wang, X., Li, Zh., Li, P., and Zhang, L.: Present situation and Control Countermeasures of non-point source pollution in Dan Han River Basin of Shaanxi Province, Soil and Water Conservation Bulletin, 31, 186–189, 2011.
Wu, C., Peng, D., Soudani, K., Siebicke, L., Gough, C. M., Arain, M. A., Bohrer, G., Lafleur, P. M., Peichl, M., Gonsamo, A., Xu, S., Fang, B., and Ge, Q.: Land surface phenology derived from normalized differencevegetation index (NDVI) at global FLUXNET sites, Agr. Forest Meteorol., 233, 171–182, 2017.
Zhang, Q., Wu, Sh., Zhao, D., and Dai, E.: Responses of Growing Season Vegetation Changes to Climatic Factors in Inner Mongolia Grassland, Journal of Natural Resource, 28, 754–764, 2013.
Zhang, Y., Zhao, Zh., Li, Sh., and Meng, X.: Indicating variation of surface vegetation cover using SPOT NDVI in the northern part of North China, Geographical Research, 27, 745–755, 2008.
Zhao, Y.: Principles and Methods of Remote Sensing Application Analysis, Science Press, Beijing, 366–375, 2012.
Zhou, Q., Bian, J., and Zheng, J.: Variation of Air Temperature and Thermal Resources in the Northern and Southern Regions of the Qinling Mountains from 1951 to 2009, Acta Geographica Sinica, 66, 1211–1218, 2011.