the Creative Commons Attribution 4.0 License.
the Creative Commons Attribution 4.0 License.
 | 05 Jun 2018
Evaluation of water productivity under climate change in irrigated areas of the arid Northwest China using an assemble statistical downscaling method and an agro-hydrological model
Zezhong Guo
Guanhua Huang
The Heihe River Basin (HRB) is the second largest inland river basin, located in the arid region of Northwest China with a serious water shortage. Evaluation of water productivity will provide scientific implications for agricultural water-saving in irrigated areas of the arid region under climate change. Based on observed meteorological data, 23 GCMs outputs and the ERA-40 reanalysis data, an assemble statistical downscaling model was developed to generate climate change scenarios under RCP2.6, RCP4.5, RCP8.5 respectively, which were then used to drive the SWAP-EPIC model to simulate crop growth in the irrigated areas of the middle HRB for the future period from 2018 to 2047. Crop yield showed an increasing trend, while crop water consumption decreased gradually in Gaotai and Ganzhou irrigated areas. The water productivity in future 30 years showed an increasing trend in both Gaotai and Ganzhou areas, with the most significant increase under RCP4.5 scenario, which were both larger than 2 kg m−3. Compared with that of the period from 2012 to 2015, the water productivity during 2018–2047 under three RCP scenarios increased by 9.2, 14.3 and 11.8 % in the Gaotai area, and 15.4, 21.6, 19.9 % in the Ganzhou area, respectively.


The Fifth Assessment Report, issued by the Inter-governmental Panel on Climate Change (IPCC), affirmed the reality of climate warming. Since 1950s, the global climate has changed dramatically and these changes have involved atmospheric warming, shrinking glaciers, sea level rise, and increased levels of greenhouse gases. From 1880 to 2012, the global average temperature increased by 0.85 ∘C, and it was warmer in the most recent three decades than in any previous decade (IPCC, 2013). A climate model based on greenhouse gas emission is the basis for predicting future climate change. The Fifth Assessment Report of the IPCC presented a new generation of future climate change scenarios called Representative Concentration Pathways (RCPs) (IPCC, 2013). The rate of increase of the ground surface air temperature in China, over the past 100 years, is higher than the world average during this same period. There is a significant temperature increase in the inland areas of Northwest China, with the ground surface air temperature increasing by more than 0.5 ∘C since the 1980s (Zuo et al., 2004). The mean annual precipitation of China is 649 mm, while that in Northwest China it is only 161 mm. Due to the complex landscape, arid climate, and low vegetation coverage, Northwest China is relatively more vulnerable than other regions to climate change and this is likely to affect the agricultural productivity of the region (Wang, 2016).
The application of downscaling methods in predicting future climate change is an important approach used for studies on regional climate change (Chen et al., 2012; Hu et al., 2013). Downscaling methods can be divided into three types: dynamical downscaling, statistical downscaling, and mixed downscaling that combines both dynamical and statistical methods (Frey-Buness et al., 1995). Dynamical downscaling is time-consuming, requires a large computational load, and relies on boundary conditions provided by the general circulation model (GCM) (Fan et al., 2005). The mixed dynamical and statistical downscaling method is still in the exploratory stage. However, statistical downscaling requires a relatively small computational load. The model is easy to program and implement and operation of the model is less time-consuming. As such, statistical downscaling has been widely adopted (Chu et al., 2010; Huang et al., 2012; Samadi et al., 2013).
The Statistical Downscaling Model (SDSM) is a decision-making support tool developed by Wilby et al. (1999, 2002, 2003), which is used to study the impacts of regional and local climate change. Coupled with multiple regression and a weather generator, the model is easy to operate, and the statistically downscaled scenario could better evaluate the impacts of regional climate change than the scenario directly simulated by the GCM. Fan et al. (2007) found that the SDSM could effectively simulate the temperature in North China where future temperatures indicate a clear upward trend. Dai et al. (2015) demonstrated that the SDSM was highly accurate for monthly temperature simulation, but the simulated value of monthly precipitation exceeded the actual value. Hao et al. (2015) used SDSM to develop a downscaling forecast of the spatial and temporal variations of future temperature and precipitation in the Hexi Corridor. The daily minimum temperature, daily maximum temperature and daily mean temperature were found to be rising, with the increases of the maximum temperature and the mean temperature greater than that of the minimum temperature. The precipitation in the Hexi Corridor had strong regional characteristics, increasing in the western region and decreasing in the central and eastern regions. Xiong and Yan (2013) conducted dynamic downscaling using a high-resolution regional climate model in the Heihe River Basin (HRB). The model was able to simulate the annual and seasonal spatial distribution of precipitation in the HRB and annual variation of precipitation in different regions of this basin. However, the simulated values of oasis areas in the middle reaches of the HRB deviated more from the observed values than in other areas. Cao et al. (2008) conducted a study on corn output in the oasis irrigation areas of the Hexi Corridor indicating that the accumulated temperature in irrigated areas in the Hexi Corridor was significantly increased and associated with global warming. The active accumulated temperature during corn growth is a key factor affecting corn yield. As the climate in the irrigated areas warms, the corn yield in selected local areas has increased. The yield increases, from west to east, were 124, 186, and 301 %, respectively. Zhao et al. (2012) found that temperatures in the HRB increased significantly from 1960 to 2009. The increased temperatures affected the crop growth period, bringing both advantages and problems. There were increased yields of spring wheat, corn, and cotton, but higher pest population levels. Agriculture is significantly affected by climate change.
The arid inland area in Northwest China is an important producer of commodity grains and also a core area of the Silk Road Economic Belt. The HRB is the second largest inland river basin in the arid areas of Northwest China. The variation characteristics of water productivity of oasis in this area related to climate change are significant for the sustainable development of agriculture and the development of the One Belt One Road initiative. We integrated a multi-model adaptability evaluation method and the SDSM model, by using data from observation stations, GCMs, and ERA-40 reanalysis to generate multi-model climate change scenarios, which were used to drive the SWAP-EPIC model to simulate crop growth, and assess the response of water productivity of oasis to climate change.
2.1 Study area
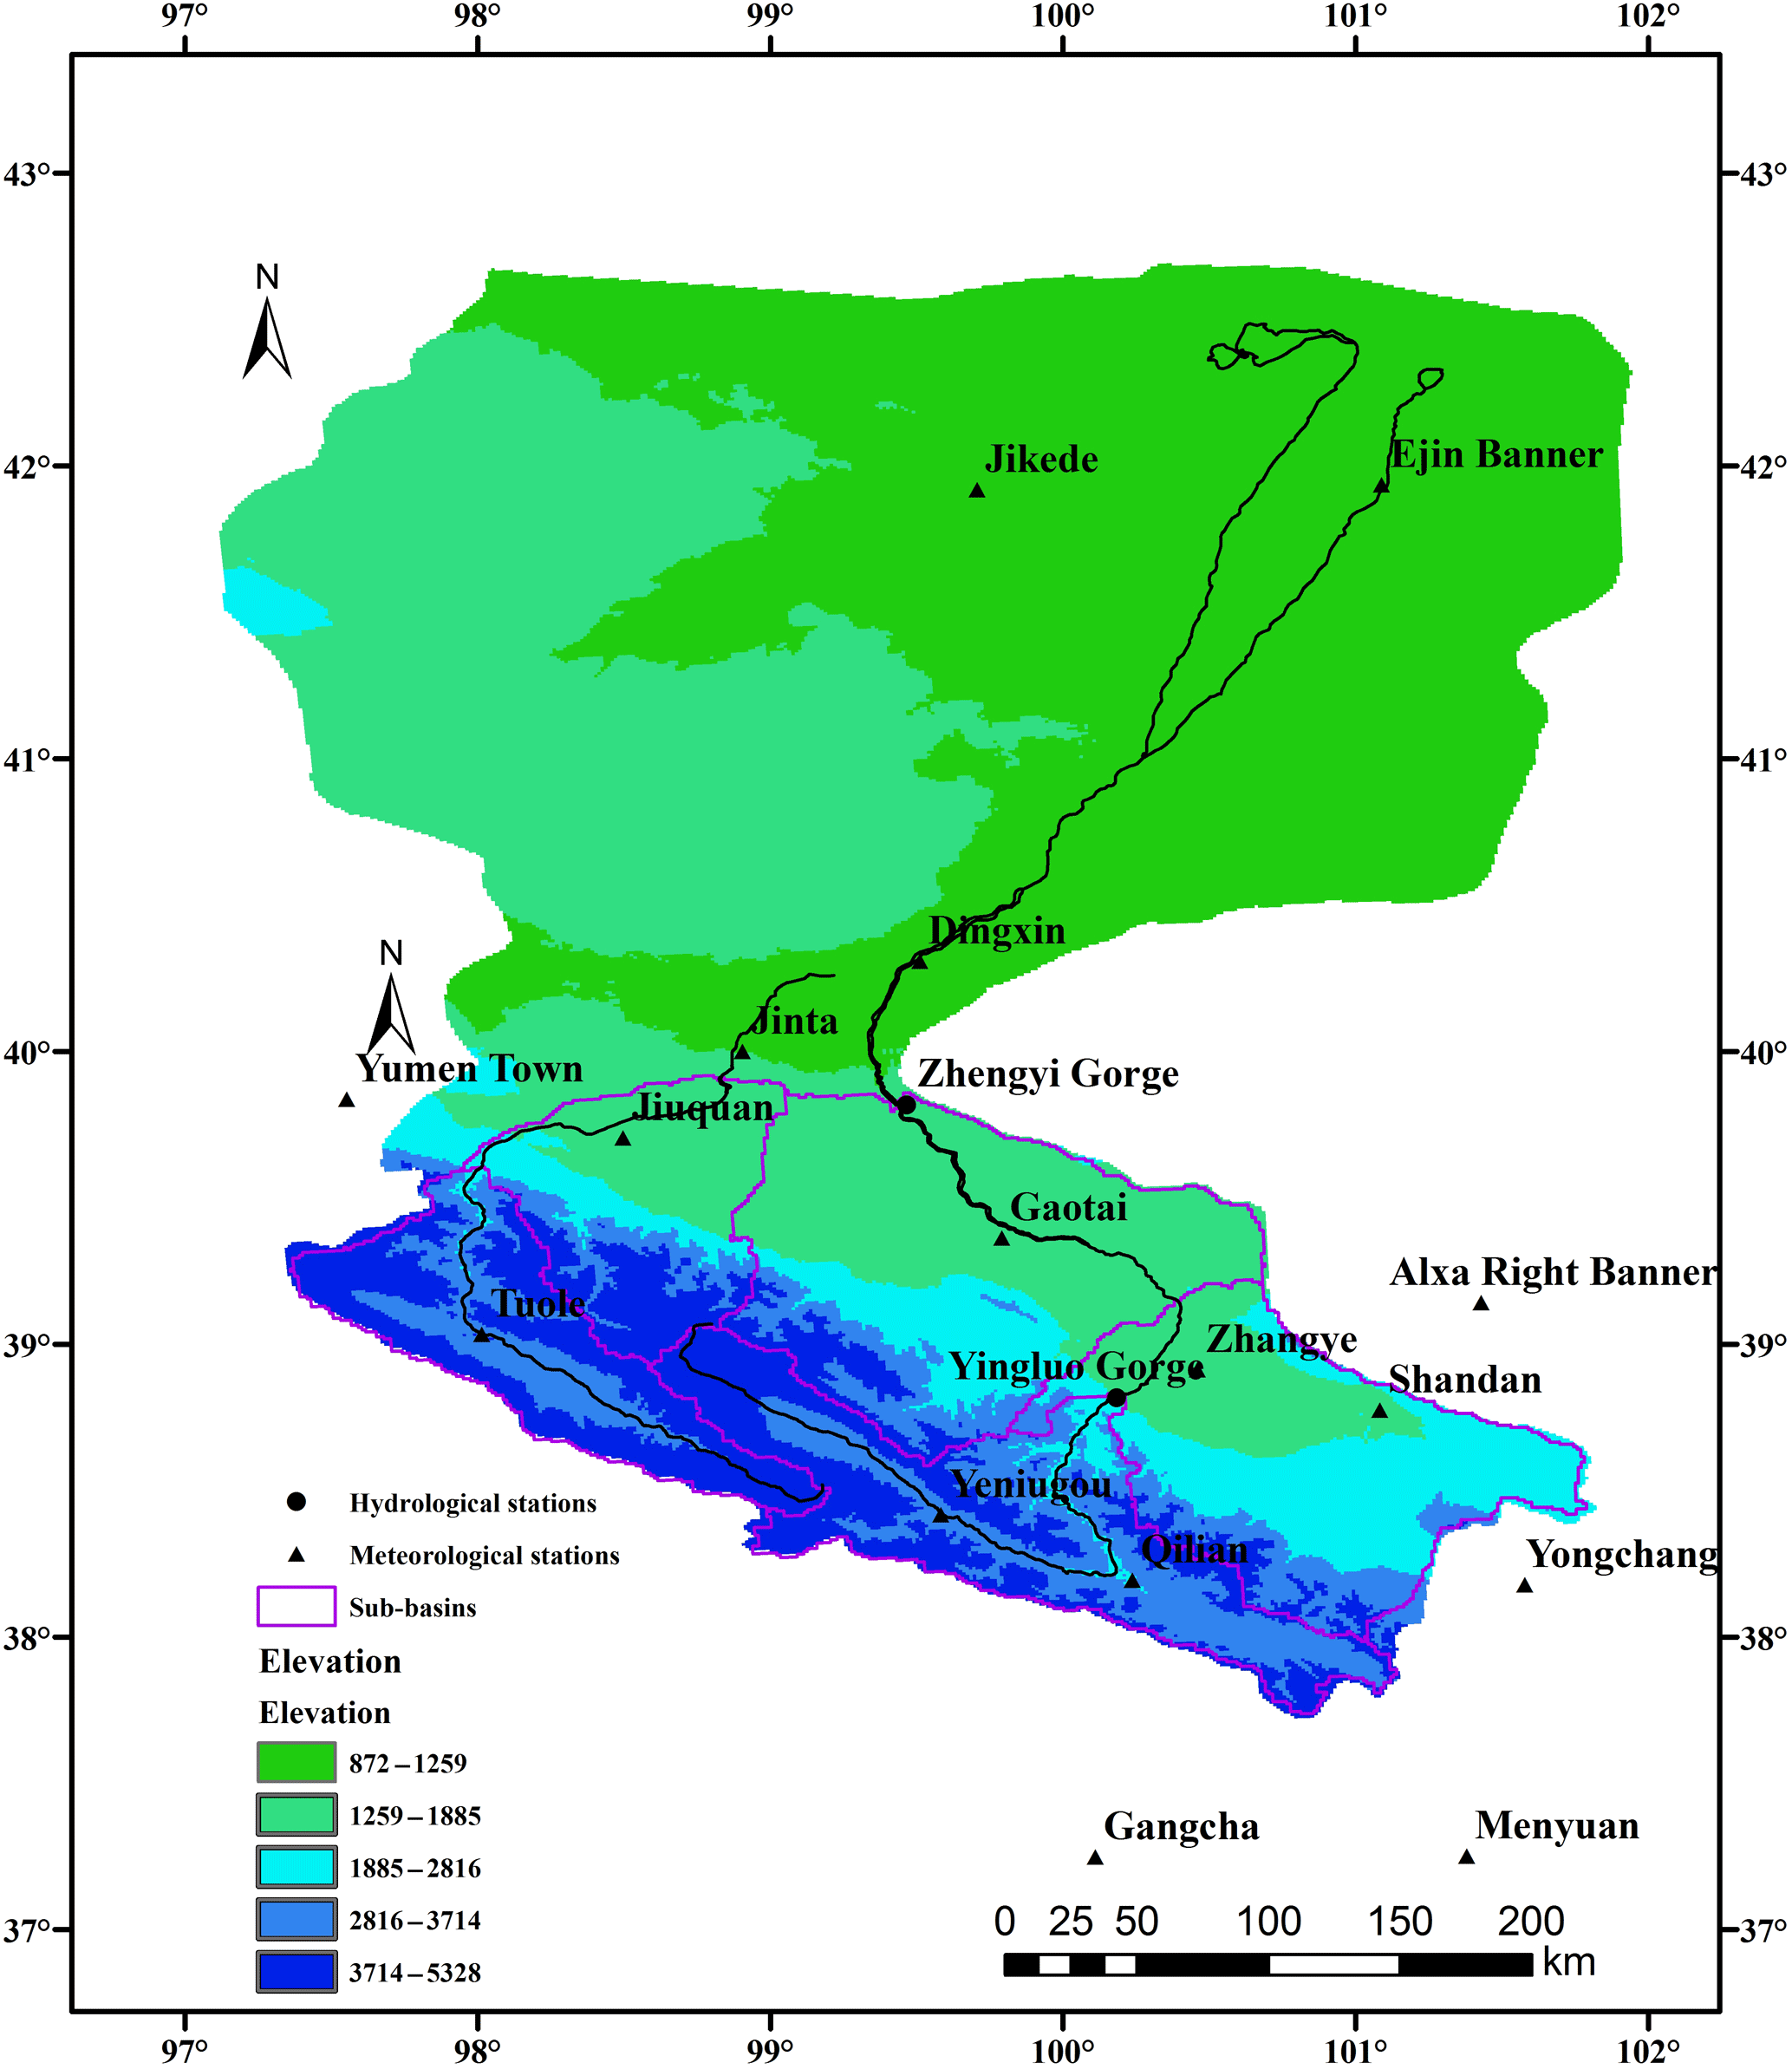
The Heihe River Basin is located in the arid interior area of Northwest China. It is the second largest inland river basin in China and is in the middle of the Hexi Corridor, located between 98–101.5∘ E and 38–42∘ N (Wang, 2016). The Heihe River originates in the northern Qilian Mountains and it is adjacent to the Shiyang River Basin in the east and the Shule River Basin in the west. With a total length of 821 km and covering a total area of 142 900 km2, the Heihe River area has an annual runoff of 1.58 billion m3 (Zhang et al., 2005; Jiang, 2013). The HRB is divided by the Yingluo Gorge and the Zhengyi Gorge into the upper, middle and lower reaches. Located above the Yingluo Gorge, the upper reaches form the major runoff producing area at an altitude of 1680–5280 m with a cold and humid climate. The middle reaches are located between the Yingshuo Gorge and the Zhengyi Gorge where the terrain is a mix of mountains and plains. With an elevation of 1300–1680 m, the middle reaches have a mean annual precipitation of 140 mm, evaporation of 141 mm, abundant light and heat resources, and well-developed agriculture. The middle reaches are the main water consumption area in the HRB. The lower reaches occur below the Zhengyi Gorge at elevations between 980–1300 m. The lower reaches are characterized by open terrain, dry climate, and sparse vegetation, and this is a main source of sandstorms in North China (Shen, 2006; Guo et al., 2011; Jiang, 2013; Zang and Liu, 2013).
2.2 Data
Data collected by the meteorological stations, the GCM data and the ERA-40 reanalysis data were the basic data used in this study.
-
Data collected by the meteorological stations included the daily precipitation, daily mean temperature, daily maximum temperature and daily minimum temperature. Data were collected by 17 meteorological stations from 1961 to 2000 in the Heihe River Basin (Fig. 1). The data were extracted from China Meteorological Data Service Center (CMDC) http://data.cma.cn/.
-
Meteorological data of 23 GCMs were selected from CMIP5 in CEDA (Center for Environmental Data Analysis), including monthly and daily data. The monthly data over the time span from 1961 to 2000 were used for the GCM adaptability evaluation and were uniformly interpolated to a 2∘ × 2∘ resolution. The daily data were used for statistical downscaling to generate the meteorological data of the baseline period and the future climate scenario data. The baseline period was from 1976 to 2005, and the future climate scenarios corresponded to the time period from 2018 to 2047, including the scenarios of three RCPs (RCP2.6, RCP4.5, and RCP8.5) (Wang et al., 2012). The selected GCMs and their source information refer to Guo (2017).
-
The reanalysis datasets have been widely used in climate change projections, such ERA-40 from the European Center for Medium-Range Weather Forecasts (ECMWF), NCEP (Nation Centers for Environmental Prediction), however the reliability of the datasets at different time-spatial scales shows significant differences. In China, especially in the western part, the reliability of the ERA-40 is higher than the NCEP and other reanalysis datasets (Zhao and Fu, 2006; Chao, 2011; Xie et al., 2011). In this study, ERA-40 reanalysis monthly and daily data from 1961 to 2000 were downloaded from the ECMWF (http://apps.ecmwf.int/datasets/data/era40-daily/levtype=sfc/), with the meteorological elements being the same as the large-scale predictors of the GCM at a 2∘ × 2∘ resolution.
2.3 Methodology
2.3.1 Multi-model adaptability evaluation
The GCM is the most feasible current method for predicting large-scale climate changes. However, due to the differences between each GCM in resolution, initial conditions, and mechanisms, the results have significant uncertainty (Cox and Stephenson, 2007). There are large differences between the simulation results of different GCM models, and the accuracy of simulation results is closely related to the simulated area and the simulated climate variables (Jiang et al., 2011; Johnson and Sharma, 2012; Liu et al., 2013). Therefore, before GCM data are used to study regional climate changes, it is necessary to conduct an adaptability evaluation on the simulation ability of each GCM model in the study area and then select the GCM model that is best adapted to the study area.
The rank scoring method is advantageous because it evaluates the GCM with multiple criteria, and rank scoring has been effectively used in the adaptability evaluation of multiple regions (Rosenberg et al., 2010; Liu et al., 2011; Chen et al., 2018). In this study, the rank scoring method was used as the evaluation method. First, the monthly data of 23 GCMs in CMIP5 from 1961 to 2000 were selected, and the GCM output data were uniformly interpolated to a grid of resolution. The monthly precipitation, monthly mean temperature, monthly maximum temperature and monthly minimum temperature data collected by 17 meteorological stations in the Heihe River Basin were selected as the observation data. A total of 11 statistical eigenvalues of the 23 GCMs and the measured data were compared to evaluate the applicability of the GCM in this area and to select the optimal GCM for each climate variable.
The method was calculated as follows:
where i is the model number, Xi denotes the relative error between the simulated value and the measured value for a statistical characteristic, and Xmin and Xmax represent the minimum and maximum relative error, respectively. The smaller the Xi, the larger the Rs.
2.3.2 SDSM
SDSM is a statistical downscaling model coupled with multiple regression and a weather generator. It is easy to operate and is widely applied in the downscaling of regional climate changes (Fan et al., 2007). The main content of the SDSM includes two aspects (Yin et al., 2010): First, build the statistical relationship between the predictand (the climatic elements of the stations) and the predictor (atmospheric circulation factor), and then determine the model. Second, assemble the future sequence data of the climatic elements based on the determined model.
The relationship between a predictand and a predictor can be expressed as:
where R is the predictand, L is the predictor, and F denotes a deterministic or random function.
The predictand should be selected according to the study aim, and the selection of a predictor should abide by the following principles (Liu et al., 2008): it must be a factor existing in both the measured data and the GCM data; it must be a factor that can be accurately simulated by the GCM; and it must have a physical connection with the predictand.
After the predictors are screened, the SDSM will establish a statistical relationship according to the selected predictors and predictand and then determine the parameters of the multiple regression equation using the effective dual simplex method. This involves calibration of the model (Yin et al., 2010; Liu et al., 2011). After the model is determined, future climate scenarios output by the GCM can be used to simulate future data of the stations' climatic elements and compare these with the climatic elements in the baseline period. This allows analysis of the future variation trend of climatic elements in the study area (Liu et al., 2008; Yin et al., 2010).
2.3.3 The SWAP-EPIC model
The soil water atmosphere plant (SWAP) model consists of sub-modules such as soil water movement, solute transport, heat transfer, soil evaporation, crop transpiration, and crop growth. Each of the sub-modules influence and interact with each other. The model is mainly used to simulate water and salt transport and crop growth at a farmland scale (Xu, 2006). The environmental policy integrated climate (EPIC) model mainly includes crop growth, hydrology, soil temperature, soil erosion, and nutrient cycling (Fan et al., 2012).
The simple crop module of the SWAP model cannot directly simulate the growth process and yield of crops and so it is necessary to manually input observation data of crop growth, which will then be used in the interactive computations with water and salt transport. The detailed crop growth module WOFOST is complex and requires so many observational data and empirical parameters that the application scope of the model is limited. Therefore, Xu et al. (2013) constructed an SWAP-EPIC model that achieved the improved coupling simulation of soil water and salt dynamic and crop growth at a farmland scale.
3.1 CMIP5 multi-model adaptability evaluation
Figure 2 shows the evaluation results of the 23 GCMs indicating their influences on the precipitation, mean temperature, maximum temperature, and minimum temperature. The GCMs with the optimal overall simulation effects were CNRM-CM5, CCSM4, MPI-ESM-LR, and BCC-CSM1-1-M. There were significant differences between the simulation effects of the 23 GCMs on precipitation. The Rs scores of all the GCMs were above 5.0 in terms of mean temperature simulation, implying good simulation effects. The Rs score of the maximum temperature and the minimum temperature ranged from 3.43–6.33 and 3.32–6.93, respectively. CCSM4 (8.55) had the best simulation effect for mean temperature, however MPM-ESM-MR (8.28) was finally selected as the downscaling GCM due to its more sufficient data series. Therefore, CNRM-CM5, MPI-ESM-MR, MPI-ESM-LR, and BCC-CSM1-1-M were selected as the GCMs to construct the future scenarios of precipitation, mean temperature, maximum temperature, and minimum temperature, respectively, in the Heihe River Basin.
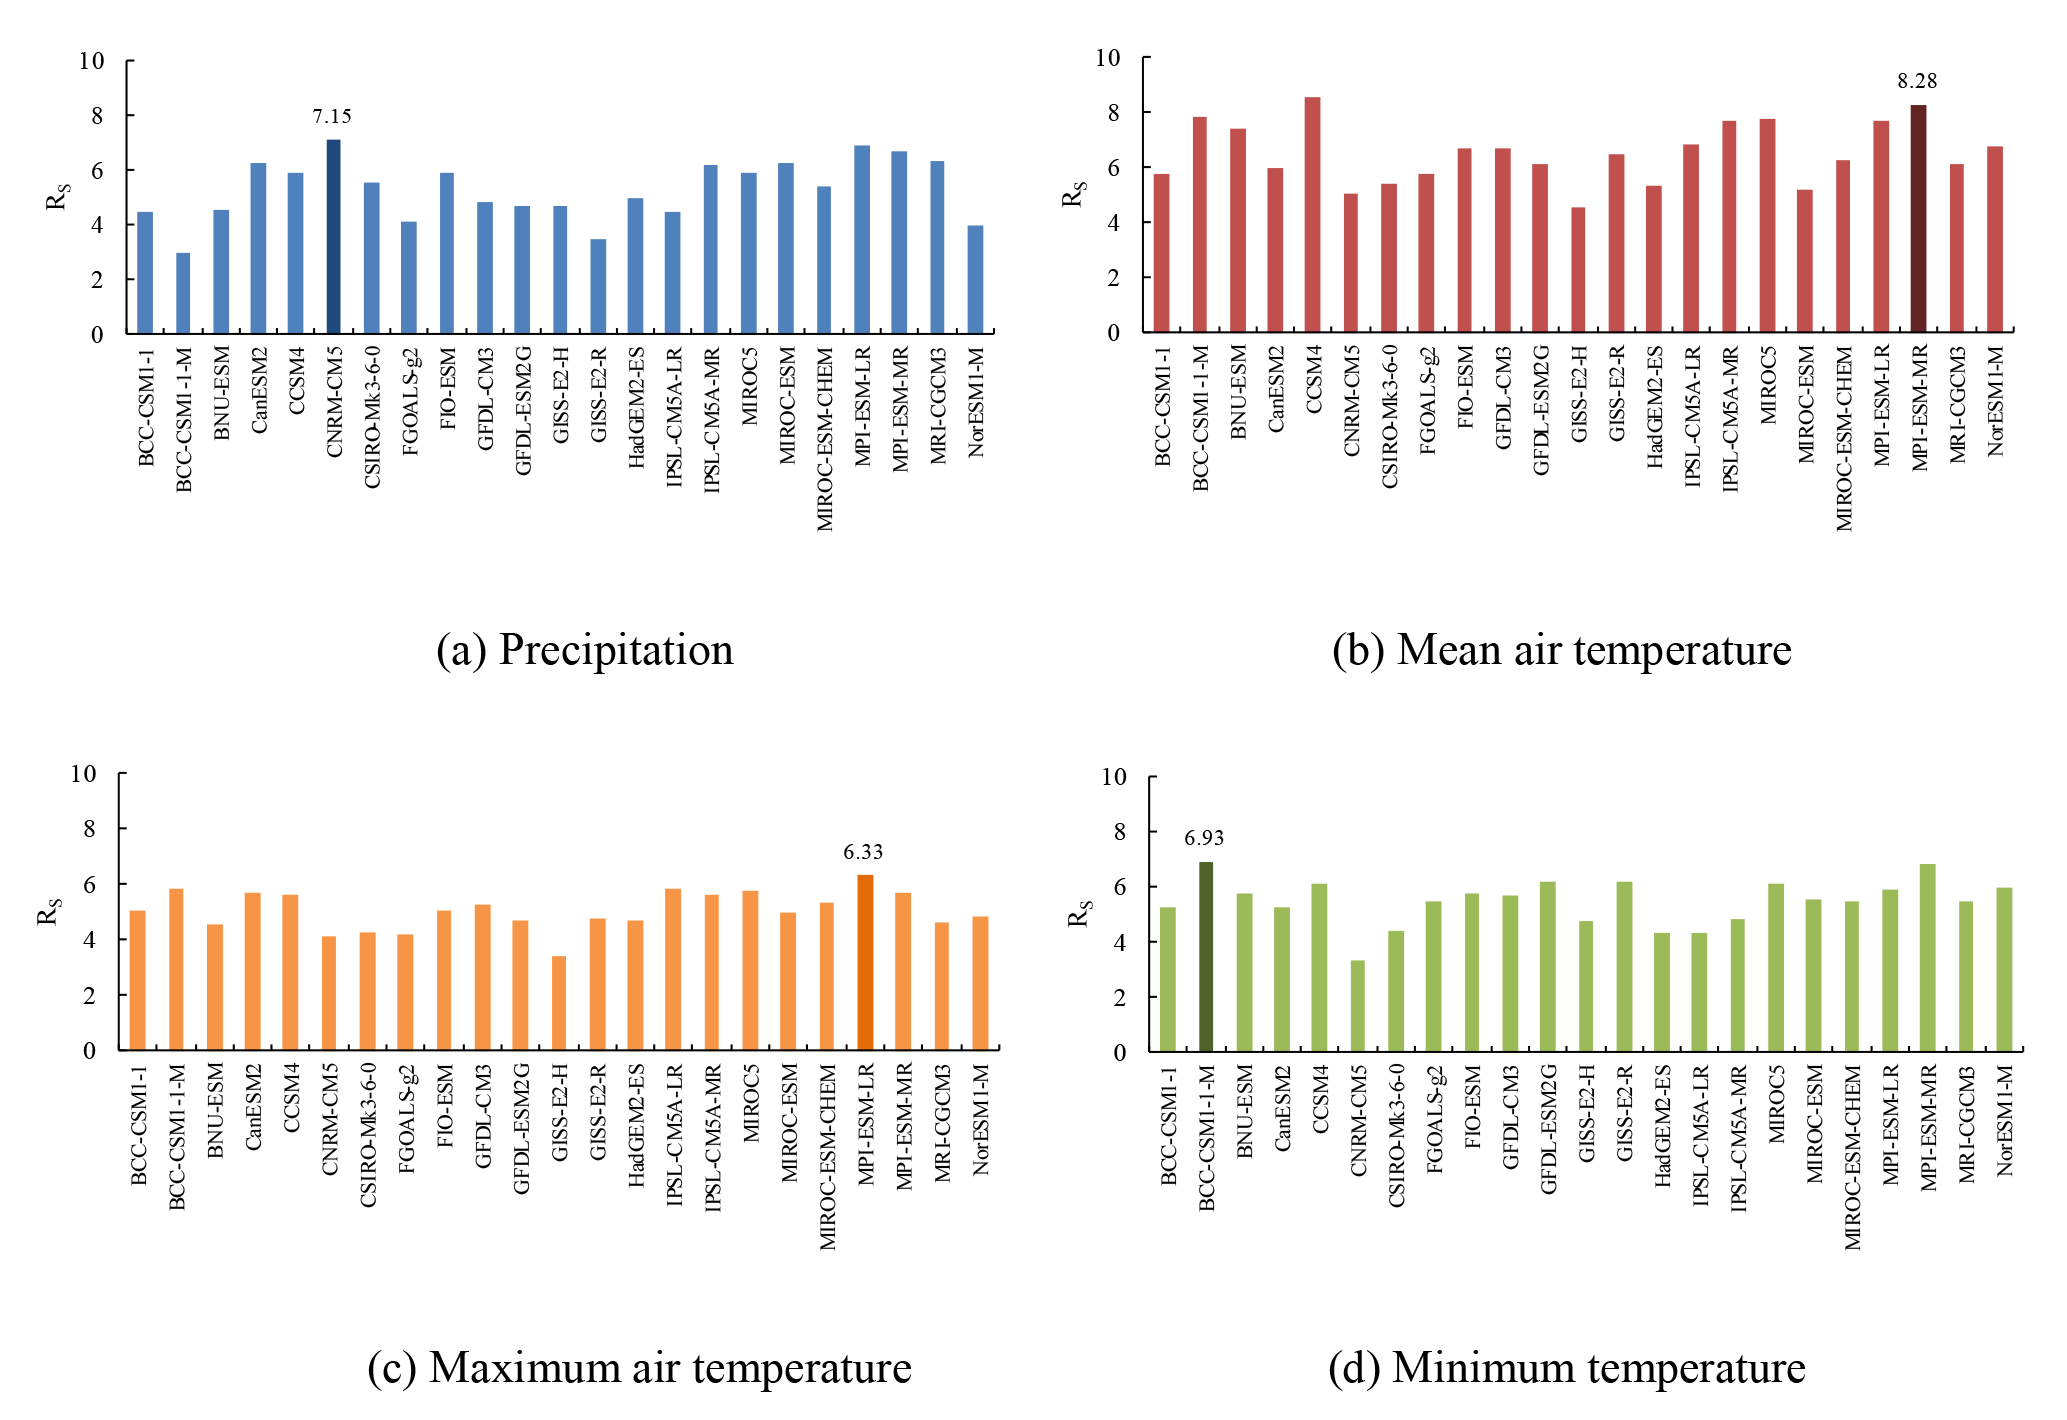
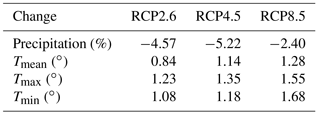
Table 1Changes of precipitation and air temperature during the future 30 years under RCP scenarios.
3.2 Construction of multi-model climate change scenarios
Table 1 shows the variation of precipitation compared to the baseline period in the HRB in the three future climate scenarios. According to the table, the precipitation in the future tends to decrease overall with the decrease being especially obvious in the RCP4.5 scenario, reaching 5.22 %.
The mean air temperature in the three future climate scenarios showed an increasing trend compared with that in the baseline period, and the temperature rise was more prominent as the RCP increased. The temperature rise, ranked from high to low, was RCP8.5 > RCP4.5 > RCP2.6. In the RCP4.5 and RCP8.5 scenarios, mean air temperature generally increased above 1 ∘C, while in the RCP2.6 scenario, the temperature increased within 1 ∘C. The temperature in RCP2.6, RCP4.5 and RCP8.5 increased by 0.84, 1.14, and 1.28 ∘C, respectively compared with the baseline period.
From the perspective of the entire basin, Table 1 shows the increase in the mean annual maximum temperature in the entire basin. The maximum temperature in the three RCP scenarios increased by 1.23, 1.35, and 1.55 ∘C, compared with the baseline period, which was more prominent than the increase in the mean annual temperature. The minimum temperature in the three RCP scenarios increased by 1.08, 1.18, and 1.68 ∘C compared with the baseline period.
3.3 Assessment of water productivity under climate change
3.3.1 Crop growth modeling
The SWAP-EPIC model driven by future climate scenario data was used to simulate corn growth in the scenario of RCP2.6, RCP4.5, and RCP8.5, and to obtain the yield and crop water consumption (CWC) ETa of corn in Gaotai and Ganzhou. The SWAT-EPIC model parameters were based in the calibration and validation results of Jiang (2013) and Jiang et al. (2015) for oasis in the middle reaches of the HRB. The mean annual yield and CWC of corn growing in Gaotai in the three future climate scenarios varied from the 2012 to 2015 data (Fig. 3). The mean annual corn yield in all three future climate scenarios had a decreasing trend, and the amount of decrease ranked from high to low as P2.6 (−5.22 %) > RCP4.5 (−2.44 %) > RCP8.5 (−1.66 %). The mean annual CWC was also had a decreasing trend, and the decrease was above 12 % for all scenarios, with the highest decrease being 14.73 % in RCP4.5.
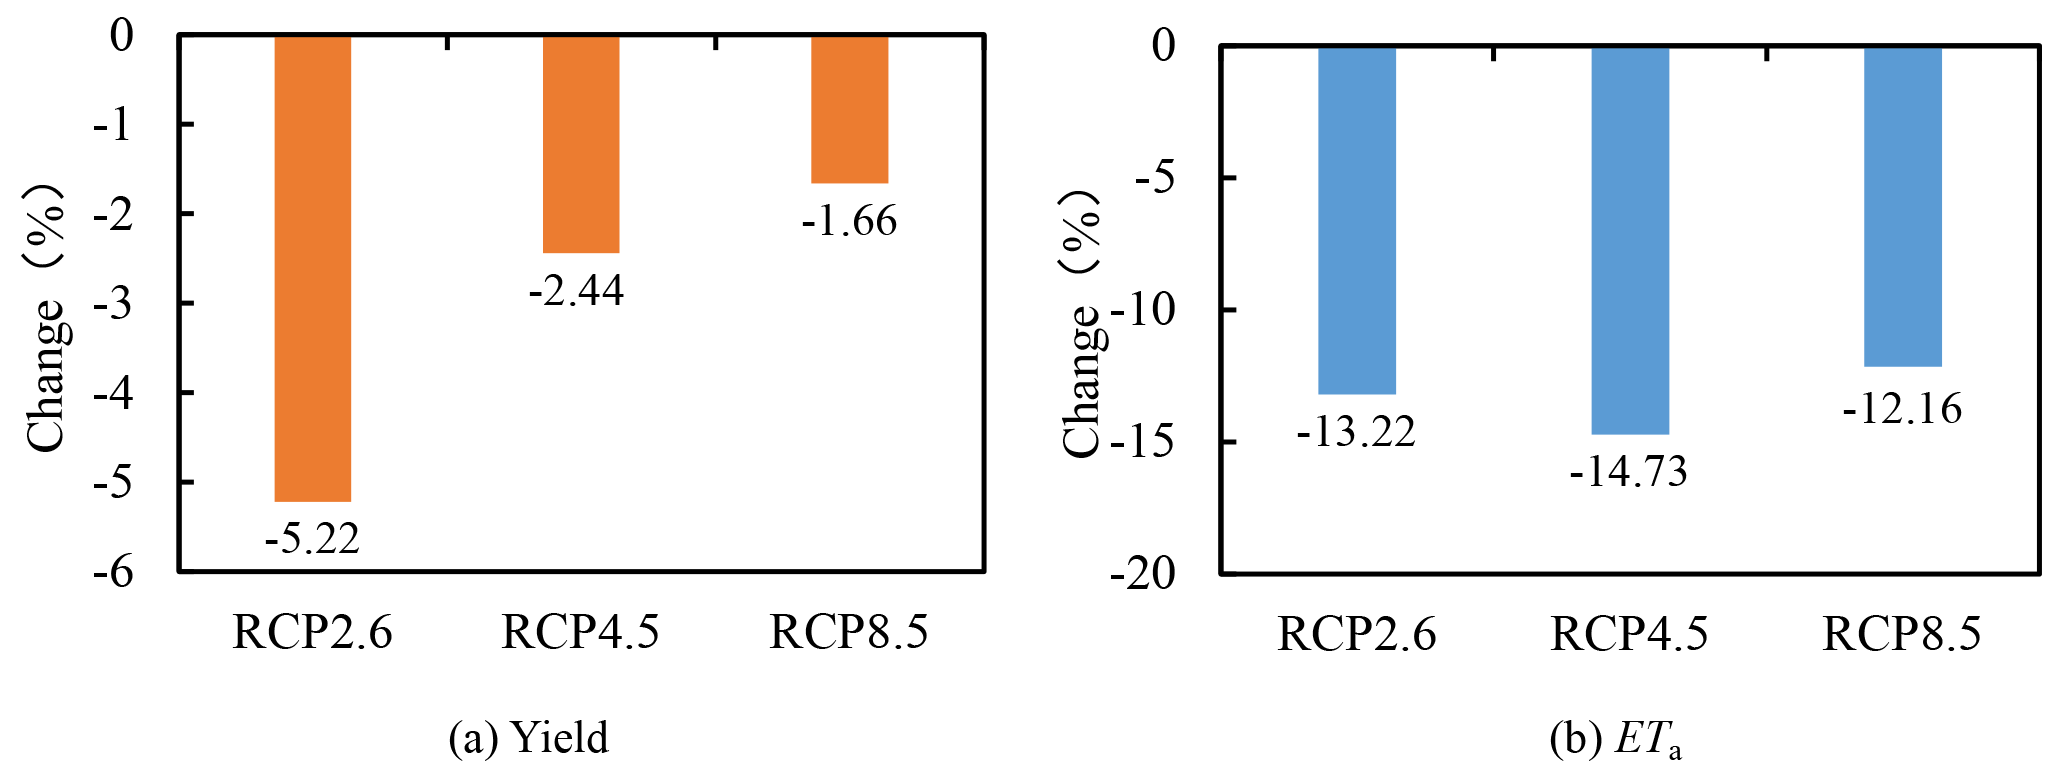
Figure 4 shows the interannual variation trend of future yield and the CWC of corn in Gaotai. In future climate scenarios, the corn yield in Gaotai featured a wavelike rise, and there were no significant differences between the three scenarios from an interannual perspective. In 2021, there was a projected dramatic increase in the yield and a projected large decrease in 2036. The CWC of corn in the three future climate scenarios did not increase or decrease significantly, showing fluctuating changes.
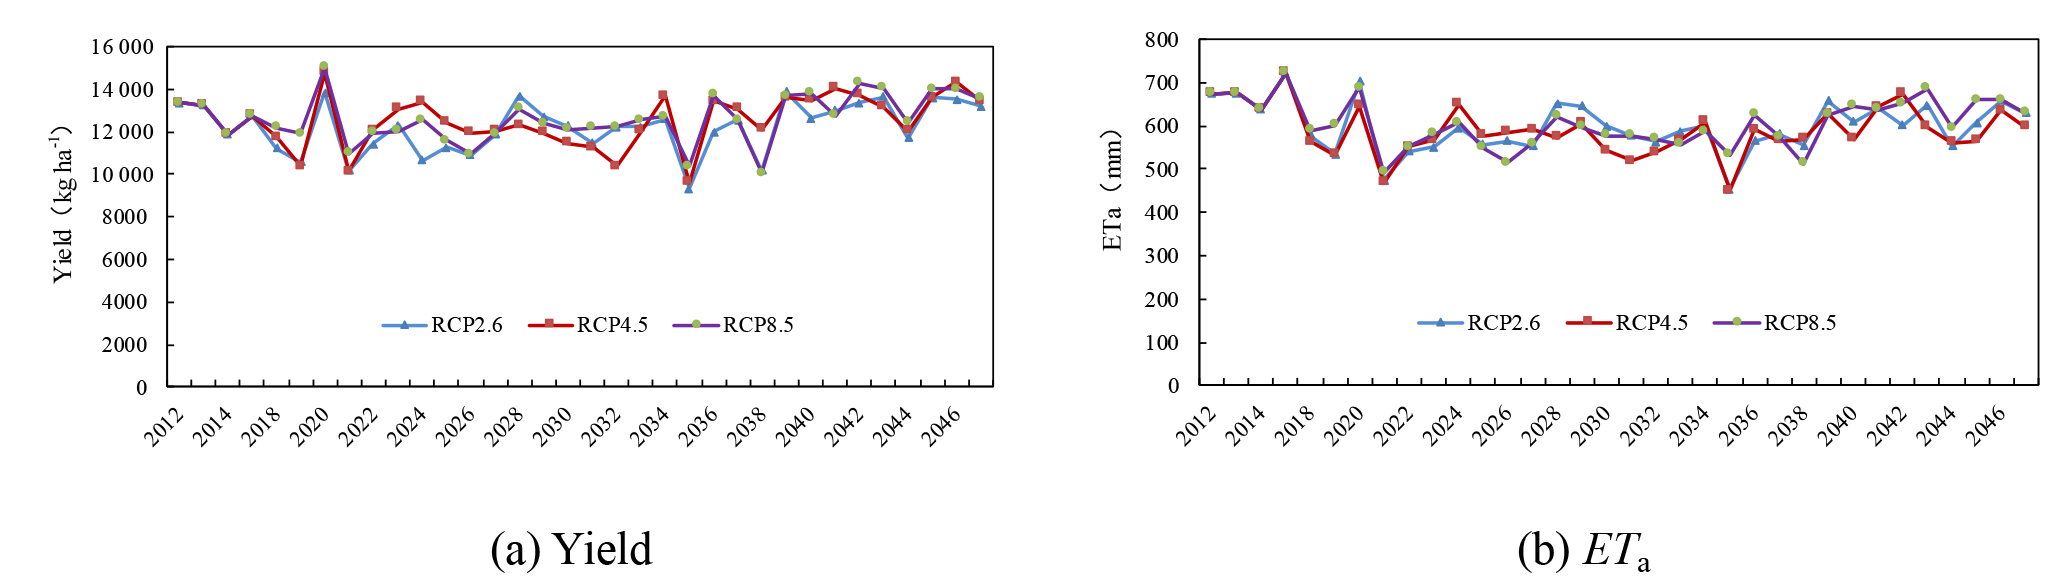
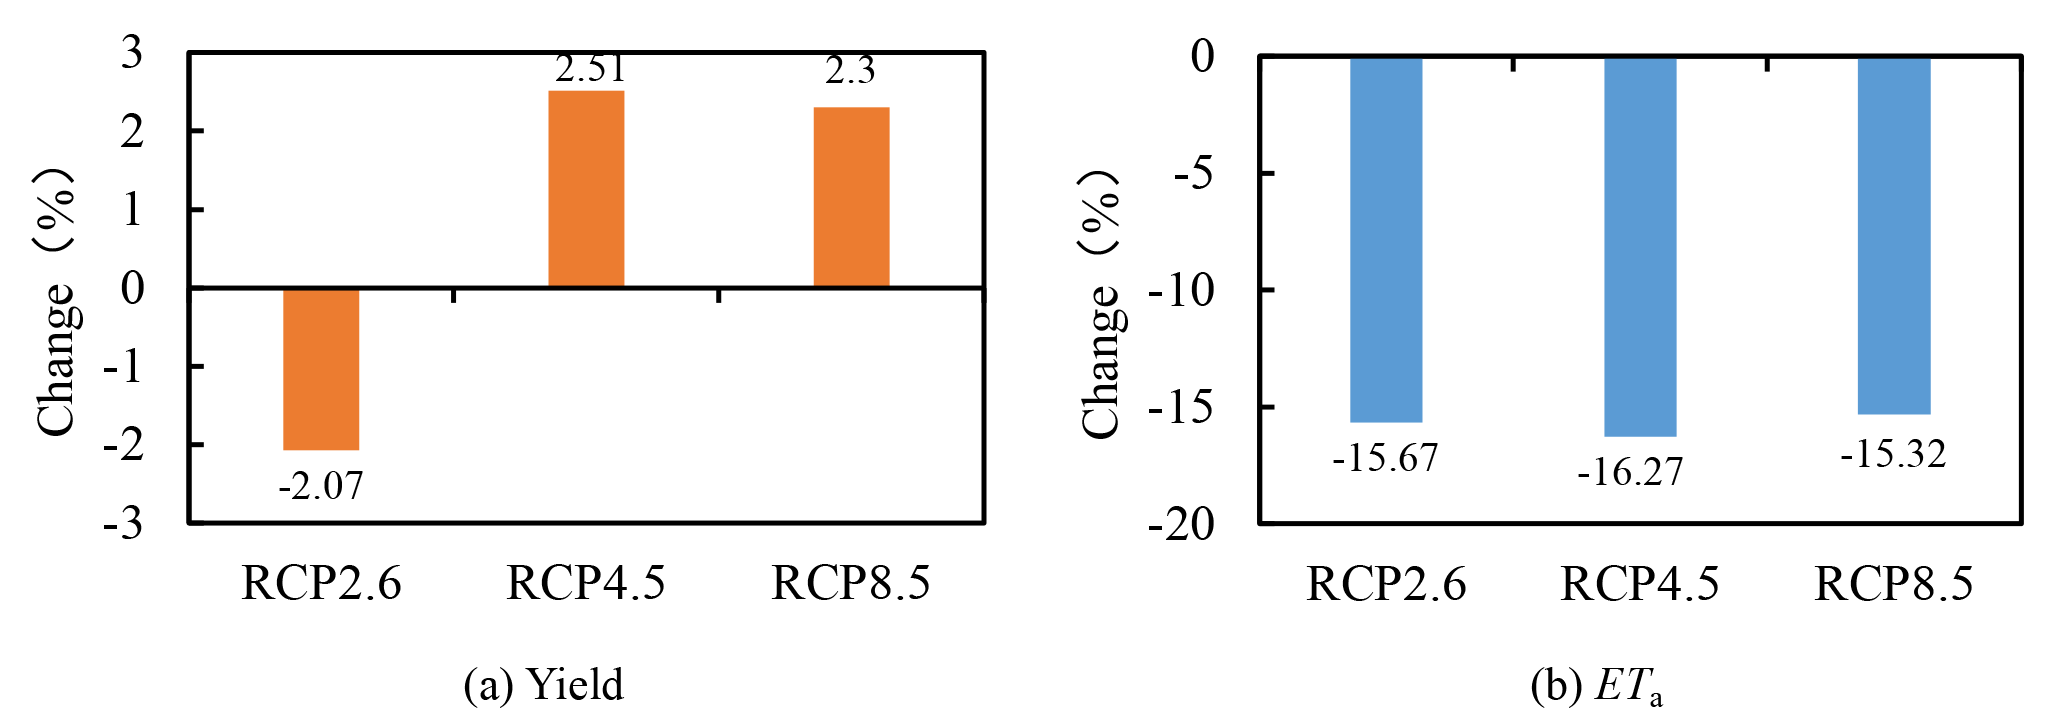
Figure 5 shows inter-decadal variation and the mean annual yield and CWC of corn growing in Gaotai in the three future climate scenarios compared to 2012 to 2015 data. The mean annual corn yield in the RCP2.6 scenario had a decreasing trend. However, in RCP4.5 and RCP8.5, the corn yield increased by 2.51 and 2.3 %, respectively. The mean annual CWC had a decreasing trend in all three future climate scenarios, and the amount of decrease was similar, ranking, from high to low, as RCP4.5 (−16.27 %) > RCP2.6 (−15.67 %) > RCP8.5 (−15.32 %).
Figure 6 shows the interannual variation trend of the yield and CWC of corn in Ganzhou. The corn yield in Ganzhou had a fluctuating rise in the future; there were no significant differences between the three scenarios from an interannual perspective, but the overall increase was greater than that of Gaotai. In 2018 and 2021, the yield was predicted to be relatively high, but it would decrease greatly in 2038. The CWC in the three future climate scenarios would generally fluctuate. Compared with the CWC from 2012 to 2015, the CWC in the future would first decrease and gradually show a fluctuating increase from 2022 on. However, the final CWC would remain lower than that from 2012 to 2015.

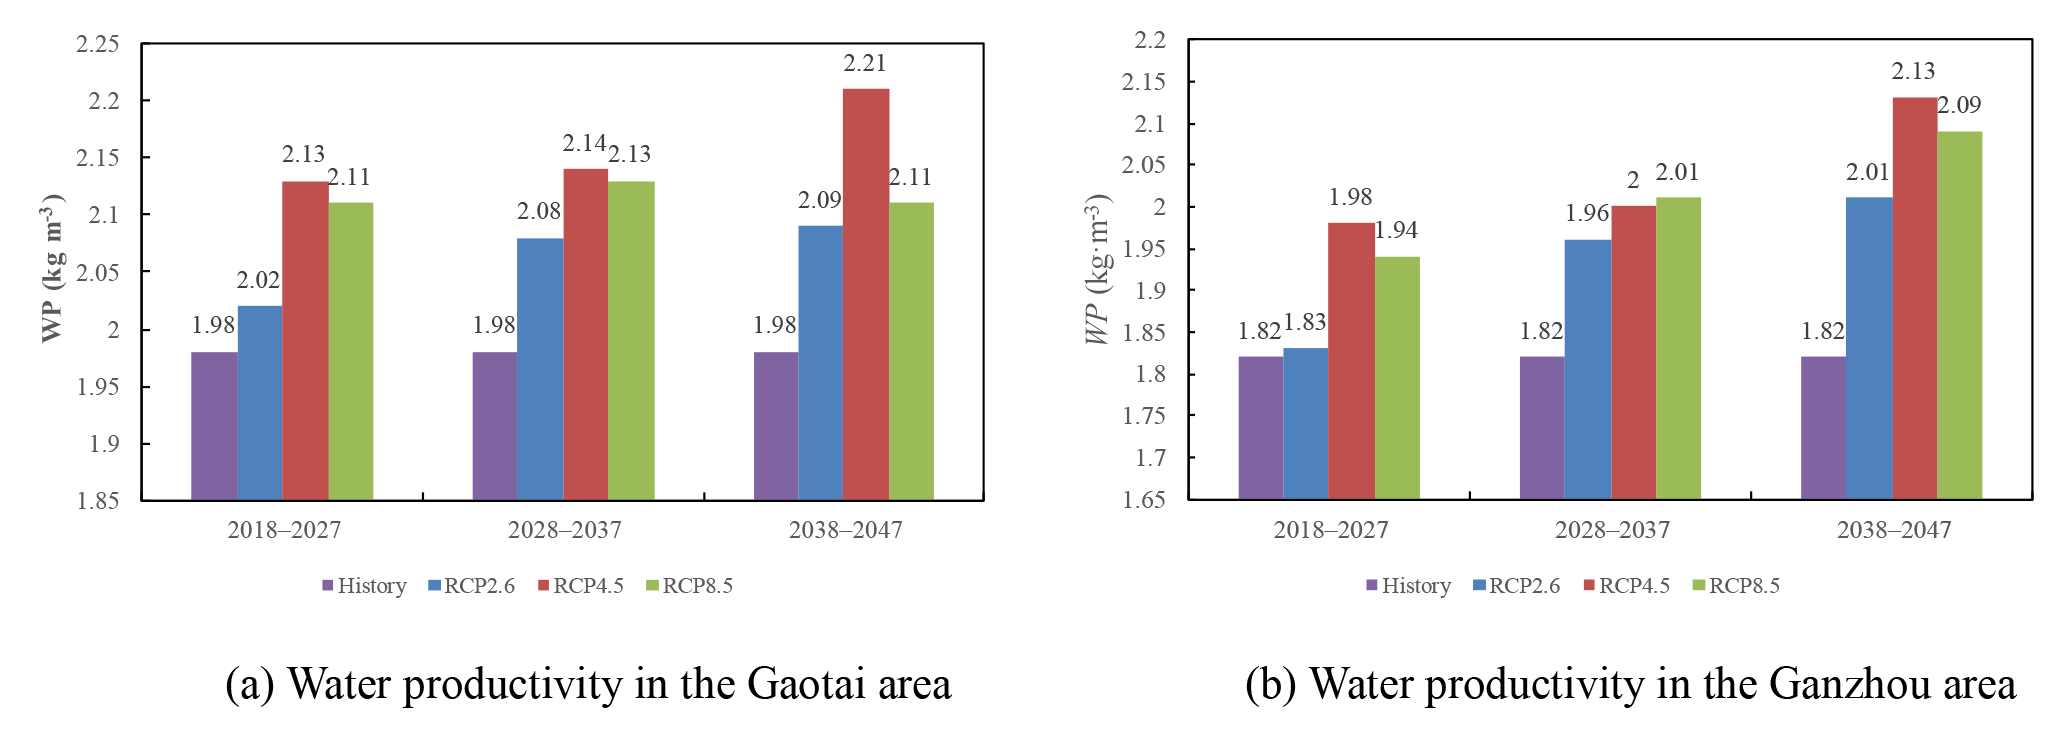
Figure 7Decadal changes of corn water productivity in the middle agricultural region of the HRB under RCP scenarios.
3.3.2 Water productivity evaluation
Water productivity (WP) refers to the yield or output value obtained from per unit water resources on specific crops and under specific cultivation conditions. With the unit being kg m−3, water productivity is mainly used to reflect the water management level or evaluate the farmland water use efficiency in an irrigated area. It can be calculated by the following equation:
where Y is crop grain yield (kg ha−1), ETa is the CWC during the crop growth period (crop transpiration + inter-plant evaporation) (mm).
The inter-decadal water productivity of Gaotai and Ganzhou is shown in Fig. 7. As the RCP increased, the mean temperature, maximum temperature, and minimum temperature increased, the wind speed and precipitation decreased, and the water productivity of the two locations increased. The inter-decadal water productivity in all the three future climate scenarios is higher than in the historical simulation series (2012–2015). Among them, the increase of the water productivity in the RCP4.5 scenario was the greatest. Water productivity became higher over time, which was associated with the temperature rise. In addition, increase in the maximum temperature was clearly greater than that of the minimum temperature, which led to an increase in accumulated temperature and promoted crop growth.
Figure 8 shows the variation trend of the annual water productivity in both Gaotai and Ganzhou. In the three future climate scenarios, the water productivity had an upward trend and the increase ranked, high to low, as RCP4.5 > RCP8.5 > RCP2.6. There was a decrease in the water productivity of both Gaotai and Ganzhou in 2038, and as analyzed above, the temperature, yield and CWC decreased in the same year. Therefore, the water productivity also decreased in this year. The overall growth trend in Ganzhou was higher than that in Gaotai, and the two places were similar to each other in the fluctuation trend.
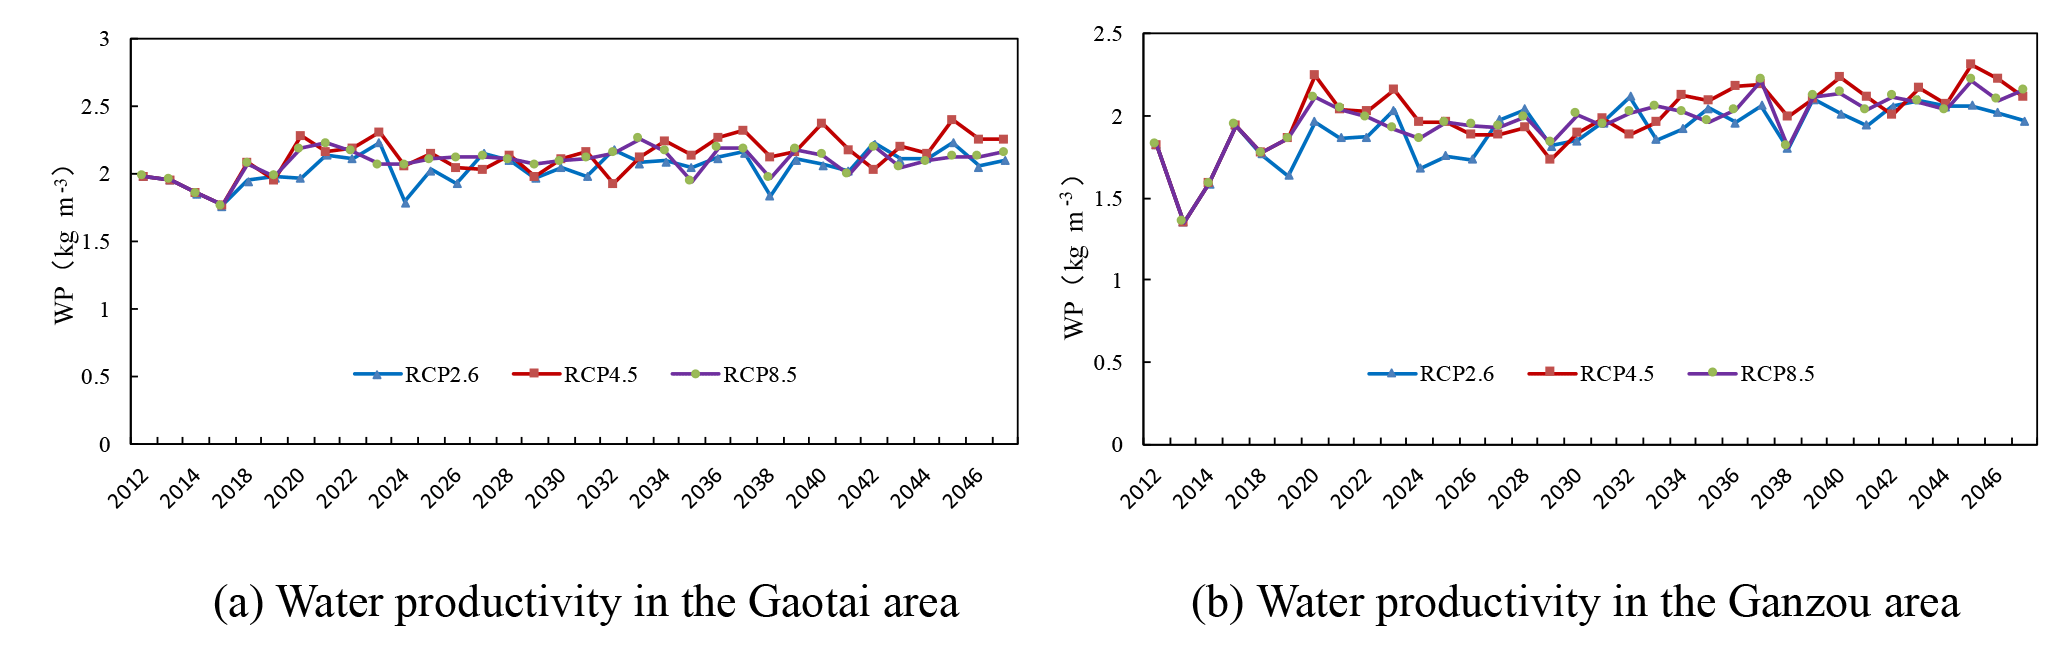
Figure 8Temporal variations of corn water productivity in the middle agricultural region of the HRB under RCP scenarios.
The Heihe River Basin was selected as the typical area representing the agricultural oasis of the Hexi Corridor and the Silk Road Economic Belt in this study. Based on observed data at 17 meteorological stations, 23 GCMs and ERA-40 reanalysis data, the SDSM was employed to complete a downscaling projection of climate change during the baseline period and three future climate scenarios, namely RCP2.6, RCP4.5 and RCP8.5. The SWAP-EPIC model was combined to simulate corn growth in the Gaotai and Ganzhou areas located in the middle agricultural region of the HRB to obtain crop yields and CWC data under future climate change scenarios, investigating the responses of water productivity. Conclusions are as follows:
-
The SDSM carried out downscaling on the multi-GCM data and generated data on the three future climate scenarios. Precipitation in the future scenarios had decreasing trends compared to the baseline period, and the precipitation decrease in RCP4.5 was greater than that in RCP2.6 and RCP8.5. The mean, maximum, and minimum temperatures all had upward trends, and as the RCP increased, the temperature rise also increased with RCP8.5 > RCP4.5 > RCP2.6. The increase in the maximum temperature was greater than that in the mean temperature and minimum temperature.
-
The SWAP-EPIC model was used to simulate the corn growth in Gaotai and Ganzhou, and explore the variation patterns of the yield, CWC and water productivity under different climate change scenarios. The water productivity of the two locations showed an upward trend in the next three decades, and the water productivity in both Gaotai and Ganzhou increased the greatest in the RCP4.5, exceeding 2 kg m−3 in most of the years. Therefore, in Gaotai and Ganzhou, located in the middle oasis of the Heihe River Basin, the water productivity of corn gradually increased as the temperature increased and precipitation and wind speed decreased.
Located in the inland of Northwest China, the Heihe River Basin has an arid climate, so agricultural production mainly depends on timely irrigation. Therefore, the decreased precipitation had little effect on crop growth, while temperature rise caused an increase of accumulated temperature, which in turn promoted the growth of corn and increased corn yield and the increase of water productivity.
The meteorological data of observation stations were provided by China Meteorological Data Service Center (http://data.cma.cn/). ERA-40 reanalysis monthly and daily data were downloaded from the ECMWF (http://apps.ecmwf.int/datasets/data/era40-daily/levtype=sfc/). 23 GCMs outputs were released by the World Climate Research Programme's Working Group on Coupled Modelling (http://cmip-pcmdi.llnl.gov/cmip5/index.html). All above data used in this study were reproduced by Guo (2017).
The authors declare that they have no conflict of interest.
This article is part of the special issue “Innovative water resources management – understanding and balancing interactions between humankind and nature”. It is a result of the 8th International Water Resources Management Conference of ICWRS, Beijing, China, 13–15 June 2018.
This work was financially supported by the National Key
R&D Program of China (2017YFC0403201) and the National Natural Sciences
Foundation of China (91425302). The authors are grateful to the Data Center
of the Heihe Research Program (http://westdc.westgis.ac.cn/heihe), the World
Climate Research Programme's Working Group on Coupled Modelling, which is
responsible for CMIP, and the climate modeling groups for producing and
making available their model output
(http://cmip-pcmdi.llnl.gov/cmip5/index.html). The authors thank the editor
and two anonymous reviewers for their constructive comments that have
significantly improved this work.
Edited by: Bo Pang
Reviewed by: two anonymous referees
Cao, L., Deng, Z. Y., Dou, Y. X., and Yang, X. L.: Influence of climate waring on corn output in Hexi corridor oasis irrigation area and its countermeasure research, Acta Botanica Boreali-Occidentalia Sinica, 28, 1043–1048, 2008.
Chao, Z. H.: The reliability evaluation of three reanalysis air temperature data in West China, Transactions of Atmospheric Sciences, 34, 162–169, 2011.
Chen, H., Xu, C. Y., and Guo, S. L.: Comparison and evaluation of multiple GCMs, statistical downscaling and hydrological models in the study of climate change impacts on runoff, J. Hydrol., 434–435, 36–45, 2012.
Chen, J., Chen, H., and Guo, S. L.: Multi-site precipitation downscaling using a stochastic weather generator, Clim. Dynam., 50, 1975–1992, 2018.
Chu, J. T., Xia, J., Xu, C. Y., and Singh, V. P.: Statistical downscaling of daily mean temperature, pan evaporation and precipitation for climate change scenarios in Haihe River, China, Theor. Appl. Climatol., 99, 149–161, 2010.
Cox, P. and Stephenson, D.: A Changing Climate for Prediction, Science, 317, 207–208, 2007.
Dai, H. H., Yang, H. B., and Hu, Q. F.: Prediction of climate change over Shule River basin based on a statistical downscaling method, Hydro-Science and Engineering, 5, 46–53, 2015.
Fan, L. J., Fu, C. B., and Chen, D. L.: Review on creating future climate change scenarios by statistical downscaling techniques, Advances in Earth Science, 20, 320–329, 2005.
Fan, L. J., Fu, C. B., and Chen, D. L.: Estimation of local temperature change scenarios in North China using statistical downscaling method, Chinese Journal of Atmospheric Sciences, 31, 887–897, 2007.
Fan, L., Lv, C. H., and Chen, C.: A review of EPIC model and its applications, Prog. Geogr., 31, 584–592, 2012.
Frey-Buness, F., Heimann, D., and Sausen, R.: A statistical-dynamical downscaling procedure for global climate simulations, Theor. Appl. Climatol., 50, 117–131, 1995.
Guo, Q. L., Yang, Y. S., Chang, X. S., and Chen, Z. H.: Annual variation of Heihe River runoff during 1957–2008, Progress in Geography, 30, 550–556, 2011.
Guo, Z. Z.: Evaluation of water productivity in irrigated areas of the middle Heihe River basin under climate change, M.S. thesis, College of Water Resources and Civil Engineering, China Agricultural University, Beijing, China, 2017.
Hao, L. N., Su, X. L., and Wang, N.: Future spatial and temporal changes of temperature and precipitation in Hexi corridor based on SDSM, Journal of Northwest A&F University (Nat. Sci. Ed.), 43, 219–228, 2015.
Hu, Y., Maskey, S., and Uhlenbrook, S.: Downscaling daily precipitation over the Yellow River source region in China: a comparison of three statistical downscaling methods, Theor. Appl. Climatol., 112, 447–460, 2013.
Huang, J., Zhang, J., Zhang, Z., Sun, S., and Yao, J.: Simulation of extreme precipitation indices in the Yangtze River basin by using statistical downscaling method (SDSM), Theor. Appl. Climatol., 108, 325–343, 2012.
IPCC: Working Group I Contribution to the IPCC Fifth Assessment Report, Climate Change 2013: The Physical Science Basis, Cambridge, Cambridge University Press, 2013.
Jiang, X. H., Xu, Z. X., Liu, Z. F., and Liu, L.: Performance of Different General Circulation Models (GCMs) in the Basins of Southeastern China, Resources and Environment in the Yangtze Basin, 31, 51–58, 2011.
Jiang, Y., Xu, X., Huang, Q. Z., Huo, Z. L., and Huang, G. H.: Assessment of irrigation performance and water productivity in irrigated areas of the middle Heihe River basin using a distributed agro-hydrological model, Agr. Water Manage., 147, 67–81, 2015.
Jiang, Y.: Simulation of aro-hydrological processes and assessment of water productivity in irrigated areas of the middle Heihe River basin, M.S. thesis, College of Water Resources and Civil Engineering, China Agricultural University, Beijing, China, 2013.
Johnson, F. and Sharma, A.: A nesting model for bias correction of variability at multiple time scales in general circulation model precipitation simulations, Water Resour. Res., 48, W01504, https://doi.org/10.1029/2011WR010464, 2012.
Liu, W. F., Xu, Z. X., Li, F. P., and Qiu, L. H.: GCM performance on simulating climatological factors in Yarlung Zangbo River basin based on a ranked score method, Journal of Beijing Normal University (Natural Science), 49, 304–311, 2013.
Liu, W. F., Xu, Z. X., Li, F. P., Liu, X. C., and Li, X. P.: Performance of different General Circulation Models (GCMs) in the basins of Southeastern China, Journal of Subtropical Resources and Environment, 6, 13–23, 2011.
Liu, Z. F., Xu, Z. X., Liu, L. L., and Chen, Y. N.: Temporal trends of future maximum and minimum air temperature in the Tarim River Basin, Arid Land Geography, 31, 822–829, 2008.
Rosenberg, E. A., Keys, P. W., Booth, D. B., Harley, D., Burkey, J., Steinemann, A. C., and Lettenmaier, D. P.: Precipitation extremes and the impacts of climate change on stormwater infrastructure in Washington State, Climatic Change, 102, 319–349, 2010.
Samadi, S., Wilson, C. A. M. E., and Moradkhani, H.: Uncertainty analysis of statistical downscaling models using Hadley Centre Coupled Model, Theor. Appl. Climatol., 114, 673–690, 2013.
Shen, Y. Y.: Study of numeric simulative model of groundwater in Heihe River basin and its implementation in water scheduling management, M.S. thesis, College of Environment and Resources, Jilin University, 2006.
Wang, F.: Future Hydrological Variations of RCP-based Scenarios for the Heihe River Basin, M.S. thesis, College of Water Resources and Civil Engineering, China Agricultural University, Beijing, China, 2016.
Wang, S. W., Luo, Y., Wen, X. Y., and Huang, J. B.: New Generation of Scenarios of Greenhouse Gas Emission, Advances in Climate Change Research, 8, 305–307, 2012.
Wilby, R. L., Hay, L. E., and Leavesley, G. H.: A comparison of downscaled and raw GCM output: implications for climate change scenarios in the San Juan River basin, Colorado, J. Hydrol., 225, 67–91, 1999.
Wilby, R. L., Dawson, C. W., and Barrow, E. M.: SDSM – A decision support tool for the assessment of regional climate change impacts, Environ. Modell. Softw., 17, 145–157, 2002.
Wilby, R. L., Tomlinson, O. J., and Dawson, C. W.: Multisite Simulation of Precipitation by Conditional Resampling, Climate Research, 23, 183–194, 2003.
Xie, X., He, J. H., and Qi, L.: A review on applicability evaluation of four reanalysis datasets in China, Journal of Meteorology and Environment, 27, 58–65, 2011.
Xiong, Z. and Yan, X. D.: Building a high-resolution regional climate model for the Heihe River Basin and simulating precipitation over this region, Chinese Sci. Bull., 58, 4670–4678, 2013.
Xu, D.: Review on scaling study in irrigation hydrology, J. Hydraul. Eng., 37, 141–149, 2006.
Xu, X., Huang, G. H., and Huang, Q. Z.: Coupled simulation of soil water flow, solute transport and crop growth processes at field scale and its validation, Transactions of the Chinese Society of Agricultural Engineering, 29, 110–117, 2013.
Yin, Z. Y., Lai, A. W., Gong, Y., Peng, T., and Shen, T. Y.: Research development on downscaling method in meteorology and hydrology coupling, Torrential Rain and Disasters, 29, 89–95, 2010.
Zang, C. F. and Liu, J. G.: Spatial and temporal pattern difference of blue-green water flows in typical reference years in the Heihe River Basin, northwestern China, Journal of Beijing Forestry University, 35, 1–10, 2013.
Zhang, B., Ding, W. H., and Meng, B.: Impacts of land use changes on groundwater resources in arid area – Case study of middle reaches of Heihe River, Arid Land Geography, 28, 764–769, 2005.
Zhao, T. B. and Fu, C. B.: Preliminary Comparison and Analysis between ERA-40, NCEP-2 Reanalysis and Observations over China, Climatic and Environmental Research, 11, 14–32, 2006.
Zhao, Y. F., Zhang, B., Zhang, Y. N., Wang, Q., He, X. Q., and Yin, H. X.: Impacts of climate change on agriculture production in the Heihe river basin in recent 50 years, Journal of Arid Land Resources and Environment, 26, 130–136, 2012.
Zuo, H. C., Lv, S. H., and Hu, Y. J.: Variation trend of yearly mean air temperature and precipitation in China in the last 50 years, Plateau meteorology, 23, 238–244, 2004.