the Creative Commons Attribution 4.0 License.
the Creative Commons Attribution 4.0 License.
 | 05 Jun 2018
Spatiotemporal variability and assessment of drought in the Wei River basin of China
Siyang Cai
Depeng Zuo
Zongxue Xu
Xianming Han
Xiaoxi Gao
The temporal and spatial variations of drought in the Wei River basin (WRB) were investigated by calculating the meteorological drought Index (Standardized Precipitation Index, SPI) and the agricultural drought index (Vegetation Health Index, VHI). Monthly precipitation and air temperature were from 22 meteorological stations over the region from 1960 to 2015. Monthly Normalized Difference Vegetation Index (NDVI) and 8-days Land Surface Temperature (LST) were provided from the National Aeronautics and Space Administration (NASA) for the period 2000–2015 were also adopted. The results showed that the drought initially increased and then decreased, reaching at the maximum value in 1990s. The spatial pattern of meteorological drought showed that the drought in northern WRB was heavier than that in southern WRB before 1990s, after that, the situation had the opposite. By comparing the agricultural drought index (VHI) with crop yield, it was proved that VHI was applicable in the WRB and could well reflect the fluctuation of agricultural drought. The WRB suffered from serious agricultural drought in 2000, 2001, 2007 and 2008. Through analysis of the historical precipitation and temperature data, it was found that precipitation had a greater contribution to creating agricultural drought conditions than temperature in the Wei River basin.


Drought is a natural and recurring feature of climate; occurring in virtually all climatic regimes (Mishra and Singh, 2010) and frequent drought have been concerned for many years (Lei et al., 2016). On a global scale, the frequency, duration and severity of droughts have increased substantially in recent decades (Dai, 2011), especially in the regions of arid and semi-arid (Solomon, 2007). Furthermore, drought directly or indirectly affect social and economic sustainability (Alam et al., 2012). Generally divided drought into four categories, meteorological drought, hydrological drought, agricultural drought, as well as socio-economic drought (Wilhite and Glantz, 1985).
Drought severity or magnitude can be illustrated by drought indices (Steinemann, 2003). Numerous indices have been developed for identifying the characteristic of drought over the past few decades. Standardized Precipitation Index (McKee et al., 1993) is a commonly used drought monitoring index, which is calculated based on precipitation data and could have multiple time scales. The SPI has been widely used for drought assessment all over the world (Karavitis et al., 2011; Moreira et al., 2015; Zarch et al., 2015; Oloruntade et al., 2017). Palmer Drought Severity Index (PDSI) is a drought index for drought assessment, which based on precipitation and air temperature to calculating moisture supply and demand by a two-layer soil moisture model (Palmer, 1965). Rayne and Forest (2016) found that there was a substantial increase in drought variability at short time scales based on the PDSI in the United States since 1895. Liu et al. (2013) employed the PDSI for analyzing the spatiotemporal characteristics of dryness conditions across Qinghai Province, Northwest China. The Standardized Precipitation Evapotranspiration Index (SPEI) (Vicente-Serrano et al., 2010) is also based on the supply and demand concept of the water balance equation. Zuo et al. (2016) showed that the applicability of the SPEI in Shandong Province were verified by comparing the SPEI, crop yield and drought-affected crop area.
In addition, remote sensing technology has made it possible to monitor the condition of vegetation across large areas (Lei et al., 2015; Zhang et al., 2017). Thus, remote sensing, which can be used to extract meteorological or biophysical characteristics of terrestrial surfaces, has gained more attention for drought monitoring (Rhee et al., 2010). The widely used vegetation indices include VCI (Vegetation Condition Index) (Kogan, 1995), Temperature Condition Index (TCI) (Kogan, 1995), Soil Moisture Condition Index (SMCI) and Precipitation Condition Index (PCI) (Zhang and Jia, 2013). Furthermore, Martinez-Fernandez et al. (2016) proved that SMOS Soil Water Deficit Index (SWDI) well reproduces the soil water balance dynamics and was able to appropriately track agricultural drought. Unganai and Kogan (1998) clearly showed that temporal and spatial characteristics of drought in Africa could be detected, tracked and mapped from AVHRR data based on Vegetation Health Index (VHI). The Normalized Vegetation Supply Water Index (NVSWI) registered correlation coefficients with the AMSR-E soil moisture data at the values of 0.53 in September and indicated its applicability in monitoring drought in Northeast China (Cong et al., 2017).
China is one of the major crop production countries around the world, which accounted for 20 % of global cereal production in 2011 (FAO, 2014). However, Yu et al. (2014) also revealed that dry areas were reported to increase by 3.72 % per decade in the past five decades. Since the late 1990s, droughts have become more frequent and severe across China (Chen and Sun, 2015). Both the frequency and severity of droughts over the Yun–Gui Plateau in Southwest China were intensified during the recent decades from total water storage anomalies (TWSA) generated using GRACE satellite data and ANN models (Long et al., 2014). The Wei River is of great importance in social and economic development of Shan'xi, Gausu and Ningxia Provinces in China. Zou et al. (2017) showed that the whole Wei River basin exhibited a dry trend, with more significant trends in the northern, southeastern and western WRB than the remaining regions based on PDSI_SWAT. Zhai and Feng (2009) showed that short time drought had affected the Yellow River Basin and Yangtze River Basin more than the Inland River Basin. However, there is no comprehensive research on spatiotemporal variability of drought based on remote sensing dataset in the Wei River basin. Hence, the main process of the study are as follows: (1) to analysis temporal trends of annual total precipitation and average air temperature during the period 1960–2015; (2) to calculate frequency occurrence of different degree of drought at various time scales and the variation of drought intensity for the recent six decades based on the SPI; (3) to identify spatial variations of drought and drought rating based on the SPI; (4) to estimate the spatiotemporal variability of agricultural drought based on the VHI; (5) to evaluate the capability of the VHI; (6) to analysis the relationship between the VHI and meteorological factors. The results gained in this study could provide useful information for drought assessment in the Wei River basin and other regions in China.
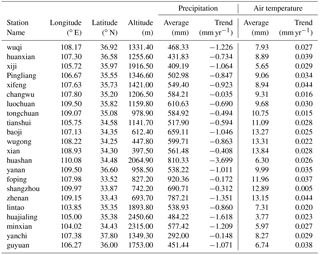
Table 1The meteorological gauging stations in the Wei River Basin.
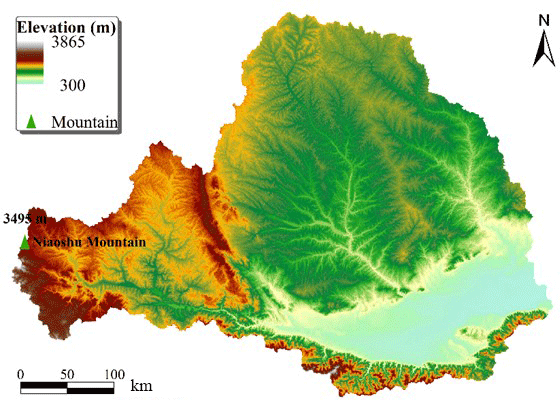
2.1 Study Area
Wei River is the largest tributary of the Yellow River in North China, with a drainage area of 1348 × 105 km2 and originate from the Gansu Province and flows into the Yellow River at the Tongguan port with its length of approximately 818 km (Fig. 1). It lies between latitude 33.5 to 37.5∘ N and 103.5 to 110.5∘ E. The mean annual temperature in the WRB is between 7.8 and 13.5∘, mean annual precipitation is 400–800 mm−1 and potential evapotranspiration is 800–1000 mm yr−1. In winter the climate is cold, dry and rainless, controlled by the Mongolia high pressure system, and it is hot and rainy in summer due to the effects of the West Pacific subtropical high pressure system.
2.2 Data Description
The monthly precipitation and average air temperature data at 22 national meteorological stations analyzed in this paper collected from the Chinese Meteorological Data Sharing Service System, China Meteorological Administration over the Wei River Basin from 1960 to 2015, twelve of them were in Shanxi Province, seven of them were in Gansu Province and others in Ningxia Province. The spatial distribution and detail information of the 22 gauging stations are shown in Fig. 1 and Table 1.
All the products of the remote sensing dataset are provided by the Moderate Resolution Imaging Spectroradiometer (MODIS), which are acquired from the National Aeronautics and Space Administration (NASA). Monthly Normalized Difference Vegetation Index (NDVI) information are obtained from MODIS13A3 NDVI product and eight-days Land Surface Temperature (LST) information are provided by MOD11A2 during 2000–2015. All the MODIS datasets have a spatial resolution of 1 km × 1 km. To remove noise from the remote sensing data caused by clouds or weather, the maximum value composite (MVC) method is used for data processing. The selected MODIS data products are preprocessed using the MODIS Reprojection Tools (MRT) (Yang et al., 2012).
3.1 Calculation of the SPI
Computation of the SPI involves fitting a gamma probability density function to a given time series of precipitation. This is performed separately for each month (or any other temporal basis of the raw precipitation time series) and for each location in space (McKee et al., 1993). The SPI can be calculated as the following:
It is firstly fitted with an incomplete gamma probability density function to a given frequency distribution of precipitation at a station.
where x is the precipitation amount, αis the shape parameter, β is the scale parameter, and the gamma function is expressed as:
The maximum likelihood method is used to estimate the optimal values of αand β (Thom, 1966).
where n is the number of precipitation records.
The cumulative probability for a given month then can be obtained by the following equation:
Setting , the incomplete gamma function can be obtained:
Parameters of the gamma distribution are estimated for every individual station in each month of the year. Considering the probability for a precipitation amount of zero (x = 0) which is not defined in the gamma function, the cumulative probability becomes:
where q is the probability of a zero and is estimated by m∕n, m is the number of zeros in precipitation records, and n is the length of precipitation records.
The cumulative probability of the distribution for each value of precipitation is then transformed using equal probability to a normal distribution with a mean of zero and standard deviation of one, which is the value of the SPI. For a given cumulative probability H(x), the corresponding normal distribution probability can be estimated by using following equation (Abramowitz and Stegun, 1964):
where c0=2.515517, c1=0.802853, c2=0.010328, d1=1.432788, d2=0.189269, d3=0.001308. Table 2 shows the categorization of drought and wet classified based on the SPI.
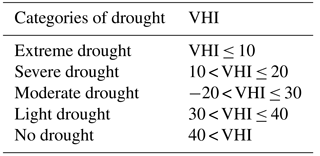
3.2 Calculation of the VHI
The Vegetation Index was defined as combination of VCI and TCI. It has been widely used to detect drought in many places, such as Africa, China, America, etc. The VHI was defined by the following formulae:
where NDVImax and NDVImin are the multi-year absolute maximum and minimum of NDVI, respectively; Tmax and Tmin are the multi-year absolute maximum and minimum of T, respectively; and α is the weight to measure the contribution of VCI and TCI for assessing the status of drought. Generally, α is set as 0.5 because it is difficult distinguish the contribution of crop surface temperature and NDVI when measuring drought stress. VHI was proposed to address the limitations of VCI in areas with excessive soil wetness and/or long periods of cloudiness (Kogan, 1995), under which conditions NDVI is normally very depressed and VCI has low values, which can be interpreted as drought in error. TCI is expected to correct low values because of the variation in response of vegetation to temperature as compared with NDVI. Table 3 shows the categorization of drought based on the VHI.
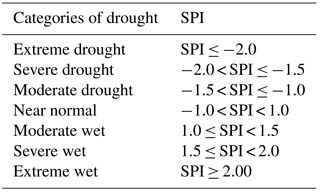
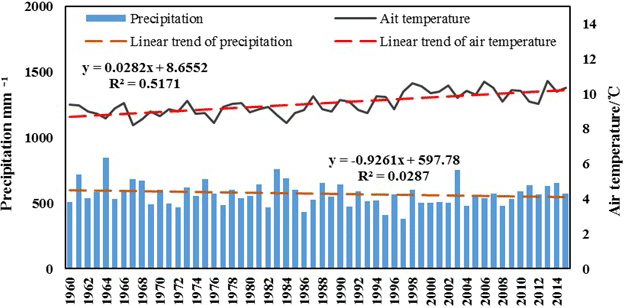
Figure 2Temporal variations of annual average air temperature and total precipitation in the Wei River Basin.
4.1 Trend analysis of precipitation and air temperature
The temporal trends of annual total precipitation and average air temperature over the Wei River Basin WRB at 22 meteorological stations during the period 1960–2015 are shown in Table 1. The results shows that all stations showed a decreasing trend in annual total precipitation, ranging from −3.7 to −0.15 mm yr−1. The largest decreasing trend (−3.7 mm yr−1) was identified at Huashan station, which is located in the southeastern area.

Figure 3Drought frequency in different decades at different time scales in the Wei River Basin.
For annual average air temperature, an increasing trend was found at all the 22 stations, ranging from 0.005 to 0.044 ∘C yr−1. The highest increase was observed at Zhen'an station, located in the south area, while the lowest increase was detected at Shangzhou station, located in the southeastern area.
The annual total precipitation and average air temperature series over the WRB are shown in Fig. 2. The annual total precipitation series in Fig. 2 shows that the driest year was 1997 (380 mm), while the year 1964 was the wettest year (845 mm) from 1960 to 2015. The hottest year was 2013 (10.7 ∘C), while the coldest year was 1967 (8.2 ∘C). The results showed that the annual total precipitation and average air temperature generally exhibited negative and positive trends across the WRB, respectively, which is prone to occur drought events.
4.2 Spatiotemporal characteristics of the SPI at various time scales
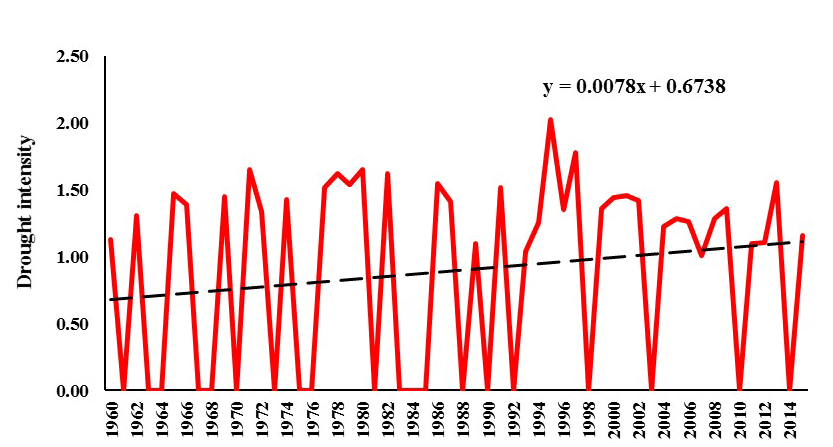
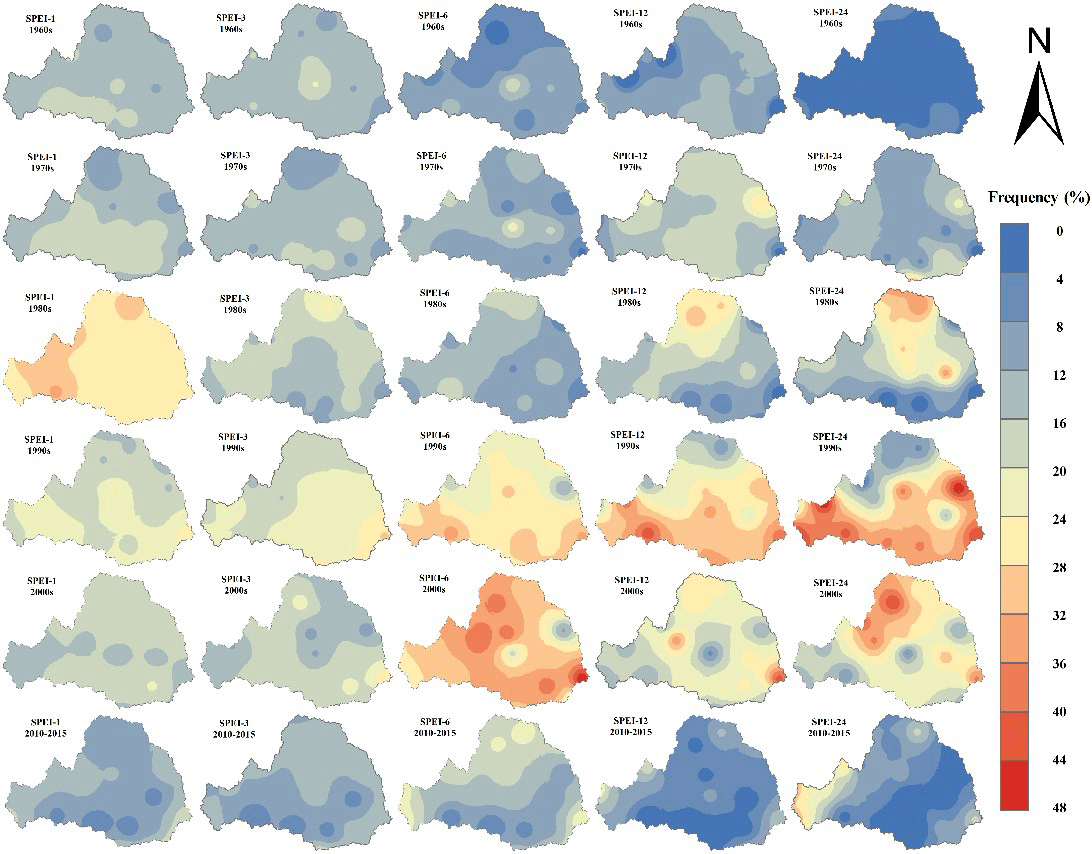
Figure 5Spatial distributions of drought frequency at various time scales during the six decades in the Wei River Basin.
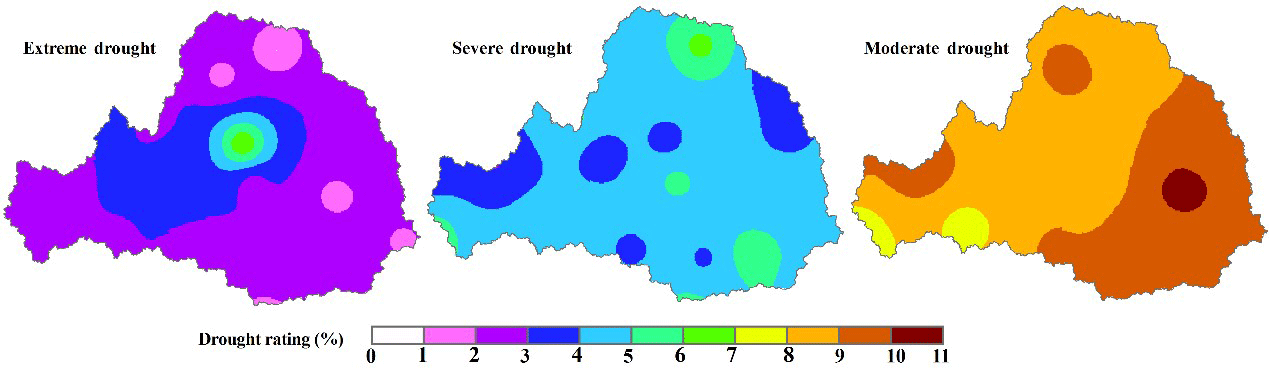
Figure 6Drought rating of extreme drought, severe drought and moderate drought based on SPI-3 in the Wei River Basin during the period 1960–2015.
4.2.1 Temporal characteristics of the SPI at various time scales
The frequency of drought and wet occurrences at different time scales during the six decades over the Wei River Basin based on SPI (Fig. 3). In the 1960s, the percentages of extreme drought and severe drought increased first and then decreased as the increased SPI time scales, all the maximum values reached at 3 month. While the percentages of moderate drought increased as the increased SPI time scales. In the 1970s, the percentages of extreme drought ranged from 0.53 to 1.74 %; the percentages of severe drought almost increased first and then decreased as the increased SPI time scales, the maximum values was reached at 12 month (4.81 %); the percentage of moderate drought was about 9 %. In the 1980s, the percentages of extreme drought and severe drought fluctuated with the increased SPI time scale; the frequency of moderate drought decreased first and then increased as the increased SPI time scales, the minimum value reached at 12 month (7.92 %), the maximum value reached at 24 month (10.64 %). In the 1990s, the percentages of extreme drought and moderate drought increased with the increased SPI time scales; the percentages of severe drought increased first and then decreased with the increased SPI time scales, the maximum value reached at 6 month (9.32 %). In the 2000s, the percentages of extreme drought ranged from 1.21 to 2.54 %; the percentages of severe drought and moderate drought reached minimum values at 1 month (3.79 and 9.96 %) and reached maximum values at 6 month (10.45 and 18.11 %). During the period 2010–2015, the percentages of extreme drought decreased as the increased SPI time scales; the percentages of severe drought and moderate drought increased first and then decreased as the increased SPI time scales, the maximum values reached at 6 month (4.23 and 0.79 %).
The annual drought intensity time series of Wei River Basin was constructed by the absolute value of the sum of each site's annual SPI () based on SPI-12. Due to the difference of the number of stations in each region, this method calculated the drought intensity of each region was not comparable, so the value divided by the number of stations (Fig. 4). The increases in value of drought intensity was 0.078 per 10-years for Wei River Basin during 1960–2015. The drought intensity was greater, but the duration was short before 1976; a continuous severe drought occurred during 1977–1980. After 1990, drought intensity increased and long duration. A continuous severe drought also occurred from 1993 to 1997 and the value of drought intensity reached the maximum value (2.03). A continuous moderate drought happened in both 1999–2002 and 2004–2009.
4.2.2 Spatial patterns of the SPI at various time scales
Frequency distributions of extreme drought, severe drought and moderate drought at 1, 3, 6, 12 and 24 months during the six decades in the Wei River Basin were shown in Fig. 5. The frequency of drought decreased as the time scale of the SPI increased during 1960s. In 1970s, the frequency of drought increased in varying degree at different time scales. In 1980s, the values was relatively small in south of Wei River Basin; the value was found in the north and west for SPI-1 at about 18 %; the value was found in the north for SPI-12 and SPI-24 approximately 30 %, which were longer time scales. The frequency of drought reached the maximum value at SPI-3, SPI-12 and SPI -24 during 1990s. In 2000s, the frequency of drought continuously increased and the extent of drought area expanded for SPI-6; the value decreased at other time scales. The frequency of drought was basically below 20 % during 2010–2015.
The drought rating of extreme drought, severe drought and moderate drought based on SPI-3 during the period 1960–2015 were shown in Fig. 6. The moderate drought rating of southeast was greater than the northwest and the maximum value was in Tongchuan. The drought rating of severe drought ranged from 2.98 to 6.25 % and the value of median was smaller than the south and the maximum value was in Wuqi area in the northern part of the basin. The drought rating of extreme drought relatively smaller and the value of southeast was greater than the northwest and the maximum value was in Xifeng.
4.3 Assessment of drought in the Wei River basin based on the VHI
4.3.1 Spatiotemporal characteristics of the VHI in the Wei River Basin
In order to investigate the percentage of drought occurrence during the period of 2000–2015 in the Wei River Basin, the frequencies of the VHI values in five categories (Table 3) were calculated at 22 stations (Fig. 7). From 2000 to 2015, the percentages of extreme drought was almost zero, and that of severe drought ranged from 0 to 1.37 % The percentages of moderate drought were relatively higher than those of extreme drought and severe drought, which were between 0.24 to 15.32 %. The percentages of light drought ranged from 4 to 25.97 %. Furthermore, 59.33 to 95.7 % of the VHI belongs to the no drought.
In additional, the values of mean, maximum and minimum of the VHI during 2000–2015 were shown in Fig. 8. The mean of VHI ranged from 46.71 to 61.59 and an increasing trend had been detected (R = 0.88). The mean of maximum value were 95 and there was no significant fluctuation found. The minimum value of VHI ranged from 11.45 to 22.32 and the minimum of that was in 2000 (10.45), the maximum of that was in 2012 (22.32).
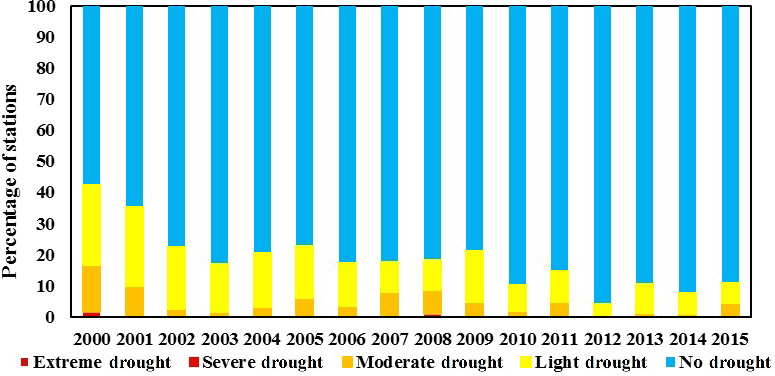
Figure 7Frequency of occurrence of drought in six categories in the Wei River Basin during the period of 2000–2015.
The spatial characteristics of the VHI drought index, the value of drought calculated from 2000 to 2015 in the Wei River Basin were shown in Fig. 9. According to the spatial patterns showed that crops in the WRB were affected by different levels of drought. Overall, there were few extreme drought occurred from 2000–2015. Severe drought occurred in 2000, 2005, 2007, 2008 and 2015, and all occurred in the northern part of the WRB, which occurred in the west of the WRB in 2000 and 2002. Different degrees of moderate drought was happened every year and all happened in the northern part of the WRB. For light drought, in addition to the northern regions, there were also some areas in the west had a light drought.
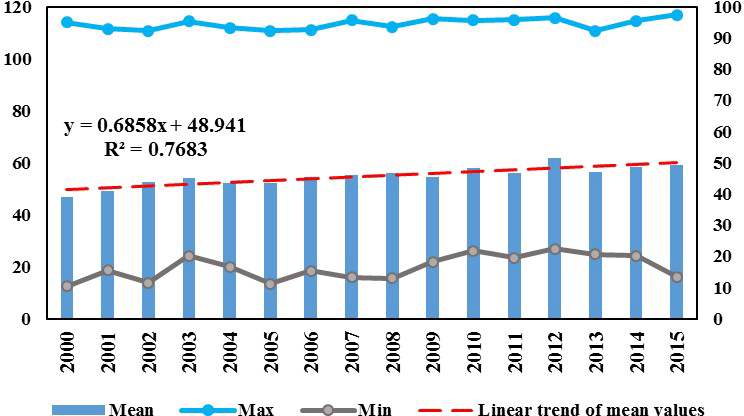
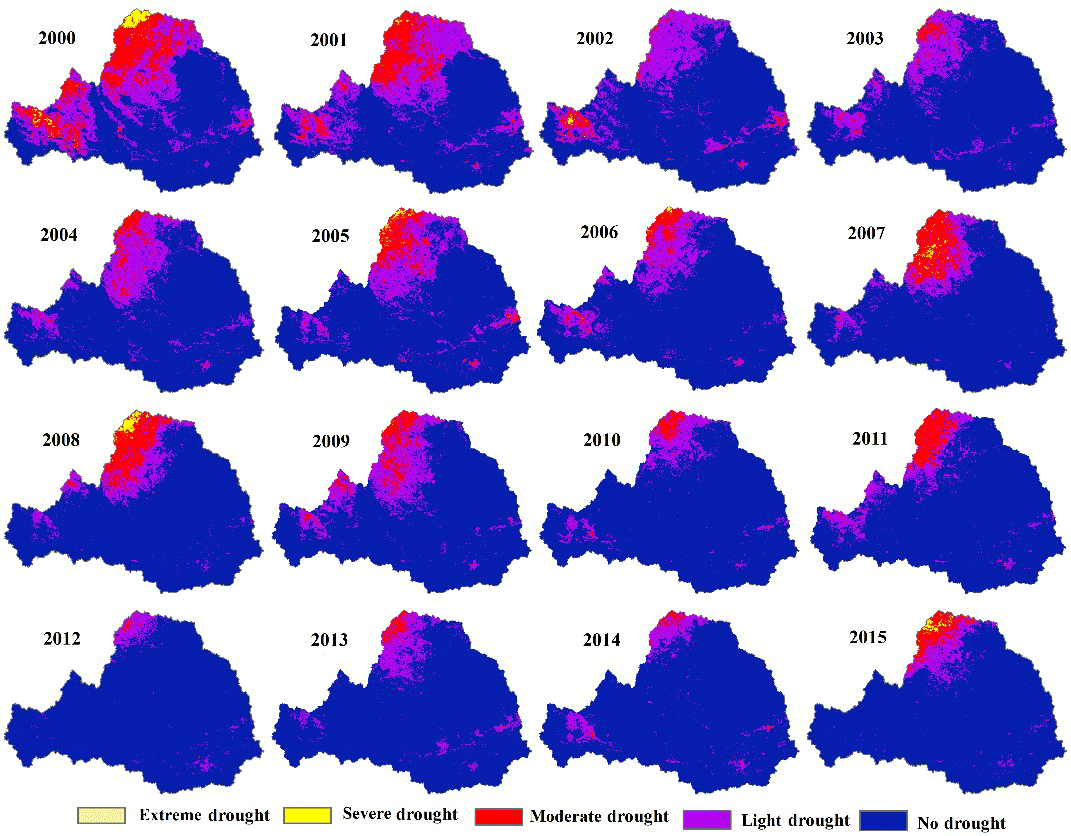
Figure 9Spatial distributions of drought from 2000 to 2015 based on the VHI in the Wei River Basin.
4.3.2 Impact of drought on agriculture in the Wei River Basin
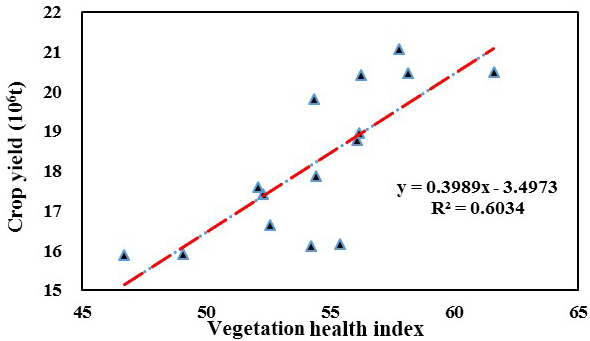
Figure 10Correlationship between crop yield and the VHI during 2000–2015 in the Wei River Basin.
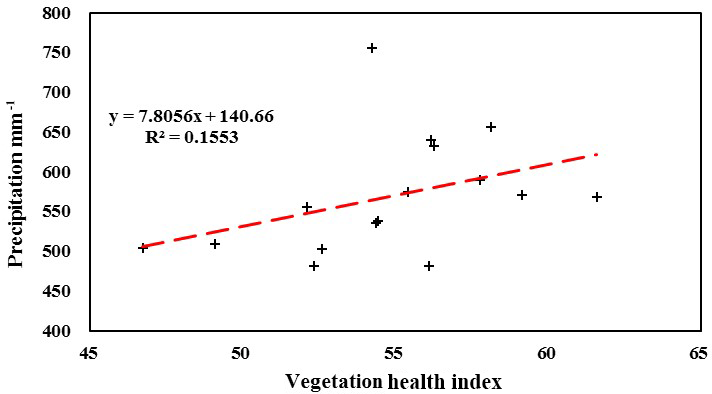
Figure 11Correlationship between precipitation and the VHI during 2000–2015 in the Wei River Basin.
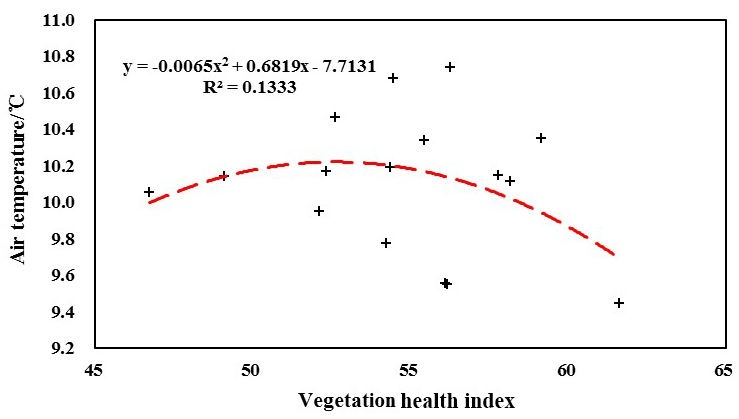
Figure 12Correlationship between air temperature and the VHI during 2000–2015 in the Wei River Basin.
Correlationship between crop yield and the VHI during 2000–2015 in the Wei River Basin are shown in Fig. 10. The relationship between the VHI and crop yield was detected with R value of 0.78. The result showed that the VHI had a promising potential of quantifying the agricultural yield reduction caused by agricultural drought in the WRB.
4.3.3 Comparison with the meteorological factors
The correlationship between VHI and precipitation and average air temperature are shown in Figs. 11 and 12. The VHI showed a relationship with the precipitation and the R value of the linear regression equation reached at R = 0.4 during 2000–2015. While the correlation between VHI and average air temperature showed a polynomial correlation with the R = 0.37. In a word, the effect of precipitation on agricultural drought was greater than that of air temperature.
This study detected the temporal and spatial pattern of drought in the Wei Rvier Basin from 1960–2015. The SPI drought index at different time scales were calculating using monthly precipitation and air temperature. The VHI was calculating based on monthly NDVI and 8-days LST. A regression was employed to identify the capability of VHI to evaluating the drought events. Major conclusions can be summarized as follows:
-
The total precipitation had a decreasing trend with 0.9261 mm yr−1 and average air temperature had an increasing trend with 0.0282∘ yr−1 and the situation was prone to occur drought events,
-
The percentages of severe drought initially increased and then decreased with decades in 1970s and 1990s while those of moderate drought increased with decades in 1960s and 1990s. Based on drought intensity, a continuous moderate drought occurred in both 1992–2002 and 2004–2009. The drought rating of moderate drought was greater than that of severe drought and extreme drought. Meanwhile, the drought rating was greater in southern than that in northern. Before 1990s, the degree of drought in southern was heavier than that in northern, however, the degree of drought was the opposite.
-
The average had showed an increasing trend with R = 0.88. Based on the VHI, the degree of northern was heavier than that in southern, the degree of western was heavier than in eastern. The heaviest drought was occurred in 2000, 2007 and 2008.
-
Compared to crop yield, VHI had a well capability to evaluating agricultural drought in the Wei River Basin. And precipitation had greater effect on agricultural drought than temperature
Meoteological data were obtained from China Meteorological Data Sharing Services System Network (http://data.cma.cn/; CMDC, 2018). Modis datasets (MODIS 13A3 and MODIS 11A2) were obtained from https://modis.gsfc.nasa.gov/ (last access: 30 October 2017). Crop yield datasets were obtained from National Bureau of Statistics of China (http://data.stats.gov.cn, last access: 10 January 2018).
The authors declare that they have no conflict of interest.
This article is part of the special issue “Innovative water resources management – understanding and balancing interactions between humankind and nature”. It is a result of the 8th International Water Resources Management Conference of ICWRS, Beijing, China, 13–15 June 2018
This study is jointly supported by the National Key Research and Development
Program of China (Grant No. 2017YFC1502703), the National Natural Science
Foundation of China (Grant No. 91647202), and the Major Science and
Technology Program for Water Pollution Control and Treatment (Grant No. 2017ZX07302-04).
Edited by: Andreas Schumann
Reviewed by: two anonymous referees
Abramowitz, M. and Stegun, A. I.: Handbook of mathematical functions with formulas, graphs, and mathematical tables, Courier Dover Publications, New York, USA, 1964.
Alam, M. M., Siwar, C., Toriman, M. E., and Molla, R. I.: Climate change induced adaptation by paddy farmers in Malaysia, Mitig. Adapt. Strat. Gl., 17, 173–186, 2012.
Chen, H. and Sun, J.: Changes in Drought Characteristics over China Using the Standardized Precipitation Evapotranspiration Index, J. Climate, 28, 5430–5447, https://doi.org/10.1175/JCLI-D-14-00707.1, 2015.
CMDC (China Meteorological Data Service Center): Dataset of daily climate data from China Ground Climate Data Monthly Dataset, available at: http://data.cma.cn/, last access: 1 May 2018.
Cong, D., Zhao, S., Chen, C., and Duan, Z.: Characterization of droughts during 2001-2014 based on remote sensing: A case study of Northeast China, Ecol. Inform., 39, 56–67, https://doi.org/10.1016/j.ecoinf.2017.03.005, 2017.
Dai, A.: Drought under global warming: a review, Wires Clim. Change, 2, 45–65, https://doi.org/10.1002/wcc.81, 2011.
Food and Agriculture Organization of the United Nations: FAOSTAT, The Statistics Division of FAO, Rome, Italy, 2014.
Karavitis, C. A., Alexandris, S., Tsesmelis, D. E., and Athanasopoulos, G.: Application of the Standardized Precipitation Index (SPI) in Greece, WATER, 3, 87–805, https://doi.org/10.3390/w3030787, 2011.
Kogan, F. N.: Droughts of the late 1980s in the United States as derived from NOAA polar-orbiting satellite data, B. Am. Meteorol. Soc., 76, 655–668, 1995.
Lei, T., Wu, J., Li, X., Geng, G., Shao, C., Zhou, K., Wang, Q., and Liu, L.: A new framework for evaluating the impacts of drought on net primary productivity of grassland, Sci. Total Environ., 536, 161–172, https://doi.org/10.1016/j.scitotenv.2015.06.138, 2015.
Lei, Y., Zhang, H., Chen, F., and Zhang, L.: How rural land use management facilitates drought risk adaptation in a changing climate – A case study in arid northern China, Sci. Total Environ., 550, 192–199, https://doi.org/10.1016/j.scitotenv.2016.01.098, 2016.
Liu, Z., Zhou, P., Zhang, F., Liu, X., and Chen, G.: Spatiotemporal characteristics of dryness/wetness conditions across Qinghai Province, Northwest China, Agr. Forest Meteorol., 182–183, 101–108, https://doi.org/10.1016/j.agrformet.2013.05.013, 2013.
Long, D., Shen, Y., Sun, A., Hong, Y., Longuevergne, L., Yang, Y., Li, B., and Chen, L.: Drought and flood monitoring for a large karst plateau in Southwest China using extended GRACE data, Remote Sens. Environ., 155, 145–160, https://doi.org/10.1016/j.rse.2014.08.006, 2014.
Martinez-Fernandez, J., Gonzalez-Zamora, A., Sanchez, N., Gumuzzio, A., and Herrero-Jimenez, C. M.: Satellite soil moisture for agricultural drought monitoring: Assessment of the SMOS derived Soil Water Deficit Index, Remote Sens. Environ., 177, 277–286, https://doi.org/10.1016/j.rse.2016.02.064, 2016.
McKee, T. B., Doedken, N. J., and Kleist, J.: The relationship of drought frequency and duration to time scales, Proceeding of the 8th Conference on Applied Climatology, Anaheim, Calif., USA, 17–22 January 1993, Am. Meteorol. Soc., 17, 179–182, 1993.
Mishra, A. K. and Singh, V. P.: A review of drought concepts, J. Hydrol., 391, 202–216, 2010.
Moreira, E. E., Martins, D. S., and Pereira, L. S.: Assessing drought cycles in SPI time series using a Fourier analysis, Nat. Hazards Earth Syst. Sci., 15, 571–585, https://doi.org/10.5194/nhess-15-571-2015, 2015.
Oloruntade, A. J., Mohammad, T. A., Ghazali, A. H., and Wayayok, A.: Analysis of meteorological and hydrological droughts in the Niger-South Basin, Nigeria, Glob. Planet. Change, 155, 225–233, https://doi.org/10.1016/j.gloplacha.2017.05.002, 2017.
Palmer, W. C.: Meteorological drought, US Department of Commerce, Weather Bureau, Washington, DC, USA, 1965.
Rayne, S. and Forest, K.: Evidence for increasingly variable Palmer Drought Severity Index in the United States since 1895, Sci. Total Environ., 544, 792–796, https://doi.org/10.1016/j.scitotenv.2015.11.167, 2016.
Rhee, J., Im, J., and Carbone, G. J.: Monitoring agricultural drought for arid and humid regions using multi-sensor remote sensing data, Remote Sens. Environ., 114, 2875–2887, 2010.
Solomon, S.: The Physical Science Basis. Working Group I Contribution to the Fourth Assessment Report of the IPCC[J], edited by: Chang, I. C., 17 November 2007, Comp. Geom., 18, 95–123, 2007.
Steinemann, A.: Drought indicators and triggers: A stochastic approach to evaluation, J. Am. Water Resour. As., 39, 1217–1233, https://doi.org/10.1111/j.1752-1688.2003.tb03704.x, 2003.
Thom, H. C. S.: Some methods of climatological analysis, World Meteorological Organization (WMO), Technical Note no. 82, Geneva, Switzerland, 20–22, 1966.
Unganai, L. S. and Kogan, F. N.: Drought monitoring and corn yield estimation in Southern Africa from AVHRR data, Remote Sens. Environ., 63, 219–232, https://doi.org/10.1016/S0034-4257(97)00132-6, 1998.
Vicente-Serrano, S. M., Begueria, S., and Lopez-Moreno J. I.: A Multi-scalar Drought Index Sensitive to Global Warming: The Standardized Precipitation Evapotranspiration Index, J. Climate, 23, 1696–1718, https://doi.org/10.1175/2009JCLI2909.1, 2010.
Wilhite, D. A. and Glantz, M. H.: Understanding: the Drought Phenomenon: The Role of Definitions, Water Int., 10, 111–120, https://doi.org/10.1080/02508068508686328, 1985.
Yang, B., Ma, S., Li, J., Liao, Y., Zhao, B., and Claudia, K.: Agriculture drought monitoring in Dongting lake basin by MODIS data, 1st International Conference on Agro-Geoinformatics, 2–4 August 2012, Shanghai, China, 2012.
Yu, M., Li, Q., Hayes, M. J., Svoboda, M. D., and Heim, R. R.: Are droughts becoming more frequent or severe in China based on the Standardized Precipitation Evapotranspiration Index: 1951–2010?, Int. J. Climatol., 34, 545–558, https://doi.org/10.1002/joc.3701, 2014.
Zarch, M. A. A., Sivakumar, B., and Sharma, A.: Droughts in a warming climate: A global assessment of Standardized precipitation index (SPI) and Reconnaissance drought index (RDI), J. Hydrol., 526, 183–195, https://doi.org/10.1016/j.jhydrol.2014.09.071, 2015.
Zhai, L. and Feng, Q.: Spatial and temporal pattern of precipitation and drought in Gansu Province, Northwest China, Nat. Hazards, 49, 1–24, https://doi.org/10.1007/s11069-008-9274-y, 2009.
Zhang, A. and Jia, G.: Monitoring meteorological drought in semiarid regions using multi-sensor microwave remote sensing data, Remote Sens. Environ., 134, 12–23, 2013.
Zhang, L., Jiao, W., Zhang, H., Huang, C., and Tong, Q.: Studying drought phenomena in the Continental United States in 2011 and 2012 using various drought indices, Remote Sens. Environ., 190, 96–106, https://doi.org/10.1016/j.rse.2016.12.010, 2017.
Zuo, D., Cai, S., Xu, Z., Yang, X., and Li, F.: Spatiotemporal patterns of drought at various time scales in Shandong Province of Eastern China, Theor. Appl. Climatol., 2016, 1–14, https://doi.org/10.1007/s00704-016-1969-5, 2016.
Zou, L., Xia, J., and She, D.: Drought Characteristic Analysis Based on an Improved PDSI in the Wei River Basin of China, WATER, 9, 1783, https://doi.org/10.3390/w9030178, 2017.