the Creative Commons Attribution 4.0 License.
the Creative Commons Attribution 4.0 License.
 | 05 Jun 2018
Village-level supply reliability of surface water irrigation in rural China: effects of climate change
Yanrong Li
Jinxia Wang
Surface water, as the largest part of water resources, plays an important role on China's agricultural production and food security. And surface water is vulnerable to climate change. This paper aims to examine the status of the supply reliability of surface water irrigation, and discusses how it is affected by climate change in rural China. The field data we used in this study was collected from a nine-province field survey during 2012 and 2013. Climate data are offered by China's National Meteorological Information Center which contains temperature and precipitation in the past 30 years. A Tobit model (or censored regression model) was used to estimate the influence of climate change on supply reliability of surface water irrigation.
Descriptive results showed that, surface water supply reliability was 74 % in the past 3 years. Econometric results revealed that climate variables significantly influenced the supply reliability of surface water irrigation. Specifically, temperature is negatively related with the supply reliability of surface water irrigation; but precipitation positively influences the supply reliability of surface water irrigation. Besides, climate influence differs by seasons. In a word, this paper improves our understanding of the impact of climate change on agriculture irrigation and water supply reliability in the micro scale, and provides a scientific basis for relevant policy making.


Surface water, as the largest part of water resources, plays an important role on China's agricultural production and food security. China's surface water is 2.63 × 10¹² m3, containing almost 96.7 % of the total water volume. There are 48.4 % provinces whose surface water supply contains more than 90 % of the total water supply. And the share of provinces that surface water supply contains more than 70 % of the total water supply is even 67.7 %. Only 12.9 % provinces that surface water supply is less than 50 % of the total water supply (NBSC, 2015).
Surface water is vulnerable to climate change. Human activities and climate change first influence moisture and heat transfer, and then influence precipitation and temperature variations and change patterns (Trenberth et al., 2003; Hao et al., 2007; Piao et al., 2010; IPCC, 2014). These changes, through impacts on evaporation and surface runoff, could greatly alter land surface water balance in turn (Hao et al., 2007; Prowse and Belataos, 2006; IPCC, 2014). During recent 60 years (1961–2011), China's surface runoff decreased remarkably. For instance, river runoff in six large river basins presented a declining trend, they were Hai, Yellow, Liao, and Songhua in northern China, and Yangtze and Pearl in southern China (Wang et al., 2017). The onset of daily drying-up occurs more frequently and earlier than before and the period of zero flow also lengthens (Long et al., 2006). Even some river basins (e.g., Hai and Yellow) have changed from open to closed ones in some years, which negatively influenced the ecological environment (such as causing biodiversity degradation, atrophy and sea water intrusion) (Wang et al., 2016). Besides researches about the past reality, there are also many prediction studies on relationship of climate change and surface water resources. For instance, Zhang and Wang (2007) predicted an overall increase of river runoff over China (7.5 % in B1 scenario by 2100, and 9.7 % in A1 scenario). And in the Yellow River basin, annual runoff will increase by 11 % in A2 scenario and by 5 % in B2 scenario. In Shanxi Province, by 2030, with temperature gradually increasing, there will be less surface water resources than in 2010, but the overall trend is stable. By 2050, the influence of the temperature will increase more than that of precipitation, except for the regions of Taiyuan and Yangquan, in other parts of Shanxi, surface water resources will generally reduce (Hao et al., 2007). Supply and demand balance of water resources affected greatly by climate change will further affect agricultural production. In Haihe River in China, by 2030, changes of water resources balance will cause wheat irrigated area decreasing by 6.9 %, wheat raining area increasing by 19.9 %, and wheat yield decreasing 1.2 % (Wang et al., 2013). But all the prediction studies on relationship of water resources and climate change are greatly sensitive to biases of climate projections used in the selected models (Piao et al., 2010; Hao et al., 2007; Zhang and Wang, 2007; Wang et al., 2013).
Not only the quantity but also the quality of surface water is influenced by climate change (Xia et al., 2010, 2012; Zhang et al., 2009). Through affecting process of biochemical reaction rate, the ecological effect, the rise of temperature or migration type of water pollutants, the changes of wind speed, light duration and radiation enhancement can directly or indirectly impact on water environment (Dalla et al., 2007; Delpla et al., 2009; Wilby et al., 2006). Such as temperature rising affects the eutrophication of lake sediment and water pollutants in secondary interpretation (Lamon et al., 2009). Vanvliet (2008) quantified the influence of drought event on water quality of Meuse River in Western Europe in 1976 and 2003. Results showed that, compared with normal years, the concentration of NH, NO and Chlorophyll A respectively increased 1.9, 1.3 and 1.2 times. Precipitation and natural runoff decreasing, temperature increasing caused by climate change were helpful to increase the concentration of Ca2+ and Mg2+ in the Yellow River (Xia et al., 2012).
Besides climate change, irrigation infrastructure also plays an important role on the use of surface water for irrigation. Poor construction of rural irrigation infrastructure was one of the mayor reasons for increasing serious drought in agricultural production in China (Wang et al., 2013; Chen et al., 2012; Yang et al., 2012, Jia, 2016). Investment on village-level irrigation facilities is helpful for increasing farmers' income (Ma, 2008). Thankfully, construction of irrigation and water conservancy facilities has been paid great attention in recent years. By 2010, there were 87 873 reservoirs and 5795 irrigation districts that are more than 10 000 µ (MWR, 2011). Investment on irrigation infrastructure has increased by 27 times in the past 60 years (from CNY 700 million in 1958 to CNY 19.5 billion in 2009) (MWR, 2011). Compared with other water conservancy facilities investment, the irrigation infrastructure investment is still far not enough (Ma, 2008). Even in 2009, the share of irrigation infrastructure investment on the total water resources investment is only 10 % (MWR, 2011).
Despite more and more scholars begin to study the impacts of climate change or irrigation infrastructure on surface water supply, empirical analysis on this aspect is still very limit. In terms of the supply reliability of surface water irrigation, there are few works that address status of it, especially with data from large scale village survey and associating it with climate change. As for irrigation infrastructure, researches mainly focus on supply or requirement desire of irrigation infrastructure (Wang, 2015; Zhu and Wang, 2014; He and Guo, 2010). Few studies combine irrigation infrastructure and supply reliability of surface water irrigation, let alone under changing climate condition.
So with research limitation of this filed, our study focused on the following questions: how much reliable of surface water irrigation supply in rural area in China? Whether climate change influences the supply reliability of surface water irrigation? If yes, how can we quantify this influence? What is the relationship between the supply reliability of surface water irrigation and irrigation infrastructure?
In order to find answers of the questions above, the rest of this paper is organized as follows. Section 2 introduces the data used in this study. Section 3 displays local climate situation, and describes rural irrigation infrastructures and supply reliability of surface water irrigation. Econometric analyses in Sect. 4, including the influence of climate variables, rural irrigation infrastructures and other factors on the supply reliability of surface water irrigation. The final section concludes.
2.1 Field survey data
The data we used in this study was collected from a nine-province field survey during 2012 and 2013. The nine provinces contain six Northern provinces (Hebei, Henan, Shandong, Jiangsu, Anhui and Jilin) and three southern provinces (Jiangxi, Guangdong and Yunnan). Based on local water resources, climate condition and economic development level, the nine provinces are firstly collected from the whole nation, and then the following strategies were taken to select samples.
First, in each province except for Jiangxi (10 counties) and Guangdong (6 counties), randomly selected three counties. After selecting the counties, we invited local experienced water conservancy workers to stratify all townships of the three counties into three groups according to their rural water infrastructure: above average, average, or below average. And then we randomly selected one township from each of the three groups and randomly chose three villages from each of the selected townships. Finally, 330 villages in 37 counties in 9 provinces were selected. Since we only analyze the supply reliability of surface water irrigation in this study, we just kept villages that use surface water for irrigation. So, the samples used in the study are 256 villages in 94 towns, 37 counties and 9 provinces. The sample distribution of this study is summarized in Table A1 in the Appendix.
The survey contains a three-year (2010, 2011 and 2012) and three- level (town, village and household) data collection.1 In terms of this study, we mainly use village level questionnaires. A most important point was the supply reliability of surface water irrigation, meaning that whether farmers who needed irrigate their crops using surface water could get enough water and in a timely fashion. If the response was “yes”, we define surface water supply for irrigation to be reliable; otherwise, it was seen as being unreliable. Specifically, in the survey, we asked village leaders that, in each of the past 3 years (2010–2012), what percentage of irrigated crop-sown areas could not get surface water when needed.2
In addition to the information on the supply reliability of surface water irrigation, following information was collected: (i) Village socio-economic characteristics: such as total cultivated land and number of population in the village. (ii) Village physical characteristics: such as topography (plain or mountain) and soil type (sand, clay or loam). (iii) Rural irrigation infrastructures: such as whether irrigating by the following kinds of water sources: large reservoir, middle reservoir, small reservoir, tubewell, pool, river or pump.
2.2 Secondary climate data
In the study, climate data are offered by China's National Meteorological Information Center. We assume that both temperature and precipitation were homogenous within the county, so we use county level climate data. However, in the 37 sampled counties, only 23 counties contain national meteorological stations. In order to obtain relative climate data for other counties, we use the spatial interpolation method proposed by Thornton et al. (1997). More details about secondary climate data introduction can be seen in another paper of our team (Li, 2017).
All variables' descriptive statistics are displayed in Table A3.
3.1 Climate change in the past 30 years
What is the characteristic of climate change for sample area in long run? Figure 1a reflects the trend of average temperature3 changes of nine provinces related in this research in the past 30 years. Remarkably, there is an increasing trend and it is statistically significant (the method of significance test is t-test). This in fact is highly consistent with many other scholar's study results, for instance, Ding et al. (2006) pointed that temperature has a most remarkable increase in recent 50 years. In our sample area, the annual average temperature increases about 0.6∘ in the past 30 years. What' more, fluctuations of annual average temperature are apparent, which reflects that the inter-annual temperature changes are very intensive.

Figure 1Change of annual temperature and precipitation in the last 30 years (1981–2010): (a) Change of annual temperature; (b) Change of annual precipitation. Data sources: National Meteorological Information Center in China.
In regard to annual total precipitation, changes are not obvious. As shown in Fig. 1b, the average annual total precipitation changes appear slightly upward trend and it is statistically insignificant. But the fluctuation of it is much more remarkable, which implies that the inter-annual variability of precipitation may be obvious for a long time.
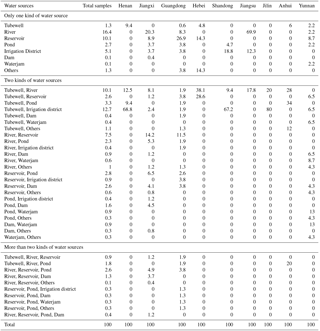
Table 1Percentage of villages using various irrigation sources in the sample regions (%).
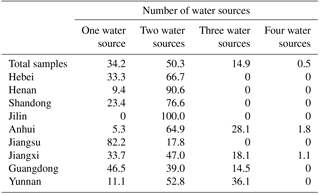
Data sources: Authors' survey.
3.2 Rural irrigation infrastructures of surface water irrigation
As shown in Table 1, distributions of rural water infrastructures are different by province. Totally, there are 34.2 % villages using one water source, 50.3 % using two water sources, 14.9 % using three water sources and only 0.5 % using four water sources. Specifically, in Jilin Province, all sample villages are using two water sources for irrigation. In Henan Province, there are 90.6 % villages that using two water sources and others are all using one water source. Situation in Hebei and Shandong is similar. While in Jiangsu, villages that using one water source (82.2 %) are much more than that using two water sources (17.8 %). For Guangdong and Yunnan, numbers of water sources farmers use are 1 to 3. For Jiangxi and Anhui, numbers of water sources farmers use are 1 to 4, although percentages of villages using four water sources are only 1.1 and 1.8 % respectively. More details about distributions of water sources in sample regions of this study are displayed by Table A4.
Table 2Supply reliability of surface water irrigation over 3 years by province in China.
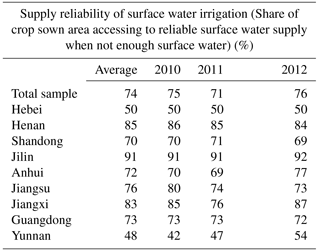
Data sources: Authors' survey.
3.3 Supply reliability of surface water irrigation
Through Table 2 we can see that, on average the total reliability of surface water is 74 %. Jilin, Henan and Jiangxi own relatively higher reliability with 91, 85 and 83 %. The worst appears in Yunnan, with 48 % only; and next is in Hebei, with 50 %. For other four provinces (Shandong, Jiangsu, Anhui, Guangdong), the supply reliability of surface water irrigation is among 72–76 %. Besides, through the past 3 years, data shows that in total sample, there exists a little fluctuation of the supply reliability of surface water irrigation with changes from 75 to 71 % , and then from 71 to 76 %. In terms of each province, Jiangxi appears a remarkable fluctuation with the supply reliability of surface water irrigation changing from 85 to 76 %, and then from 76 to 87 % during the past 3 years. The reason for this remarkable fluctuation is that, in 2011, in almost 70 % area in Jiangxi it happened drought damage. So the supply reliability of surface water irrigation in 2011 decreased greatly. Similar but slighter fluctuation also appears in Anhui and Henan. What's more, there appears a remarkable rising trend in Yunnan, with the supply reliability of surface water irrigation changing from 42 % in 2010 to 54 % in 2012. But in Jiangsu, a slightly decreasing trend can be seen with the supply reliability of surface water irrigation changing from 80 % in 2010 to 73 % in 2012. For other four provinces (Hebei, Shandong, Jilin and Guangdong), the supply reliability of surface water irrigation appears no obvious inter-annual changes.
4.1 Specification of econometric model
In this study, we specify the following four econometric models to better identify and quantify the impacts of different factors on the supply reliability of surface water irrigation:
In the four models, i and j indicate the ith village in the jth county, and the dependent variable Wij are all the same. Here Wij measures the share of irrigated crop-sown areas having reliable surface water supply.
We included similar independent variables on the right side of the four models. (i) Cij is a set of climate variables. For Model 1 and Model 2 we use annual climate variables (average annual temperature, average annual temperature squared, annual total precipitation and annual total precipitation squared), and for Model 3 and Model 4, we use seasonal climate variables (Spring/Summer/Fall/Winter temperature and precipitation, and their squared term). Considering the possible relationship between temperature and precipitation, this study also included interactive variables into Model 2 and Model 4; (ii) treating the variable whether irrigating by more than two kinds of water sources as baseline, Iij contains the following 0–1 irrigation variables: irrigating by two kinds of water sources, irrigating only by large reservoir/middle reservoir/small reservoir/tubewell/pool/river/pump; and (iii) V1−4ij is a set of five variables that measure village characteristics: whether the soil type is sand (1 = yes; 0 = no) and whether the soil type is clay (1 = yes; 0 = no)(the baseline is loam); landform (1 if the village is located in plain, 0 otherwise) (we predict that plain is a better geographical condition than mountain for getting surface water), arable area per person (ha) and population (we assume that the two variables are related to water demand and then influences water reliability).
The models also include a set of dummy variables Pi to control for the impact of regional characteristics that do not change over time but might affect water reliability. Leaving one of them, Yunnan province, as the default category, each model has eight province dummy variables. Besides, in the four models, β1−β4, , λ1−λ4, and φ1−φ4 are the parameters to be estimated; αij, ωij, θij and δij are the constant. εij, Πij,ζij and μij are random error terms, and are all assumed to be subjected to independent identical distribution.
Tobit model (or censored regression model) are used to estimate the determinants of the supply reliability of surface water irrigation in this study. More introductions about Tobit model can be found in another paper of our team (Li, 2017).
4.2 Estimation results
All four models above perform well. The pseudo R2 values of the four Tobit models are among 0.1361–0.2067, which are reasonably high values for multivariate analysis based on cross-sectional data. Moreover, among all the models, the signs of most climate variables, rural irrigation infrastructures and other control variables were statistically significant and also highly consistent with our expectation.
Table 3Marginal effects of the determinants of the supply reliability of surface water irrigation from regression results of annual climate variables model.
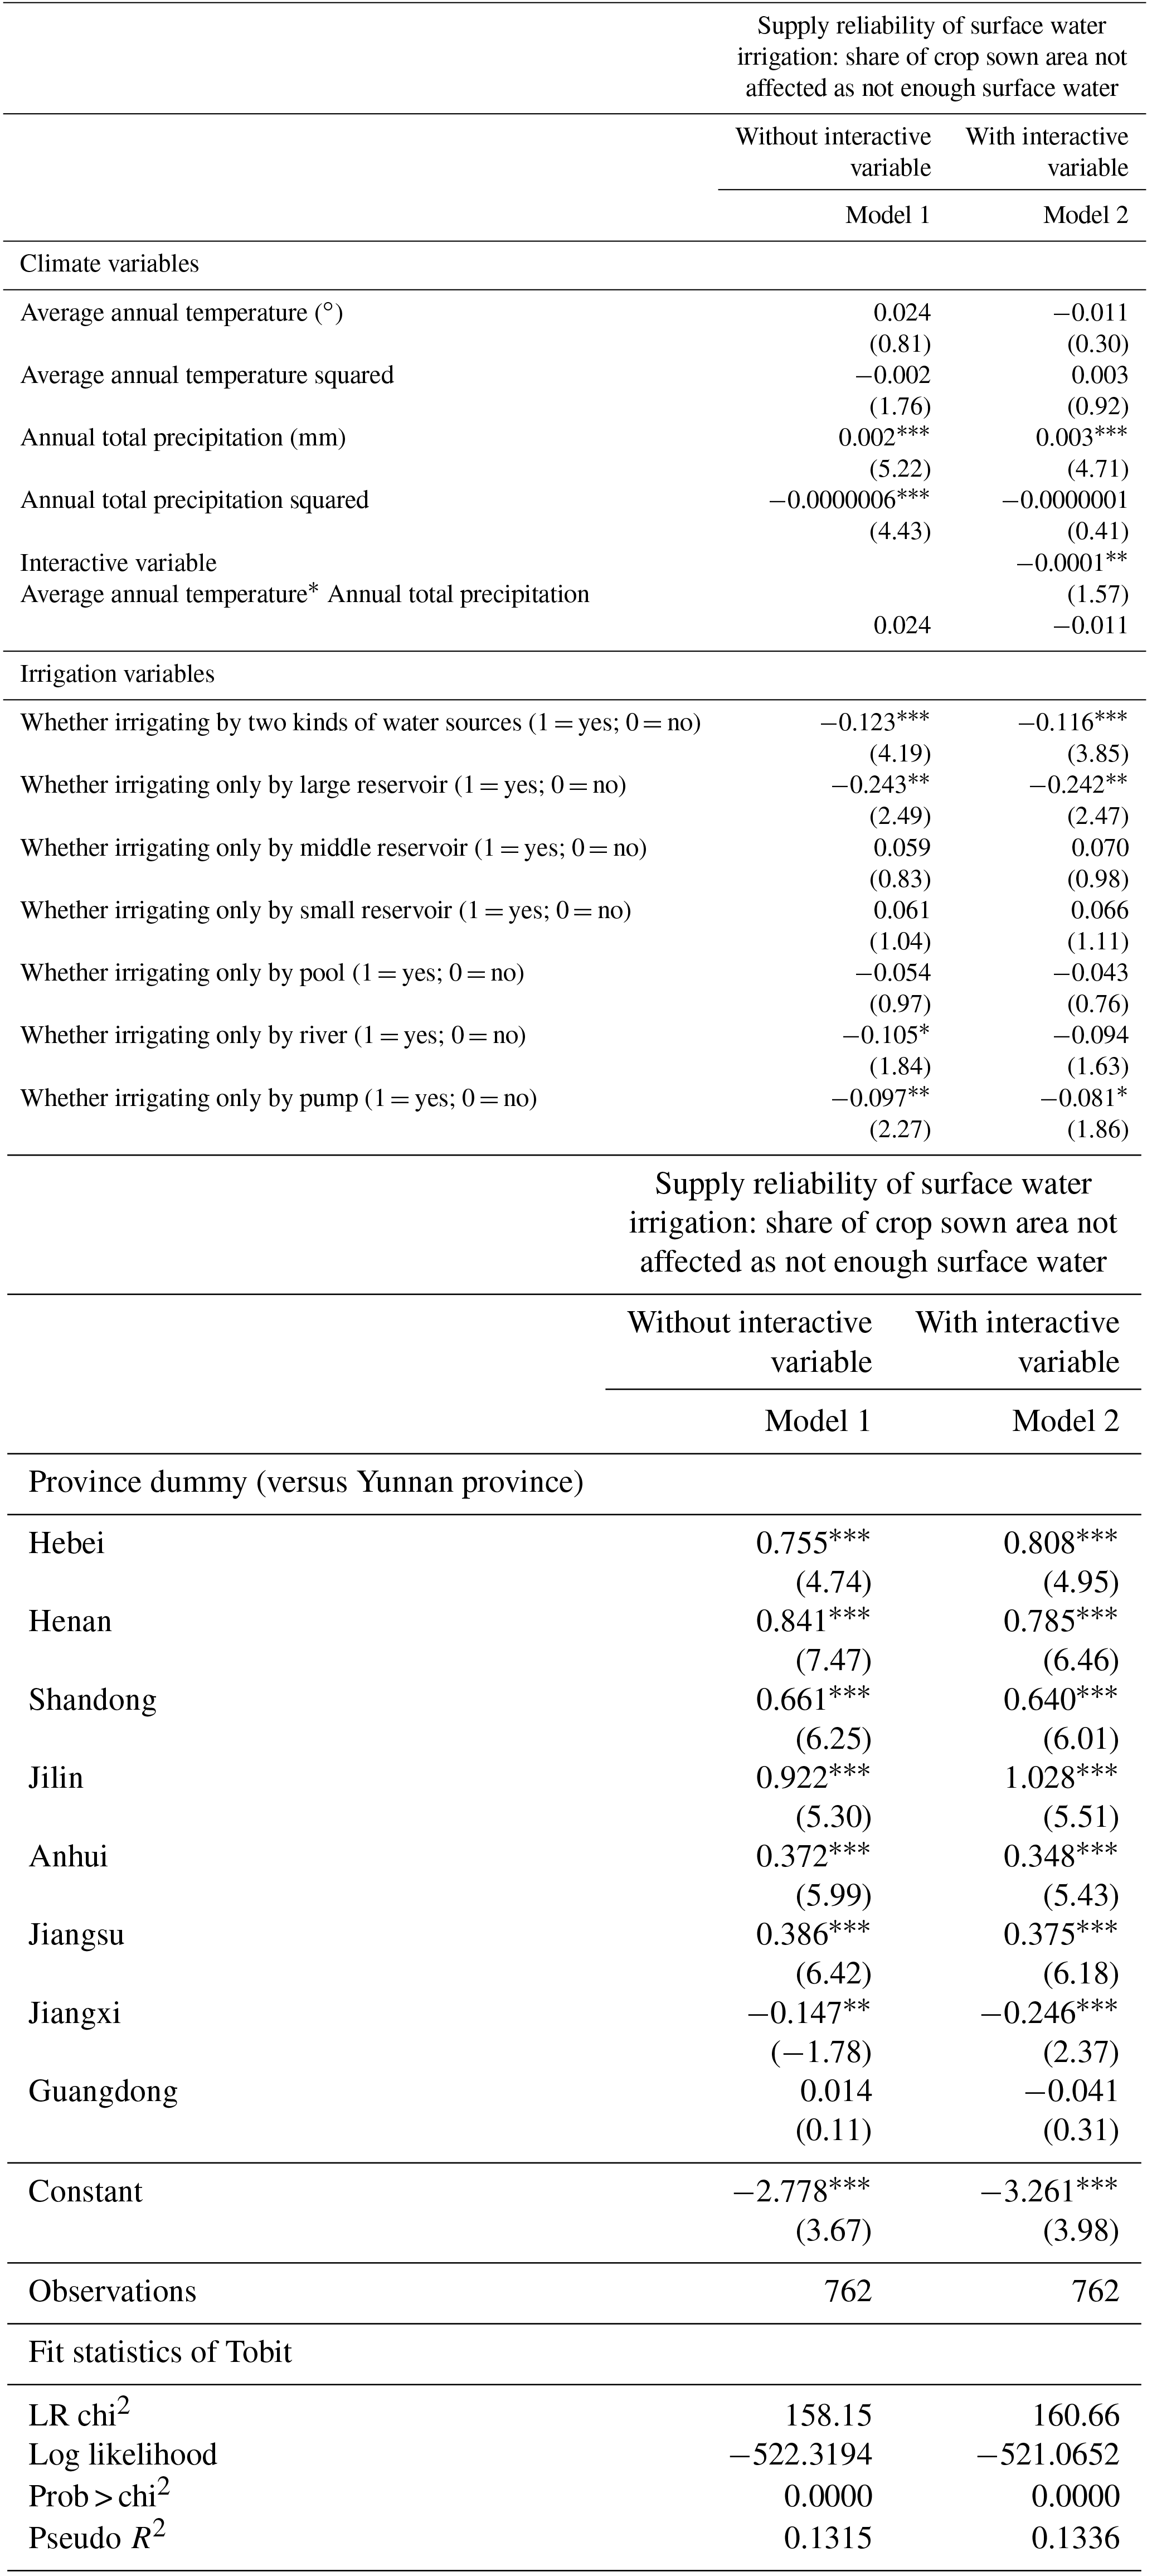
Absolute t statistics in parentheses. ∗ p < 0.10, p < 0.05, p < 0.01.
4.2.1 Influence of annual temperature and precipitation on the supply reliability of surface water irrigation
Estimation results show that, average annual temperature was statistically insignificant at the 10 % level (Table 3). But for annul total precipitation, the first degree term is positive and significant, and the quadratic term is negative and significant in the model without interactive variable. And the turning point is 1667 mm which means that as to the result of the model without interactive variable, when the quantum of rainfall is less than 1667 mm, the supply reliability of surface water irrigation will be increased with increasing precipitation, and otherwise, the supply reliability of surface water irrigation will be decreased with increasing precipitation. However, with interactive variable, the first degree term is positive and significant, but the quadratic term is negative and insignificant, and the coefficient of the climate interactive variable is negative and significant. This indicated that after considering the correlation between temperature and precipitation, if both temperature and precipitation increase simultaneously, the supply reliability of surface water irrigation will be significantly reduced. Or in other words, even having higher precipitation, if the temperature is also higher, the supply reliability of surface water irrigation will be lower.
Table 4Marginal effects of the determinants of the supply reliability of surface water irrigation from regression results of seasonal climate variables model.
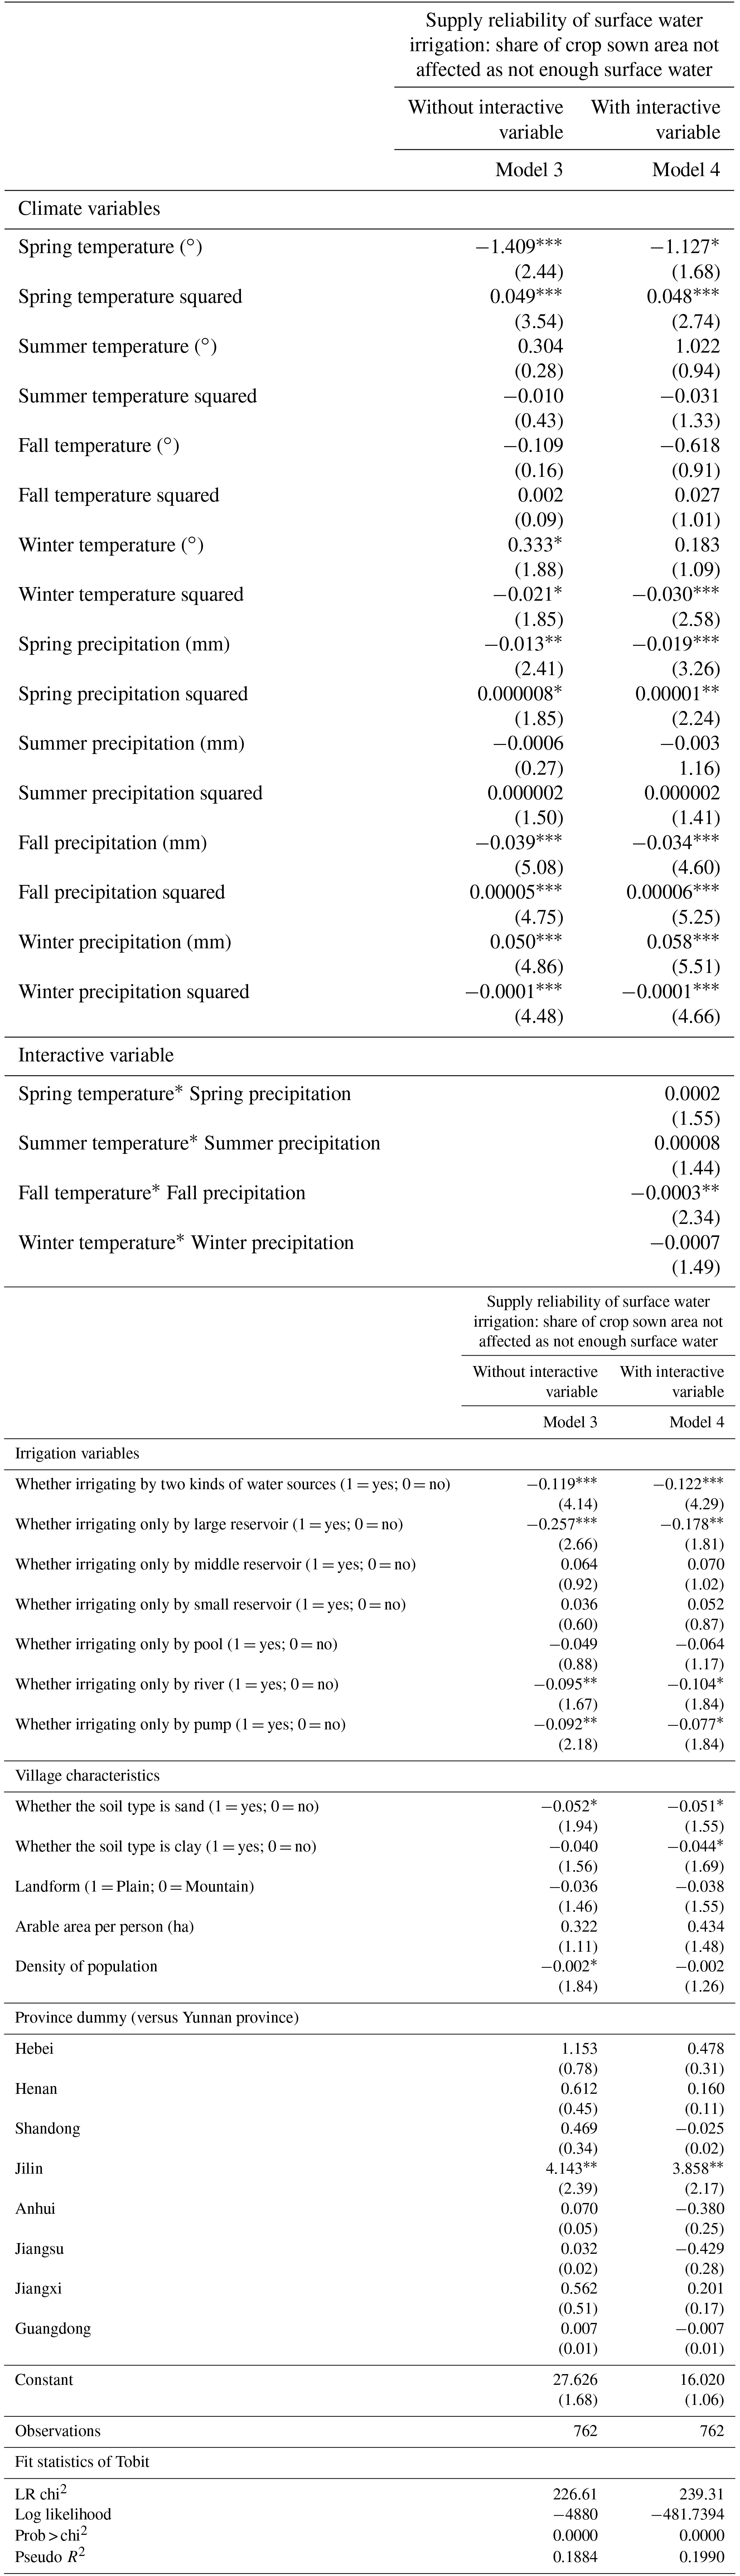
Absolute t statistics in parentheses. ∗ p < 0.10, p < 0.05, p < 0.01.
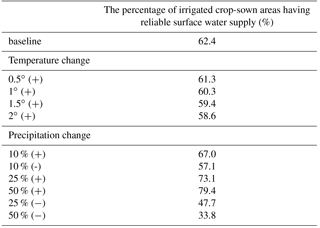
Table 5Change in supply reliability of surface water irrigation due to climate change in the future.
Data sources: Authors' survey.
What's more, keeping the constant of other factors, if we consider the interactive and non-interactive variables together, we can get the separate impacts of annual temperature or precipitation on supply reliability of surface water irrigation. As shown in Table 5, increasing temperature by 0.5∘ will reduce the supply reliability of surface water irrigation by 1.1 % (reducing from 62.4 to 61.3 %). If the temperature continues to increase, the supply reliability will be further reduced. In the future, if the temperature increases by 2∘, the supply reliability will be reduced by 3.8 % (reducing from 62.4 to 58.6 %). Besides, increasing precipitation will result in increase of supply reliability. For example, when precipitation increases by 10 %, the supply reliability can be increased by 4.6 % (increasing from 62.4 to 67.0 %), when precipitation increases by 25 %, the supply reliability can be increased by 10.7 % (increasing from 62.4 to 73.1 %), when precipitation increases by 50 %, the supply reliability can be increased by 17.0 % (increasing from 62.4 to 79.4 %). However, reducing precipitation by 10 % will result in reduction of supply reliability by 5.3 % (reducing from 62.4 to 57.1 %), reducing precipitation by 25 % will result in reduction of supply reliability by 14.7 % (reducing from 62.4 to 47.7 %), and reducing precipitation by 50 % will result in reduction of supply reliability by 28.6 % (reducing from 62.4 to 33.8 %). In summary, on the average, temperature is negatively related with the supply reliability of surface water irrigation; but precipitation positively influences the supply reliability of surface water irrigation.
4.2.2 Influence of seasonal temperature and precipitation on surface water supply reliability
As to seasonal climate variables, let's first discuss temperature variables. For spring temperature, the first degree term is negative and significant, the quadratic term is positive and significant (Table 4). So, the impact of spring temperature on the supply reliability of surface water irrigation presents a u-shape. And the turning point is 14.4∘/11.7∘ in the model without/with interactive terms. This means that the change trend of marginal effect is first downward (when temperature is below 14.4∘ in the model without interactive terms or 11.7∘ in the model with interactive terms) and then becomes upward (when temperature is beyond 14.4∘ in the model without interactive terms or 11.7∘ in the model with interactive terms). Similar analysis can be done in terms of winter temperature. Specifically, the impact of winter temperature on the supply reliability of surface water irrigation presents an inverted u-shape. And the turning point is 7.9∘/0∘ in the model without/with interactive terms. Maybe this is the reason why when we treat average annual temperature as independent variables in annual climate models (Table 3), it is statistically insignificant. As temperature in spring and winter has opposite influence on the supply reliability of surface water irrigation, they offset each other.
In terms of seasonal precipitation variables, expect summer precipitation, other three seasonal precipitation variables are all statistically significant, not only the first degree term but also quadratic term. Specifically, for spring and fall precipitation, the first degree terms are negative and quadratic terms are positive, which means that the relationship of the two displays a U-shape. For winter precipitation, the first degree term is positive and quadratic term is negative, which means that there was an inverse U-shaped relationship between the two. Specifically, the turning point of spring precipitation is 812.5 mm in the model without interactive terms or 783.8 mm in the model with interactive terms, higher than 393.6 mm (the average spring precipitation in Table A3), so the marginal effect of spring precipitation is negative. In other words, there was a negative correlation between spring precipitation and supply reliability of surface water irrigation. Similarly, the turning point of winter precipitation is 250.0 mm in the model without interactive terms or 267.9 mm in the model with interactive terms, higher than 131 mm (the average winter precipitation in Table A3), so there was a positive correlation between spring precipitation and supply reliability of surface water irrigation. As to fall precipitation, the turning point is 390 mm in the model without interactive terms or 327.8 mm in the model with interactive terms, and the average fall precipitation is 211. 9 mm (in Table A3), so, when fall precipitation is lower than 211.9 mm, the relationship of fall precipitation and supply reliability of surface water irrigation is positive, otherwise, the relationship of fall precipitation and supply reliability of surface water irrigation is negative.
4.2.3 Influence of rural irrigation infrastructure and other control variables on the supply reliability of surface water irrigation
Results of four models show that, based on irrigating by more than two kinds of water sources, the coefficients of most other rural irrigation infrastructure are statistically significant with negative sign. This means that, most rural irrigation infrastructures are playing statistically significant roles in the supply reliability of surface water irrigation. And among all of them, the role of the water source, more than two kinds of water sources, is a most obvious one. Specifically, the coefficient of two kinds of water resources is statistically significant in each model. And the coefficients are −0.123, −0.116, −0.119 and −0.122 respectively in four models (Tables 3 and 4). This means that, in the case of all other conditions remaining unchanged, compared with irrigating by more than two kinds of water sources, if farmers irrigate by two kinds of water sources, the share of irrigated crop-sown areas having reliable surface water supply will decrease by 11.6–12.3 %. Similarly, if farmers irrigate by large reservoir/river/pump, the share of irrigated crop-sown areas having reliable surface water supply will decrease by 8.1–11.1/10.5–12.4/24.2–25.2 %. Besides, different from all water infrastructures discussed above, the roles of middle reservoir, small reservoir and pool in the supply reliability of surface water irrigation are statistically insignificant. The coefficients of middle and small reservoirs are positive, and the coefficient of pool is negative. This probably means that, compared with more than two water sources, middle reservoir and small reservoir are playing more significant roles and pool is playing a less significant role in the supply reliability of surface water irrigation, but these results are statistically insignificant. Or this maybe indicates that, keeping all other conditions unchanged, compared with irrigating by more than two kinds of water sources, irrigating by middle reservoir, small reservoir or pool, farmers' share of irrigated crop-sown areas with reliable surface water supply has no significant difference.
What's more, some physical and socio-economic conditions of villages are also closely related to the supply reliability of surface water irrigation. For instance, in terms of population, its coefficients in all models are all negative and statistically significant with small numerical value. Specifically, with all other conditions unchanged, if increase one person in one hectare, the supply reliability of surface water irrigation will decrease by about 0.2 %. Besides, in annual climate models, the coefficients of arable area per person are both positive and statistically significant at the 10 % level. Maybe this is because that, surface water usually can concentrate to supply with large quantity, so, when we assume other conditions unchanged, if arable area per person increase, the share of irrigated crop-sown areas having reliable surface water supply will not decrease but increase. What's more, in models with seasonal climate variables, the coefficients of whether the soil type is sand are both negative and statistical significant at the 10 % level. With other conditions unchanged, comparing to villages with loam, the supply reliability of surface water irrigation of villages with sand, will decrease about 5.1 % in the model without interactive terms or 5.2 % in the model with interactive terms (Table 4). And the supply reliability of surface water irrigation of villages with clay (comparing to villages with loam) will decrease 4.0 % in the model without interactive terms or 4.4 % in the model with interactive terms (Table 4).
Finally, the supply reliability of surface water irrigation also differs by province, especially in models with annual climate variables. As shown in Table 3, leaving Yunnan Province as baseline, the coefficient of each other province is statistically significant, except Guangdong province. But for models with seasonal climate variables, except Jilin Province, the coefficient of each other province is statistically insignificant (Table 4).
Based on nine-province large-scale field surveys in China, this study mainly examines the status of current surface water supply reliability and identifies how climate change and rural water infrastructures influence it.
Firstly, through descriptive analysis, we conclude: on average the total reliability of surface water is 74 %. Jilin, Henan and Jiangxi own relatively higher reliability with 91, 85 and 83 %. The worst appears in Yunnan, with 48 % only. And there exists a little fluctuation of the supply reliability of surface water irrigation in the past 3 years.
Secondly, through estimation results of econometric models, we conclude: (a) Average annual temperature was statistically insignificant, as temperature in spring and winter has opposite influence on the supply reliability of surface water irrigation, they offset each other. But as for annul total precipitation, supply reliability of surface water irrigation will be increased with increasing precipitation. However, after considering the correlation between temperature and precipitation, if both temperature and precipitation increase simultaneously, the supply reliability of surface water irrigation will be significantly reduced. (b) In the future, keeping the constant of other factors, increasing temperature by 0.5∘ will reduce the supply reliability of surface water irrigation by 1.1 %. At the same time, when precipitation increases by 10 %, the supply reliability can be increased by 4.6 %, when precipitation increases by 25 %, the supply reliability can be increased by 10.7 %. Reducing precipitation by 10 % will result in reduction of supply reliability by 5.3 %, reducing precipitation by 25 % will result in reduction of supply reliability by 14.7 %. (c) In terms of seasonal precipitation variables, expect summer precipitation, other three seasonal precipitation variables are all statistically significant, not only the first degree term but also quadratic term. Specifically, there was a negative correlation between spring precipitation and supply reliability of surface water irrigation. There was a positive correlation between spring precipitation and supply reliability of surface water irrigation. When fall precipitation is lower than 211.9 mm, the relationship of fall precipitation and supply reliability of surface water irrigation is positive, otherwise, the relationship of fall precipitation and supply reliability of surface water irrigation is negative.
Thirdly, compared with irrigating by more than two kinds of water sources, if farmers irrigate by two kinds of water sources, the supply reliability of surface water irrigation will decrease by 11.6–12.3 %. Similarly, if farmers irrigate by large reservoir/river/pump, the share of irrigated crop-sown areas having reliable surface water supply will decrease by 8.1–11.1/10.5–12.4/24.2–25.2 %.
Finally, some physical and socio-economic conditions of villages are also closely related to the supply reliability of surface water irrigation. And the supply reliability of surface water irrigation also differs by province, especially in annul climate models.
The underlying research data in the paper contains field data and secondary climate data. The field data in this study was collected by our research team from a nine-province field survey during 2012 and 2013. The nine provinces contain six Northern provinces (Hebei, Henan, Shandong, Jiangsu, Anhui and Jilin) and three southern provinces (Jiangxi, Guangdong and Yunnan). Based on local water resources, climate condition and economic development level, the nine provinces are firstly collected from the whole nation, and then the following strategies were taken to select samples. Climate data are offered by China's National Meteorological Information Center. Both the two kinds of data are confidential to the public.
Table A1Sample distribution of this study.
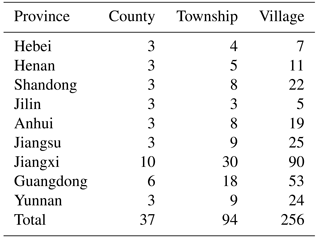
Data sources: Authors' survey.
Table A2Sample distribution based on types of water source.
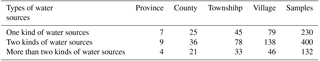
Data sources: Authors' survey.
Table A3Statistical descriptions of major variables.
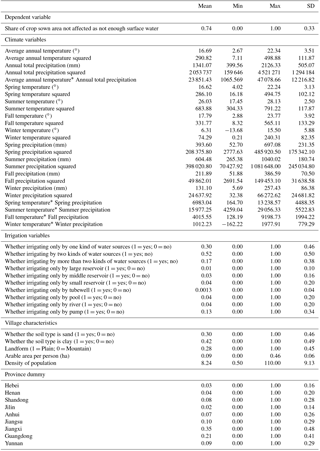
Note: Observation number is 762.
Table A4Percentage of villages using kinds of water sources in sample regions (%).
Note: others contain rain gutter, fountain and sewage disposal. Data sources: Authors' survey.
The authors declare that they have no conflict of interest.
This article is part of the special issue “Innovative water resources management – understanding and balancing interactions between humankind and nature”. It is a result of the 8th International Water Resources Management Conference of ICWRS, Beijing, China, 13–15 June 2018.
We acknowledge the financial support from National Natural Sciences
Foundation in China (71161140351, 91325302 and 71333013) and Chinese Academy
of Sciences (Y02015004 and KSZD-EW-Z-021-1).
Edited by: Bo Pang
Reviewed by: two anonymous referees
Chen, H., Wang, J., and Huang, J.: Evaluation of Drought Resisting Effects of Rural Irrigation Infrastructure: Based on Empirical Study in Seven Provinces in China, Journal of Natural Resources, 27, 1656–1365, 2012 (in Chinese).
Dalla, V. M., Marcomini, A., and Codato, E.: Climate change influence on POPs distribution and fate: A case study, Chemosphere, 67, 1287–1295, 2007.
Delpla, I., Jung, A. V., Baures, E., Clement, M., and Thomas, O.: Impact of climate change on surface water quality in relation to drinking water production, Environ. Int., 35, 1225–1233, 2009.
Ding, Y., Ren, G., and Shi, G.: National assessment of climate change (I): The history and future trends of China's climate change, Progress of Climate Change Research, 2, 3–8, 2006 (in Chinese).
Hao, Z., Li, L., Wang, J., Wang, Z., and Shi, X.: Impact of Climate Change on Surface Water Resources, Earth Science-Journal of China University of Geosciences, 32, 425–433, 2007.
He, X. and Guo, L.: The stakeholders of farmland water conservancy and their cost-benefit analysis – based on the survey of farmland water conservancy in Shayang County, Hubei Province, Management World (Monthly), Phase 7, 86–99, 2010.
IPCC: Climate Change 2014, Impacts, Adaptation, and Vulnerability. Part A: Global and Sectoral Aspects. Contribution of Working Group II to the Fifth Assessment Report of the Intergovernmental Panel on Climate Change, Cambridge, Cambridge University Press, 2014.
Jia, X.: Effectiveness of irrigation supply from the perspective differential farms' income, Dissertation for Doctor Degree, Northwest A&F University, 73–74, 2016.
Lamon, L., Valle, M. D., Critto, A., and Marcomini, A.: Introducing an integrated climate change perspective in POPs modeling, monitoring and regulation, Environ. Pollu., 157, 1971–1980, 2009.
Li, Y.: Impacts of Climate Change on Reliability of Irrigation Wate Supply and Responses of Cropping Pattern-Empirical Research Based on 9 Provinces of China, Dissertation for PHD, The university of Chinese Academy of Science, 2017 (in Chinese).
Long, H., Mao, L. Q., Che, Z. X., and Yang, G. W.: Impact on water resources in Yellow River with climate change, J. Water Resour, 17, 74–77, 2006 (in Chinese).
Ma, L.: Performance Analysis of China's Rural Water Conservancy Irrigation Facilities Investment – the Influence of the Farmers' Income per acre, for example, Chinese Rural Economy, 4, 55–62, 2008.
MWR (Ministry of Water Resources): China Water Resources Yearbook, Ministry of Water Resources, Beijing, China, 2011.
NBSC (National Bureau of Statistics in China): China Statistical Yearbook, China Statistics Press, Beijing, China, 2015.
Prowse, T. D. and Belataos, S.: Climate change, flow regulation and land-use effects on the hydrology of the peace-athabasca-slave system; findings from the north rivers ecosystem initiative, Environ. Monit. Assess., 113, 167–197, 2006.
Piao, S., Ciais, P., Huang, Y., Shen, Z., Peng, S., Li, J., Zhou, L., Liu, H., Ma, Y., Ding, Y., Friedlingstein, P., Liu, C., Tan, K., Yu, Y., Zhang, T., and Fang, J.: The impacts of climate change on water resources and agriculture in China, Nature, 467, 43–51, 2010.
Thornton, P. E., Running, S. W., and White, M. A.: Generating surfaces of daily meteorological variables over large regions of complex terrain, J. Hydrol., 190, 214–251, 1997.
Trenberth, K. E., Dai, A., Rasmussen, R. M., and Parsons, D. B.: The changing character of precipitation, B. Am. Meteorol. Soc., 84, 1205–1217, 2003.
Vanvliet, M. T. H.: Impact of summer droughts on the water quality of the Meuse river, J. Hydrol., 353, 1–7, 2008.
Wang, J., Huang, J., and Yan, T.: Impacts of Climate Change on Water and Agricultural Production in Ten Large River Basins in China, J. Integr. Agr., 12, 1267–1278, 2013.
Wang, J., Huang, Q., Huang, J., and Rozelle, S.: Managing Water on China's Farms for a Sustainable Future: Institutions, Policies and the Transformation of Irrigation under Scarcity, Elsevier, 14–16, 2016.
Wang, J., Yanrong, L., Jikun, H., Tingting, Y., and Tianhe, S.: Growing water scarcity, food security and government responses in China, Globle Food Security, 1, 9–17, 2017.
Wang, X.: Supply and management of Public Irrigation Infrastructure, Journal of Shanxi Agricultural University (Social Science Edition), 14, 936–941, 2015.
Wilby, L., Whitehead, P. G., Wade, A. J., Butterfield, D , Davis, R. J., and Watts, G.: Integrated modeling of climate change impacts on water resources and quality in a lowland catchment: River Kennet, UK, J. Hydrol., 330, 204–220, 2006.
Xia, J., Cheng, S., Hao, X., Xia, R., and Liu, X.: Potential impacts and challenges of climate change on water quality and ecosystem: Case studies in representative rivers in China, Journal of Resources and Ecology, 11, 31–35, 2010.
Xia, X., Wu, Q., and Mou, X.: Advances in impacts of climate change on surface water quality, Advances in Water Science, 23, 124–133, 2012 (in Chinese).
Yang, Y., Wang, J., and Chen, H.: “Assessment on water supply reliability of different irrigation water sources. China Population”, Resources and Environment, 22, 1–4, 2012.
Zhu, Y. and Wang, L.: Analysis on different income level' farmers' demand willingness to farmland water conservancy facilities – based on Field Data from Shaanxi and Henan, Rural Economy in China, 76–87, 2014 (in Chinese).
Zhang, J. and Wang, G.: The Impacts of Climate Change on Hydrology and Water Resources, Science Press, 138–181, 2007 (in Chinese).
Zhang, J., Wang, G., He, R., and Liu, C.: Variation trends of runoffs in the Middle Yellow River basin and its response to climate change, Advances in Water Science, 20, 153–158, 2009 (in Chinese).
Not all villages used surface water for irrigation in all 3 years (2010–2012), although we have 256 villages totally, some villages did not irrigate by surface water during 2010–2012 and we have not included these villages into our analysis; therefor, there are 256 villages in the analysis for 3 years and the total sample is 762, but not .
We ask village leaders the following question: In your village, when crops need surface water irrigation, how much percentage of irrigated crop sown areas that could not get sufficient and timely surface water supply during 2010–2012? Based on this information, we can get indicator of the supply unreliability of surface water irrigation (share of irrigated crop-sown areas having access to an unreliable surface water supply), then using 1 to minus this number and we can get the indicator of the supply reliability of surface water irrigation.
The method for calculating the spatial average value is as follows: first, calculate the average value of each month's temperature of all samples; second, calculate the annual average value, which is 12-month average.