the Creative Commons Attribution 4.0 License.
the Creative Commons Attribution 4.0 License.
 | 18 Dec 2018
Remote sensing-based soil water balance for irrigation water accounting at the Spanish Iberian Peninsula
Jesús Garrido-Rubio
Alfonso Calera Belmonte
Lorena Fraile Enguita
Irene Arellano Alcázar
Mario Belmonte Mancebo
Isidro Campos Rodríguez
Raquel Bravo Rubio
Temporal series maps of irrigated areas, and the corresponding irrigation water requirements based on remote sensing, is a recognized tool contributing to water governance at different scales, from water user associations to whole river basin districts. These thematic cartographies offer a first estimation of the crop irrigation requirements, and a biophysical based approach of the temporal and spatial distribution of the crop water use in the cultivated areas. This work describes the operational application of these methodologies, providing valuable information for water governance and management purposes. The basic products obtained in the whole Spanish part of the Iberian Peninsula during the period 2014–2017 were: (i) annual maps of irrigated crops based on time series of multispectral satellite imagery; and (ii) the direct remote sensing-based water accounting, by quantifying agricultural water flows (e.g. rainfall, irrigation, evapotranspiration, drainage and recharge), through a remote sensing-based soil water balance. Hence this paper provides a remote sensing based water accounting approach, which relies on dense time series of multispectral imagery acquired by the multisensor constellation arranged by Landsat 8 and Sentinel-2 satellites, jointly with meteorological data and agronomic knowledge. Then, based on these purpose and approach, annual and monthly maps of net irrigation water requirements have been elaborated at the most practical spatial and temporal scales for water governance purposes over big areas such river basin districts. This work summarizes the methodologies used and discuss the technical and non-technical feasibility of the proposed approach.


The monitoring of irrigated areas and the accounting of their water use are essential instruments for European policies, in order to promote an efficient and sustainable use of water, according to the Water Framework Directive, WFD (2000/60/EC, 2000), and transposed into each country member legislation.
Monitoring of crops and their water requirements are possible through data derived from the Earth Observation, EO, combined with meteorological information. The Copernicus program of the European Union, through the European Space Agency (ESA), operates a constellation of Sentinel satellites, which provide data from the Earth's surface at a spatial resolution and a temporal frequency unprecedented in the history of remote sensing. Consequently the Copernicus programs exhibit a great potential to perform the monitoring required by the WFD.
Aware of the great socio-economic and environmental importance of irrigation in Spain, the Ministry of Agriculture and Fisheries, Food and Environment (MAPAMA) pushes actions to improve the efficiency of water use on irrigation. Among other, through the Deputy Directorate General for Irrigation and Water Economy (SGRyEA), it makes available freely to users the information collected by the network of agrometeorological automatic stations, known as the SIAR network (Agroclimatic Information System for Irrigation). A step further is the SPIDER-SIAR 2014–2017 project, which joins the potential provided by the EO programs for the spatial and temporal description of the vegetation cover, to the agrometeorological information provided by the SIAR network, all for the knowledge of irrigated areas and their water use in the area of mainland Spain.
Table 1SPIDER-SIAR products and scope of its services regarding different water user types.
The main objectives of the SPIDER-SIAR project are, (1) improving water efficiency, and (2) better managing water resources by public authorities through mapping irrigated areas, estimating surface cover, and determining their net irrigation water requirements (NIWR) in the mainland Spain (2014–2017 period). Spanish main irrigation features are summarized as a surface that covers around 3.7 Mha, with wheat, barley, maize, vineyard, olive, fruit trees, and citric as main crops, and mainly irrigated by drip and sprinkle systems (around 75 %). Regarding such spatial extent, SPIDER-SIAR mainly uses a time series of satellite images of the constellation Sentinel-2A (S2A), Sentinel-2B (S2B) and Landsat 8 (L8), together with agrometeorological information of the SIAR network and ancillary information.
Methodology and materials used allow obtaining results from a minimum area of 0.1 ha, based on a daily temporal scale, and able to monitor all typologies of agricultural surfaces. These primary results are suitable to aggregate into other scales of spatial and temporal interest.
The beneficiaries of the project are at the same time water users and water managers, who can share the data at their different administrative scales, like irrigation communities, river basin authorities, regions, nation-wide and European levels, which deal with the planning of water resources in the medium and long term, through the execution and monitoring of river basin management plans (RBMPs). All the products can be accessed freely through a WebGIS platform called SPIDER-SIAR. Table 1 details the products and relates them to their potential users.
3.1 Time series of satellite images
The images used are those acquired, in the area of the mainland Spain, along the period 2014 to 2017, by the multispectral sensors on board the S2A, S2B and L8 platforms. The European Space Agency (ESA) and the National Aeronautics and Space Administration (NASA) from USA operate these platforms and distribute freely the images. Once those high cloud cover images have been discarded, a total number of 13 006 images were processed, of which 2437 scenes correspond to L8, 7957 granules to S2A, and 2612 granules to S2B. These images are then converted into the three basic SPIDER-SIAR products: (i) Vegetation Index (VI) time series of NDVI (Rouse et al., 1973); (ii) an appropriate colour composition images (RGB) to monitor irrigated agriculture; and iii) the biophysical crop parameter Kcb. These time series products (unless RGB) are atmospherically corrected by absolute normalization (Campos et al., 2011). Additionally, cloudy and shadows pixels were removed using L8 Quality Band and Sen2Cor algorithms for S2A and S2B. Consequently, a virtual multisensor constellation was built to provide time series of NDVI able to describe accurately the temporal evolution of the vegetation cover.
3.2 Thematic maps of irrigated land use
For mapping the irrigated crops, the approach uses the vegetation temporal evolution pattern as a basic criterion, which is well described by the temporal trajectory of the NDVI values of each pixel. Moreover, to guide spatially the classification analysis, the approach integrates multiple ancillary official sources, especially the layer of SIGPAC enclosures (Spanish national layer to attend Common Agricultural Policy System Information).
The methodology assumes that: (1) the water supply produces differences in size and duration of irrigated vegetation cover with respect to the one not; (2) time series of VI images are able to record these differences; and hence (3), decisions-tree rules can be applied to segment between irrigated and non-irrigated crops. Consequently, the knowledge about the temporal evolution of the different crop canopy cover is the essential instrument in the irrigated crops identification. It is necessary to highlight that crops that present a similar evolution both in their phenology and in soil fraction cover, will show a similar evolution in their NDVI time trajectory. In those crops that exhibits a high proportion of bare soil, especially woody crops, and in which the irrigation reaches only a supplementary value, the NDVI time series among irrigated and non-irrigated exhibits small differences.
SPIDER-SIAR annual thematic maps of irrigated areas present 9 classes in which the irrigated crops are grouped: four of these classes group the annual herbaceous crops depending on the season when the crop growing cycle occurs (spring, summer, spring-summer, and autumn-winter); four more classes are used to group woody crops (vines, olives, citrus and deciduous fruit trees); and finally, one class for crops developed under greenhouses.
3.3 Thematic maps of Net Irrigation Water Requirements (NIWR)
Thematic maps of net irrigation water requirements (NIWR) of those irrigated areas (excluding greenhouses), are estimated by carrying out a water balance in the root soil layer. This soil water balance (SWB) follows the dual coefficient approach described in the FAO56 manual (Allen et al., 1998). For each pixel, we use the time series of NDVI values to estimate the value of the Kcb, what it is called “reflectance-based crop coefficient approach” (Neale et al., 1989). We select a unique crop-independent NDVI-Kcb relationship using Eq. (1) (Campos et al., 2010), according with the real time and operational purpose at large scales (Calera et al., 2017), like other projects are dealing with, i.e. the case of California State at USA (Melton et al., 2012).
Furthermore, the use of a single equation provided some benefits for the operational monitoring of NIWR. For applications at large scales, our actual knowledge of the crop biophysical variables such as LAI and canopy resistance must be considered unknown. Note that the relationship between LAI and VI is crop dependent and strongly affected by the canopy architecture (Campos et al., 2017; Anderson et al., 2004) while the available information about land uses is restricted to general crop types (see Sect. 3.2) and difficulty improved. In addition, although the proposed relationship was originally developed for irrigated-row structured vineyard, the parameterization of the function does not differ from other relationships obtained for herbaceous crops like corn (Bausch and Neale, 1987; Gonzalez-Piqueras et al., 2004), or biomass sorghum (López-Urrea et al., 2016). In the same way, the used equation had been evaluated in bush-vines in Spain (Campos et al., 2016), vineyards in Australia (Hornbuckle, 2014), natural vegetation (Campos et al., 2013), and table grapes trained in overhead trellises system (Balbontín et al., 2017).
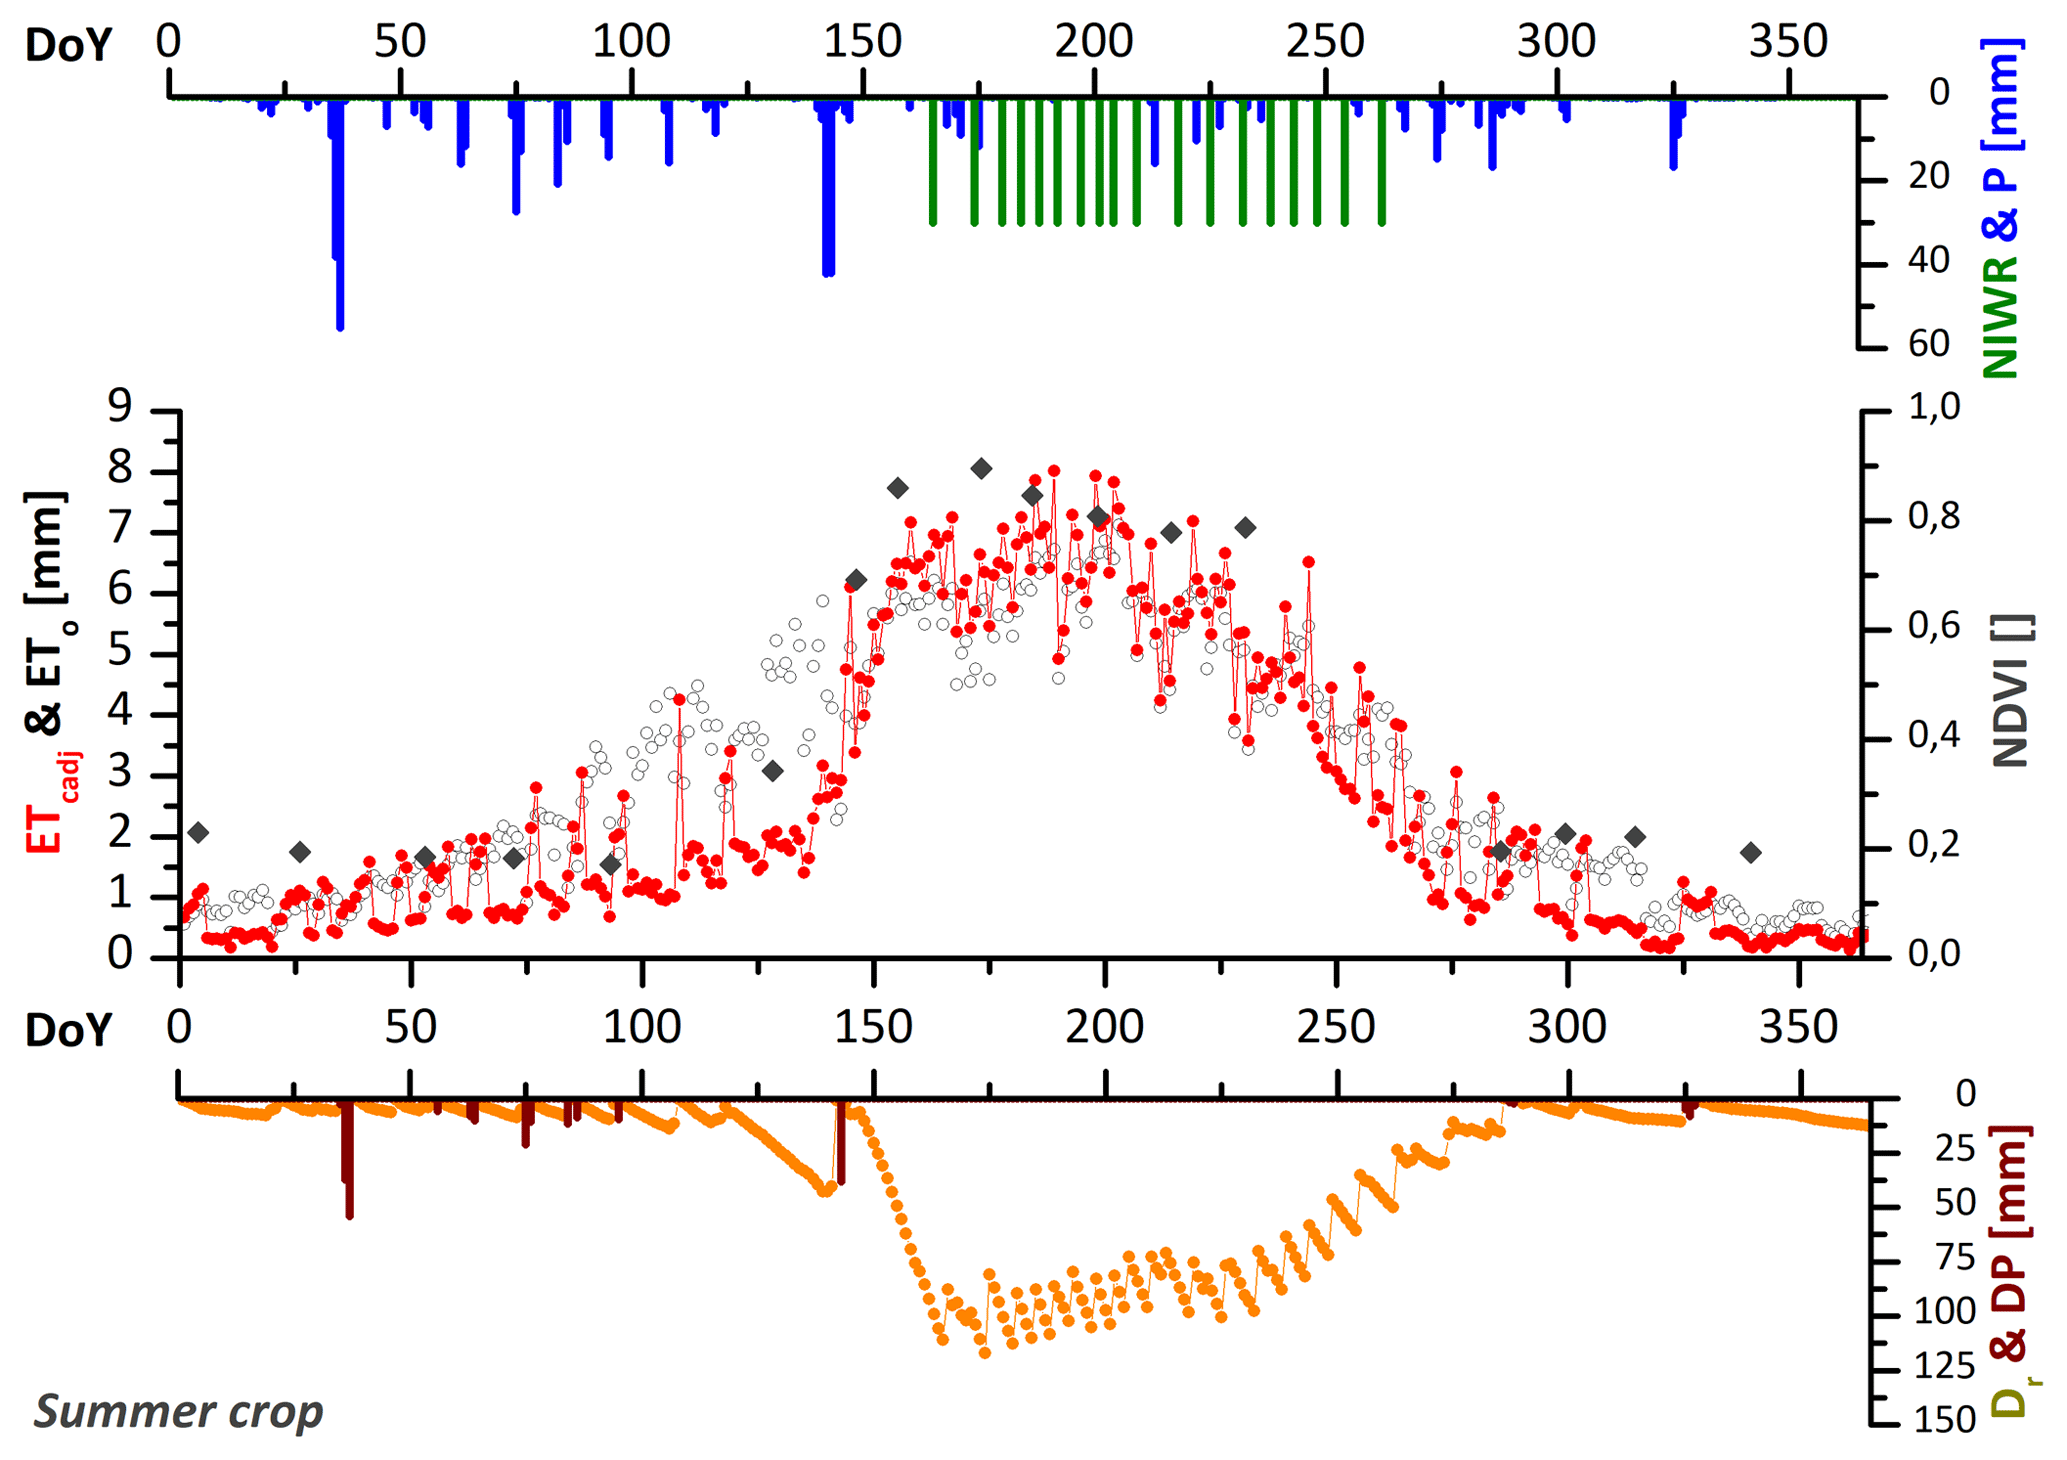
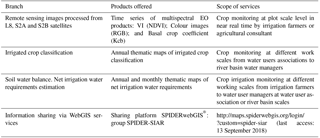
Figure 1Daily evolution of the different components estimated by the RS-SWB computed by HidroMORE® tool.
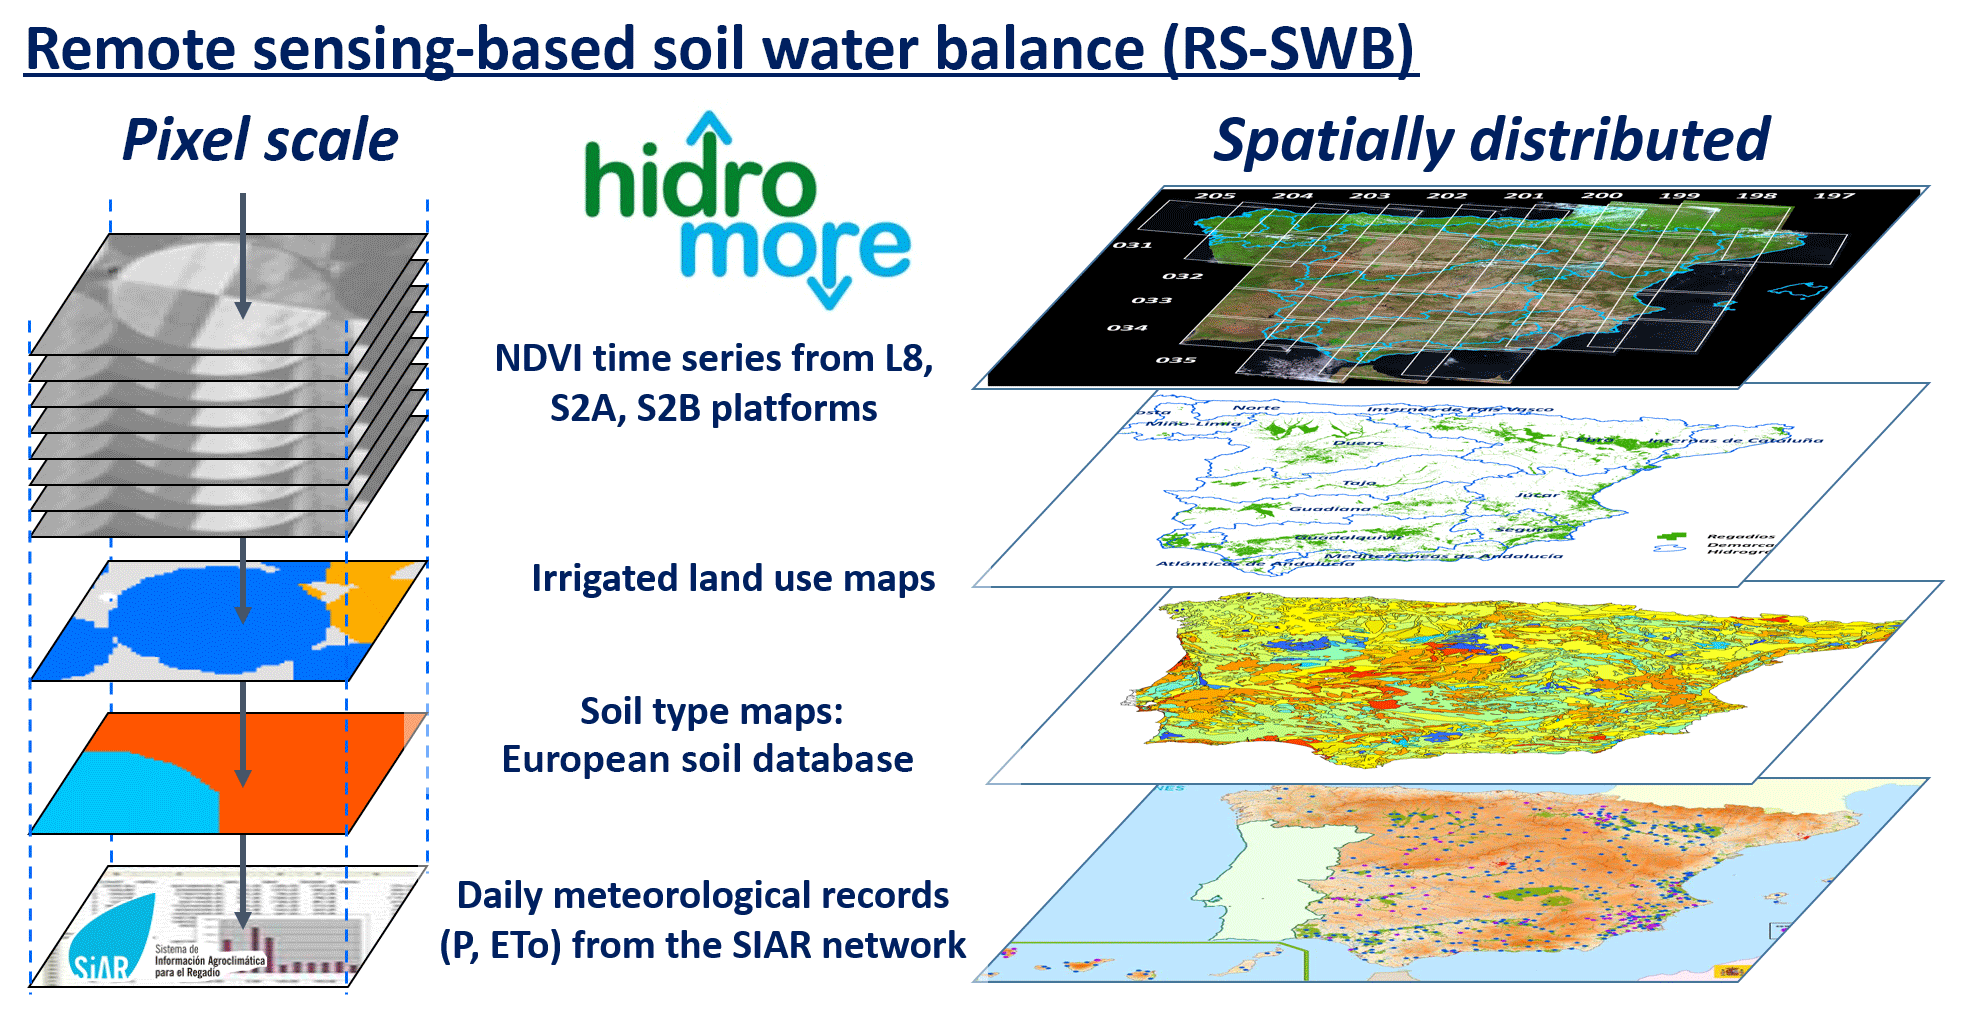
Figure 2Inputs databases used in HidroMORE® to calculate the RS-SWB at pixel scale and spatially distributed.
In parallel, and in order to obtain NIWR, daily data from meteorological stations of the dense SIAR network, which placed strategically on the irrigated areas, enable to obtain reference evapotranspiration and precipitation data maps by interpolating the raw point data. And finally in the same way, the soil water storage is a required input in the SWB, described by the Total Available Water (TAW) parameter defined as the amount of water that a crop can extract from its root zone (Allen et al., 1998). Mapping TAW utilizes soil hydraulic properties from the European Soil Database (Panagos et al., 2012), and maximum root depth, which depends in crop type and maximum allowed depth till impervious rock.
3.4 HidroMORE®, a tool for remote sensing based soil water balance (RS-SWB) over large scales
As described previously, the soil water balance turns into a RS-SWB regarding the use of dense NDVI time series, in order to monitor crop biophysical conditions. However, as the RS-SWB is perform at daily time scale, NDVI synthetic images are created, by means of linear temporal interpolation for those dates where no image is available. Furthermore, the dual crop coefficient approach applied, deals with real vegetation conditions after taking into account daily soil water content available for crops. Consequently, a daily monitoring on vegetation evolution development is afforded per each pixel, and thus, achieving local crop biophysical conditions into the soil water balance.
The tool used, able to compute such RS-SWB for the whole Spanish part of Iberian Peninsula, at pixel size scale of 10 m × 10 m, is the HidroMORE® software (Moreno et al., 2017; Torres et al., 2010). HidroMORE® estimates the NIWR that maintains the crop in optimum conditions. Crop optimum conditions means that soil water content is not allowed to be lower than a predetermined threshold, avoiding water stress, or maintaining this water stress on a controlled way, like is the case i.e. for vine grapes. Besides, computation estimates as well the other SWB components like adjusted crop evapotranspiration (ETcadj), run-off (RO), and deep percolation (DP) at same space and time scales. Figure 1 shows the computation of SWB components, for one pixel.
Inputs for HidroMORE® come from different databases (Fig. 2) like satellite images from L8, S2A and S2B platforms, meteorological daily records from the SIAR network and soil types from the European Soil Database.
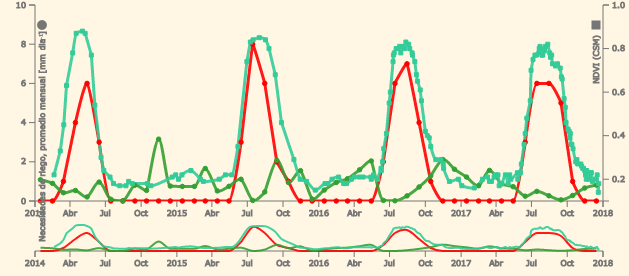
Figure 3Monthly evolution of the time series of net irrigation water requirements (red chart) and precipitation (green chart), jointly with the NDVI time series (cyan chart) along 2014–2017.
3.5 Products accessibility via WebGIS platform
Thematic maps of irrigated areas and its NIWR, are generated at pixel scale, what means a spatial resolution of 0.1 ha, and for NIWR, at daily step. For operational purposes, NIWR data are aggregated at monthly scale. All these products can be online accessed through the SPIDERwebGIS® platform. This platform allows the visualization and display of results, especially as regards the time series. The user must only include the login demo and password demo through the following link: http://maps.spiderwebgis.org/login/?custom=spider-siar (last access: 13 September 2018).
Regarding operational and water management purposes, results from the RS-SWB are aggregated to monthly and annual frequency with the sum of the results estimated at daily time scale. Selected frequency is the reference one used by water managers for governance purpose at the river basin scales. In consequence, 48 monthly thematic maps of NIRW (and other previous cited SWB components), are shown in SPIDERwebGIS® platform.
Figure 3 shows a graph taken from the WebGIS platform that plot the time series of NDVI, Precipitation and NIWR over a single pixel herbaceous irrigated class along the four study years. Therefore, water managers can study the components of the RS-SWB over their territory with temporal and spatially distributed information.
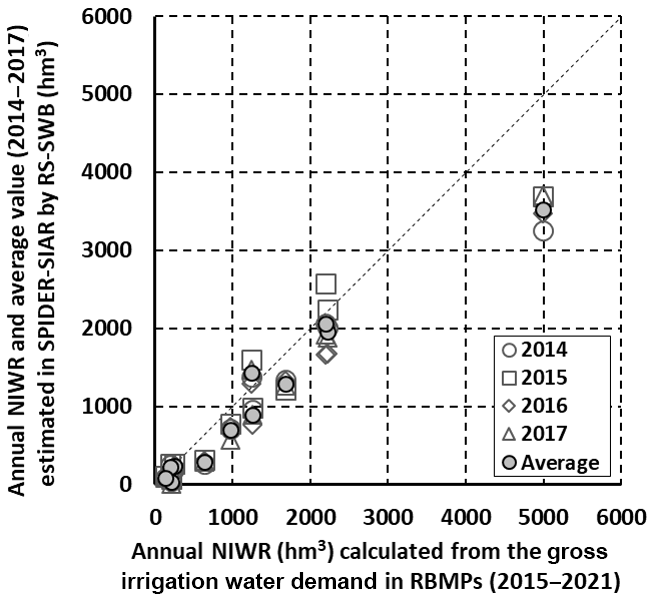
Figure 4Comparison among the RS-based NIWR and NIWR calculated from official RBMPs for the Spanish mainland along 2014–2017.
Furthermore, a first evaluation of the remote sensing based irrigation water accounting (RS-IWA) computed in the SPIDER-SIAR project is shown in Fig. 4.
After computing the annual NIWR of the four study years, a zonal statistics calculation was performed per year using the mainland Spain river basin districts perimeters extracted from RBMPs official sources. Among the statistics parameters calculated, annual average NIWR value was then converted into the total volume of NIWR per year, using the irrigated area within each river basin. Finally, the four years average value was compared with the annual gross water demand presented for the river basin water managers in the RBMPs.
Those values were collected from the monitoring and evaluation document about the called by WFD, 2nd cycle River Basin Management Plans (2015–2021), developed by the Spanish Ministry of Agriculture and Fisheries, Food and Environment (MAPAMA and CEDEX, 2017). Then, in order to compare the same irrigation water parameter, the annual gross water demand was converted in NIWR by a global coefficient of 0.65 regarding the water that finally reaches irrigated plots fields, after consider the transport, distribution and application efficiency. The global coefficient assumed, due to the lack of specific data, was selected after consulting the twelve main RBMPs, e.g. Jucar River Basin 0.55, 0.62 in case of Duero River Basin, or 0.76 for the Guadalquivir River Basin.
Figure 4 shows the result for the comparison RS-based NIWR against NIWR calculated from currently official RBMPs. In despite of the encouraging agreement on this comparison, where R2 value is around 0.95 and RMSE value is 480 hm3, further analysis will be needed to pave the way to use this technique as an instrument of water planning.
The described approach to estimate a remote sensing-based irrigation water accounting (RS-IWA), produces a thematic cartography about irrigated land use and their net irrigation water requirements, spatial and temporally distributed on suitable scales for water governance purposes. The provided information aims to increase water efficiency, help on water governance and management purposes at river basin, regional and national scale, according to the WFD development. The approach requires further analysis about the accuracy and temporal stability of the results.
Data sets and results are available through the SPIDERwebGIS® platform. The user must only include the login “demo” and password “demo” through the following link: http://maps.spiderwebgis.org/login/?custom=15 spider-siar. For further requirements please contact with corresponding author.
JGR, ACB, LFR, IAA and MBM conceived and conducted the work; JGR and ACB analysed the data; JGR, ACB and ICM wrote and review the article; and RBR and her team at The MAPAMA supervised the project and results provided for the whole period 2014–2017.
The authors declare that they have no conflict of interest.
This article is part of the special issue “Earth Observation for Integrated Water and Basin Management: New possibilities and challenges for adaptation to a changing environment”. It is a result of The Remote Sensing & Hydrology Symposium, Cordoba, Spain, 8–10 May 2018.
The authors would like to thank both reviewers for their effort to read and provide comments and suggestions, that led us to improve the content and meaning of the paper.
Edited by: Maria P. González-Dugo
Reviewed by: two anonymous referees
Allen, R., Pereira, L. S., Raes, D., and Smith, M.: Crop evapotranspiration – Guidelines for computing crop water requirements, FAO Irrigation and drainage paper 56, Irrigation and Drainage Paper No. 56, FAO, Roma, Italy, 300 pp., 1998.
Anderson, M. C., Neale, C. M. U., Li, F., Norman, J. M., Kustas, W. P., Jayanthi, H., and Chavez, J.: Upscaling ground observations of vegetation water content, canopy height, and leaf area index during SMEX02 using aircraft and Landsat imagery, Remote Sens. Environ., 92, 447–464, https://doi.org/10.1016/j.rse.2004.03.019, 2004.
Balbontín, C., Campos, I., Odi-Lara, M., Ibacache, A., and Calera, A.: Irrigation Performance Assessment in Table Grape Using the Reflectance-Based Crop Coefficient, Remote Sensing, 9, 1276, https://doi.org/10.3390/rs9121276, 2017.
Bausch, W. C. and Neale, C. M. U.: Crop coefficients derived from reflected canopy radiation – A concept, T. ASAE, 30, 703–709, 1987.
Calera, A., Campos, I., Osann, A., D'Urso, G., and Menenti, M.: Remote Sensing for Crop Water Management: From ET Modelling to Services for the End Users, Sensors, 17, 1104, https://doi.org/10.3390/s17051104, 2017.
Campos, I., Neale, C. M. U., Calera, A., Balbontín, C., and González-Piqueras, J.: Assessing satellite-based basal crop coefficients for irrigated grapes (Vitis vinifera L.), Agr. Water Manage., 98, 45–54, https://doi.org/10.1016/j.agwat.2010.07.011, 2010.
Campos, I., Odi, M., Belmonte, M., Martínez-Beltrán, C., and Calera, A.: Obtención de series multitemporales y multisensor de índices de vegetación mediante un procedimiento de normalización absoluta, XIV Congreso de la Asociación Española de Teledetección, 4, 2011.
Campos, I., Villodre, J., Carrara, A., and Calera, A.: Remote sensing-based soil water balance to estimate Mediterranean holm oak savanna (dehesa) evapotranspiration under water stress conditions, J. Hydrol., 494, 1–9, https://doi.org/10.1016/j.jhydrol.2013.04.033, 2013.
Campos, I., Balbontín, C., González-Piqueras, J., González-Dugo, M. P., Neale, C. M. U., and Calera, A.: Combining a water balance model with evapotranspiration measurements to estimate total available soil water in irrigated and rainfed vineyards, Agr. Water Manage., 165, 141–152, https://doi.org/10.1016/j.agwat.2015.11.018, 2016.
Campos, I., Neale, C. M. U., Suyker, A. E., Arkebauer, T. J., and Gonçalves, I. Z.: Reflectance-based crop coefficients REDUX: For operational evapotranspiration estimates in the age of high producing hybrid varieties, Agr. Water Manage., 187, 140–153, https://doi.org/10.1016/j.agwat.2017.03.022, 2017.
Gonzalez-Piqueras, J., Calera, A., Gilabert, M. A., Cuesta, A., and Tercero, F. D. l. C.: Estimation of crop coefficients by means of optimized vegetation indices for corn, Proc. SPIE 5232, Remote Sensing for Agriculture, Ecosystems, and Hydrology V, https://doi.org/10.1117/12.511317, 24 February 2004.
Hornbuckle, J.: Delivering Water Savings through Emerging Technology. In Final Report to Grape and Wine Research & Development Corporation; CSIRO Land and Water: Canberra, Australia, available at: https://www.wineaustralia.com/getmedia/6e7c3e92-c36c-4685-9bf8-9039d99aa4a0/CSL-0901-Final-Report-IrriSAT (last access: 13 September 2018), 2014.
López-Urrea, R., Martínez-Molina, L., de la Cruz, F., Montoro, A., González-Piqueras, J., Odi-Lara, M., and Sánchez, J. M.: Evapotranspiration and crop coefficients of irrigated biomass sorghum for energy production, Irrigation Sci., 34, 287–296, https://doi.org/10.1007/s00271-016-0503-y, 2016.
MAPAMA, and CEDEX: Summary of Spanish River Basin Management Plans of the second cycle, MAPAMA, available at: https://www.mapama.gob.es/es/agua/temas/planificacion-hidrologica/sintesispphh2cicloborrador_tcm30-379039.pdf (last access: 13 September 2018), 2017.
Melton, F. S., Johnson, L. F., Lund, C. P., Pierce, L. L., Michaelis, A. R., Hiatt, S. H., Guzman, A., Adhikari, D., Purdy, A. J., Rosevelt, C., Votava, P., Trout, T. J., Temesgen, B., Frame, K., Sheffner, E. J., and Nemani, R. R.: Satellite Irrigation Management Support With the Terrestrial Observation and Prediction System: A Framework for Integration of Satellite and Surface Observations to Support Improvements in Agricultural Water Resource Management, IEEE J. Sel. Top. Appl., 5, 1709–1721, https://doi.org/10.1109/jstars.2012.2214474, 2012.
Moreno, R., Arias, E., Sánchez, J. L., Cazorla, D., Garrido-Rubio, J., and González-Piqueras, J.: HidroMORE 2: An optimized and parallel version of HidroMORE, 8th International Conference on Information and Communication Systems (ICICS), Irbid, 2017, 1–6, https://doi.org/10.1109/IACS.2017.7921936, 2017.
Neale, C. M. U., Bausch, W. C., and Heerman, D. F.: Development of reflectance-based crop coefficients for corn, T. ASAE, 32, 1891–1899, 1989.
Panagos, P., Van Liedekerke, M., Jones, A., and Montanarella, L.: European Soil Data Centre: Response to European policy support and public data requirements, Land Use Policy, 29, 329–338, https://doi.org/10.1016/j.landusepol.2011.07.003, 2012.
Rouse, J. W., Haas, R. H., Deering, D. W., and Schell, J. A.: Monitoring the vernal advancement and retrogradation of natural vegetation. NASA/GSFC, Greenbelt, USA, Final Report, available at: https://ntrs.nasa.gov/archive/nasa/casi.ntrs.nasa.gov/19730017588.pdf (last access: 13 September 2018), 1973.
Torres, E. A., Calera, A., González-Piqueras, J., Rubio, E., Campos, I., and Balbotín, C.: Coupling remote sensing and FAO-56 for a distributed water budget in large areas: HidroMORE, Remote Sensing and Hydrology 2010 Symposium, 401–405, 2010.