the Creative Commons Attribution 4.0 License.
the Creative Commons Attribution 4.0 License.
 | 18 Dec 2018
Remote sensing vegetation index methods to evaluate changes in greenness and evapotranspiration in riparian vegetation in response to the Minute 319 environmental pulse flow to Mexico
Christopher J. Jarchow
Edward P. Glenn
During the spring of 2014, 130 million m3 of water were released from the United States' Morelos Dam on the lower Colorado River to Mexico, allowing water to reach the Gulf of California for the first time in 13 years. Our study assessed the effects of water transfer or ecological environmental flows from one nation to another, using remote sensing. Spatial applications for water resource evaluation are important for binational, integrated water resources management and planning for the Colorado River, which includes seven basin states in the US plus two states in Mexico. Our study examined the effects of the historic binational experiment (the Minute 319 agreement) on vegetative response along the riparian corridor. We used 250 m Moderate Resolution Imaging Spectroradiometer (MODIS), Enhanced Vegetation Index (EVI) and 30 m Landsat 8 satellite imagery to track evapotranspiration (ET) and the normalized difference vegetation index (NDVI). Our analysis showed an overall increase in NDVI and evapotranspiration (ET) in the year following the 2014 pulse, which reversed a decline in those metrics since the last major flood in 2000. NDVI and ET levels decreased in 2015, but were still significantly higher (P < 0.001) than pre-pulse (2013) levels. Preliminary findings show that the decline in 2015 persisted into 2016 and 2017. We continue to analyse results for 2018 in comparison to short-term (2013–2018) and long-term (2000–2018) trends. Our results support the conclusion that these environmental flows from the US to Mexico via the Minute 319 “pulse” had a positive, but short-lived (1 year), impact on vegetation growth in the delta.


In 2012, Minute 319 to the 1944 Treaty was signed (https://www.ibwc.gov/Treaties_Minutes/Minutes.html, last access: 6 September 2018) allowing for a pulse flow of water into the Colorado River's delta, in Mexico. During the spring of 2014 (23 March to 18 May), 130 million m3 of water were released from the United States' Morelos Dam on the lower Colorado River to Mexico, allowing water to reach the Gulf of California for the first time in 13 years. Our study assessed the effects of water transfer via ecological environmental flows from one nation to another, using remote sensing of vegetative response. Spatial applications for water resource evaluation are important for binational, integrated water resources management and planning for the Colorado River, which includes seven basin states in the US plus two states in Mexico.
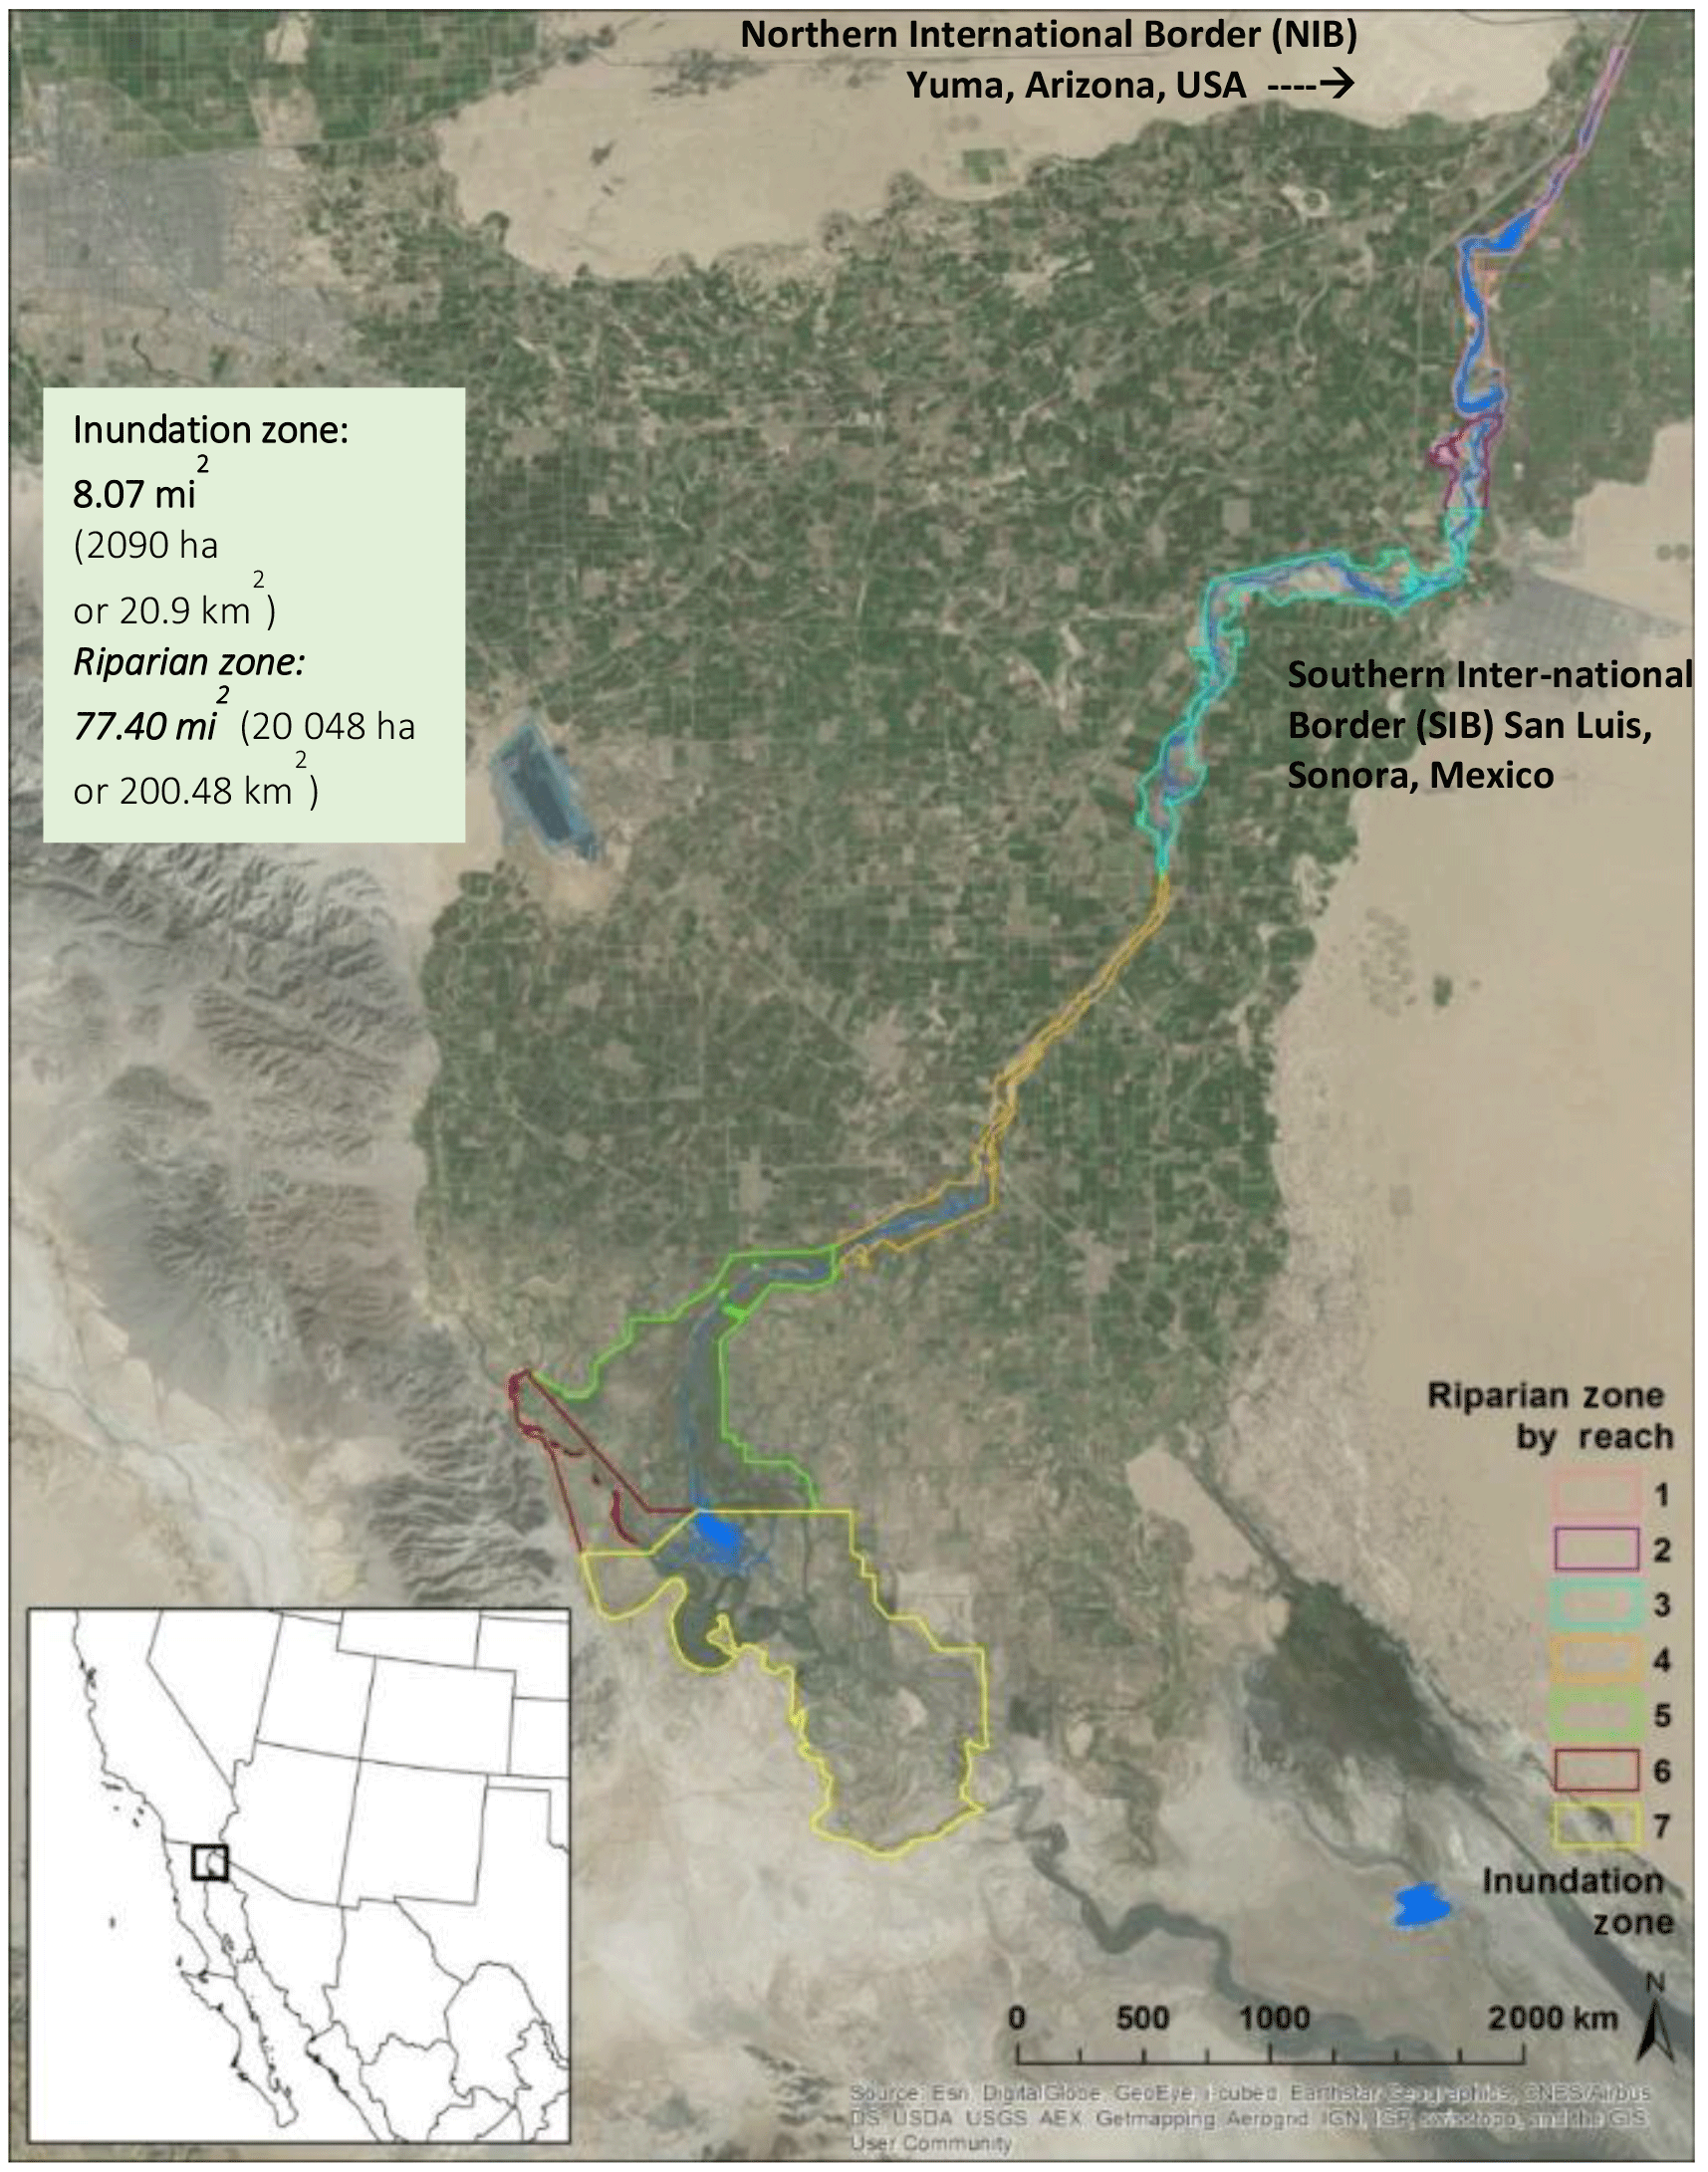
Figure 1Map of the Colorado River Delta showing the seven reaches of the Riparian Corridor in Mexico.
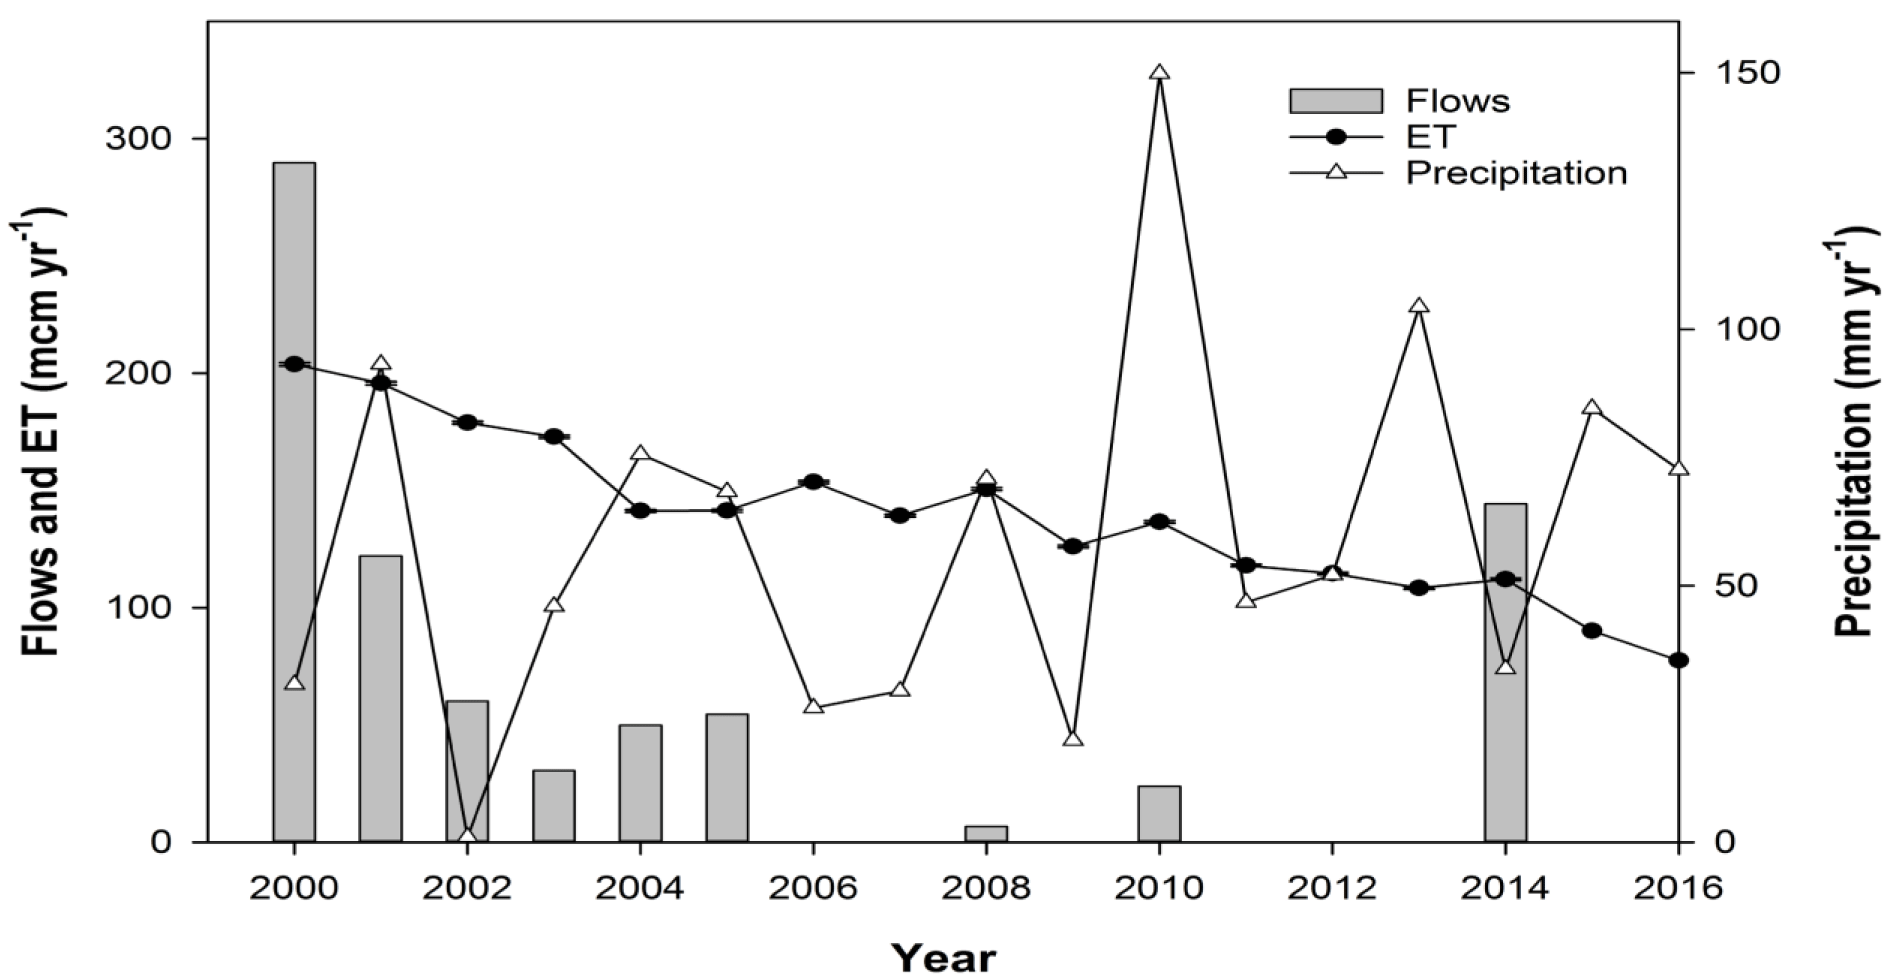
Figure 2Annual flow volume and precipitation at the Southern International Boundary (SIB) and total annual ET (based on MODIS EVI) within the riparian corridor from 2000–2016.
1.1 Background
Water is a primary environmental driver of plant productivity in our region and an important metric of the efficiency of water use is evapotranspiration (ET). As with other similar regions of the world, ET is a key component of the hydrological cycle and can indicate the resilience and resistance of vegetation to drought. In undisturbed deserts, nearly all the water arriving as precipitation can be discharged as ET, but landcover disturbances can greatly impact the water balance. For example, beetle infestations can lower vegetation cover, scouring flows can clear vegetation, and fire and burn scars can increase water use by cohorts of older trees (Bateman et al., 2013; Nagler et al., 2013c). Understanding how intact plant communities utilize water and how disturbance alters water-use efficiency can help predict future ecosystem resilience (Shanafield et al., 2017). Even in sparse deserts, vegetation is often the most important factor controlling how water is utilized or lost in ecosystems (Gee et al., 1994; Glenn et al., 2008). Measuring plant water use or landscape-level ET is important primarily because water retention and efficient utilization is critical for the survival of humans, croplands, and natural areas. The preservation of natural areas protects water resources and the plants and animals that use those areas as habitat (Hinojosa-Huerta et al., 2013).
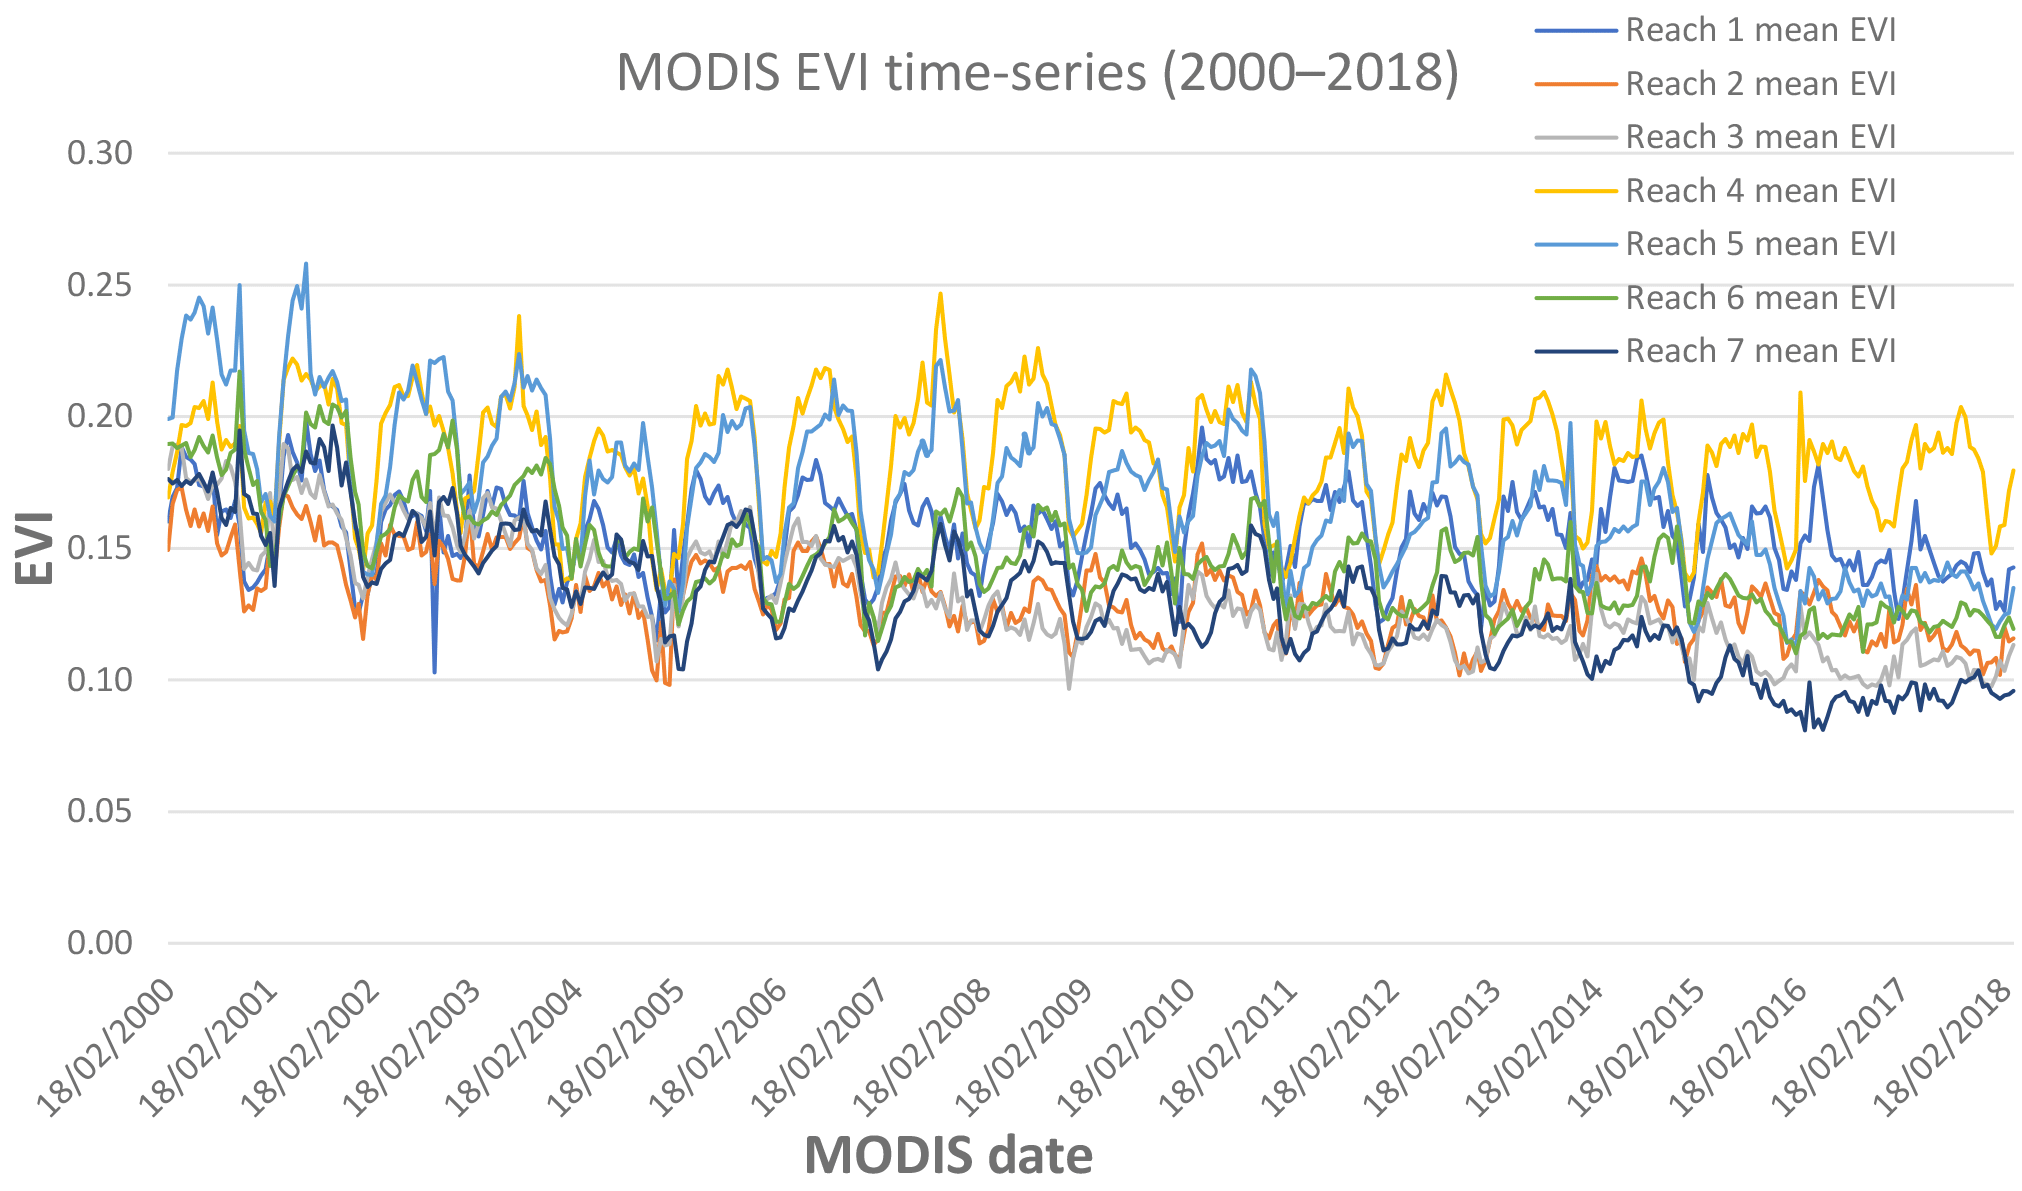
Figure 3MODIS EVI time series from 2000 to 2018 for the seven Reaches of the riparian corridor.
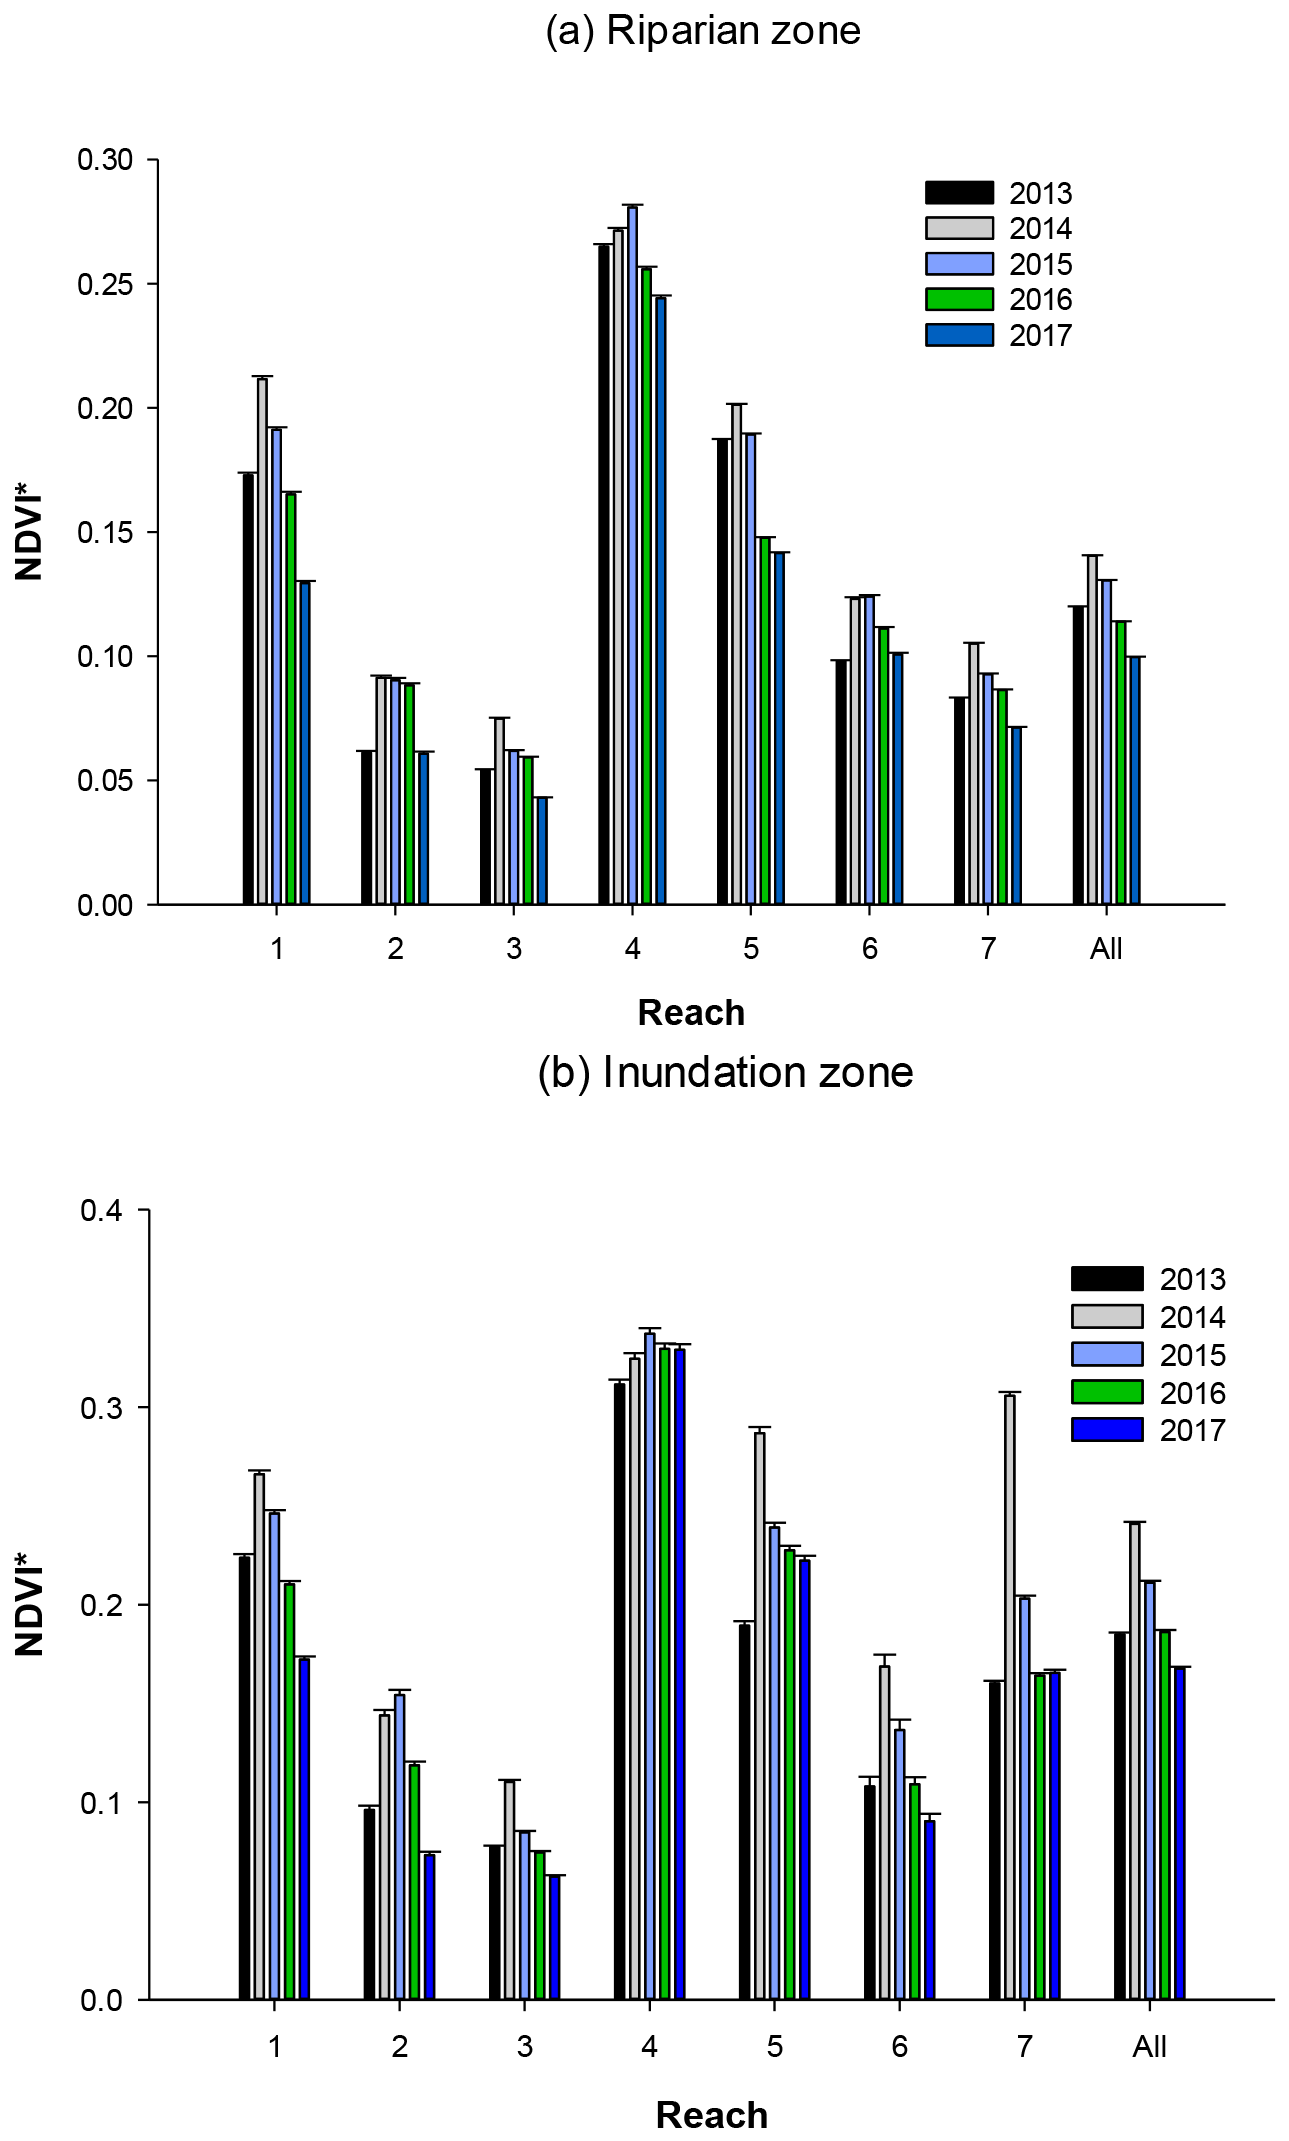
Figure 4(a) Landsat NDVI in the entire riparian zone, by river Reach, from 2013–2017. (b) NDVI in the inundation zone, by river Reach, from 2013–2017. The 2013–2015 NDVI data was derived from Jarchow et al. (2017).
1.2 Research goal
Our study examined the effects of the historic binational experiment (the Minute 319 agreement) on vegetative response, greenup, and ET along the riparian corridor. The purpose of these environmental pulse flows was to demonstrate changes in biology and hydrology processes, but we hoped to see it recharge groundwater and germinate new cohorts of riparian plants to restore the riparian plant communities along the delta. Flows were designed to simulate historical (natural) pulse-flows (i.e., prior to dams and river regulations altering the flow regime). Our goals were to: (1) estimate ET using a Moderate Resolution Imaging Spectrometer (MODIS) Enhanced Vegetation Index (EVI)-based ET algorithm and (2) assess the greenup response of vegetation using Landsat 8 Normalized Difference Vegetation Index (NDVI).
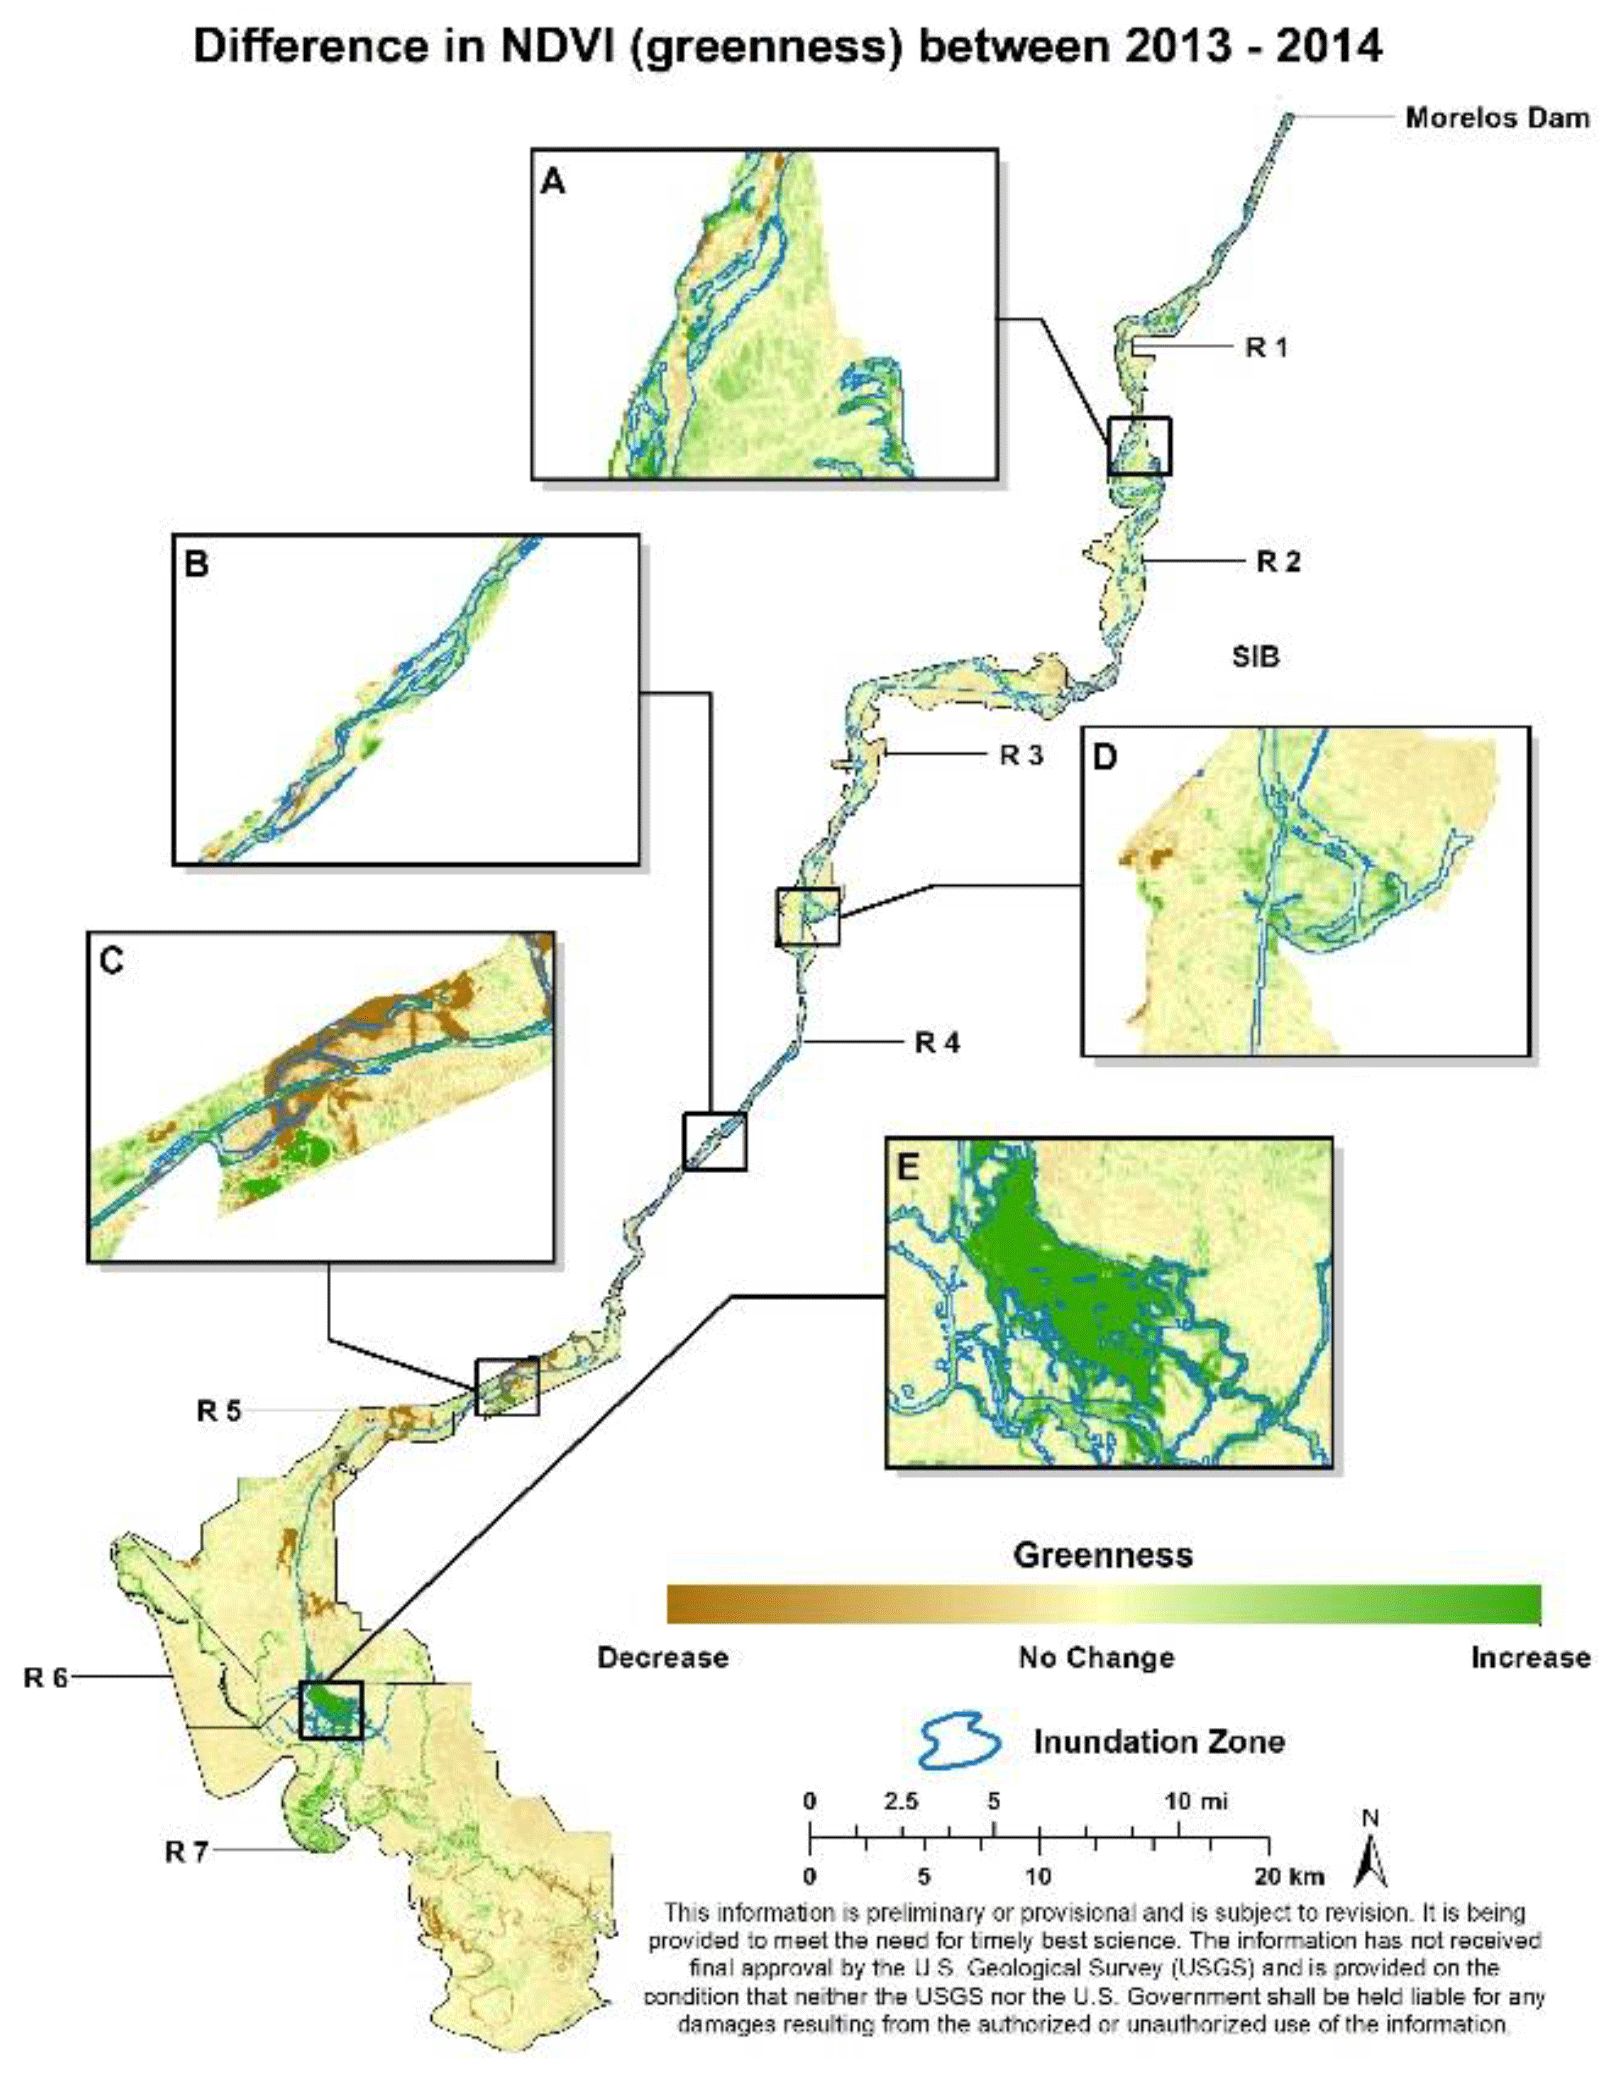
Figure 52014 pulse flow inundation zone and the difference in NDVI from 2013 and 2014. Greener color indicates higher NDVI than in previous year; browner color indicates lower NDVI than in previous year. Image from Jarchow et al. (2017a).

Figure 62014 pulse flow inundation zone and the difference in NDVI from 2014 and 2015. Greener color indicates higher NDV than in previous year; browner color indicates lower NDVI than in previous year.
We document the changes in ET and green foliage density attributable to the Minute 319 Pulse flow and compare them with conditions from 2000–2013, a drought period that preceded the pulse flow (Jarchow et al., 2017b). Landsat imagery (30 m resolution, 16-day return time) and MODIS imagery (250 m resolution, daily return time) were used for the analyses. The analyses used vegetation indices, which ratio different optical bands to provide a measure of canopy “greenness”. We used the NDVI for Landsat images while the EVI was used for MODIS.
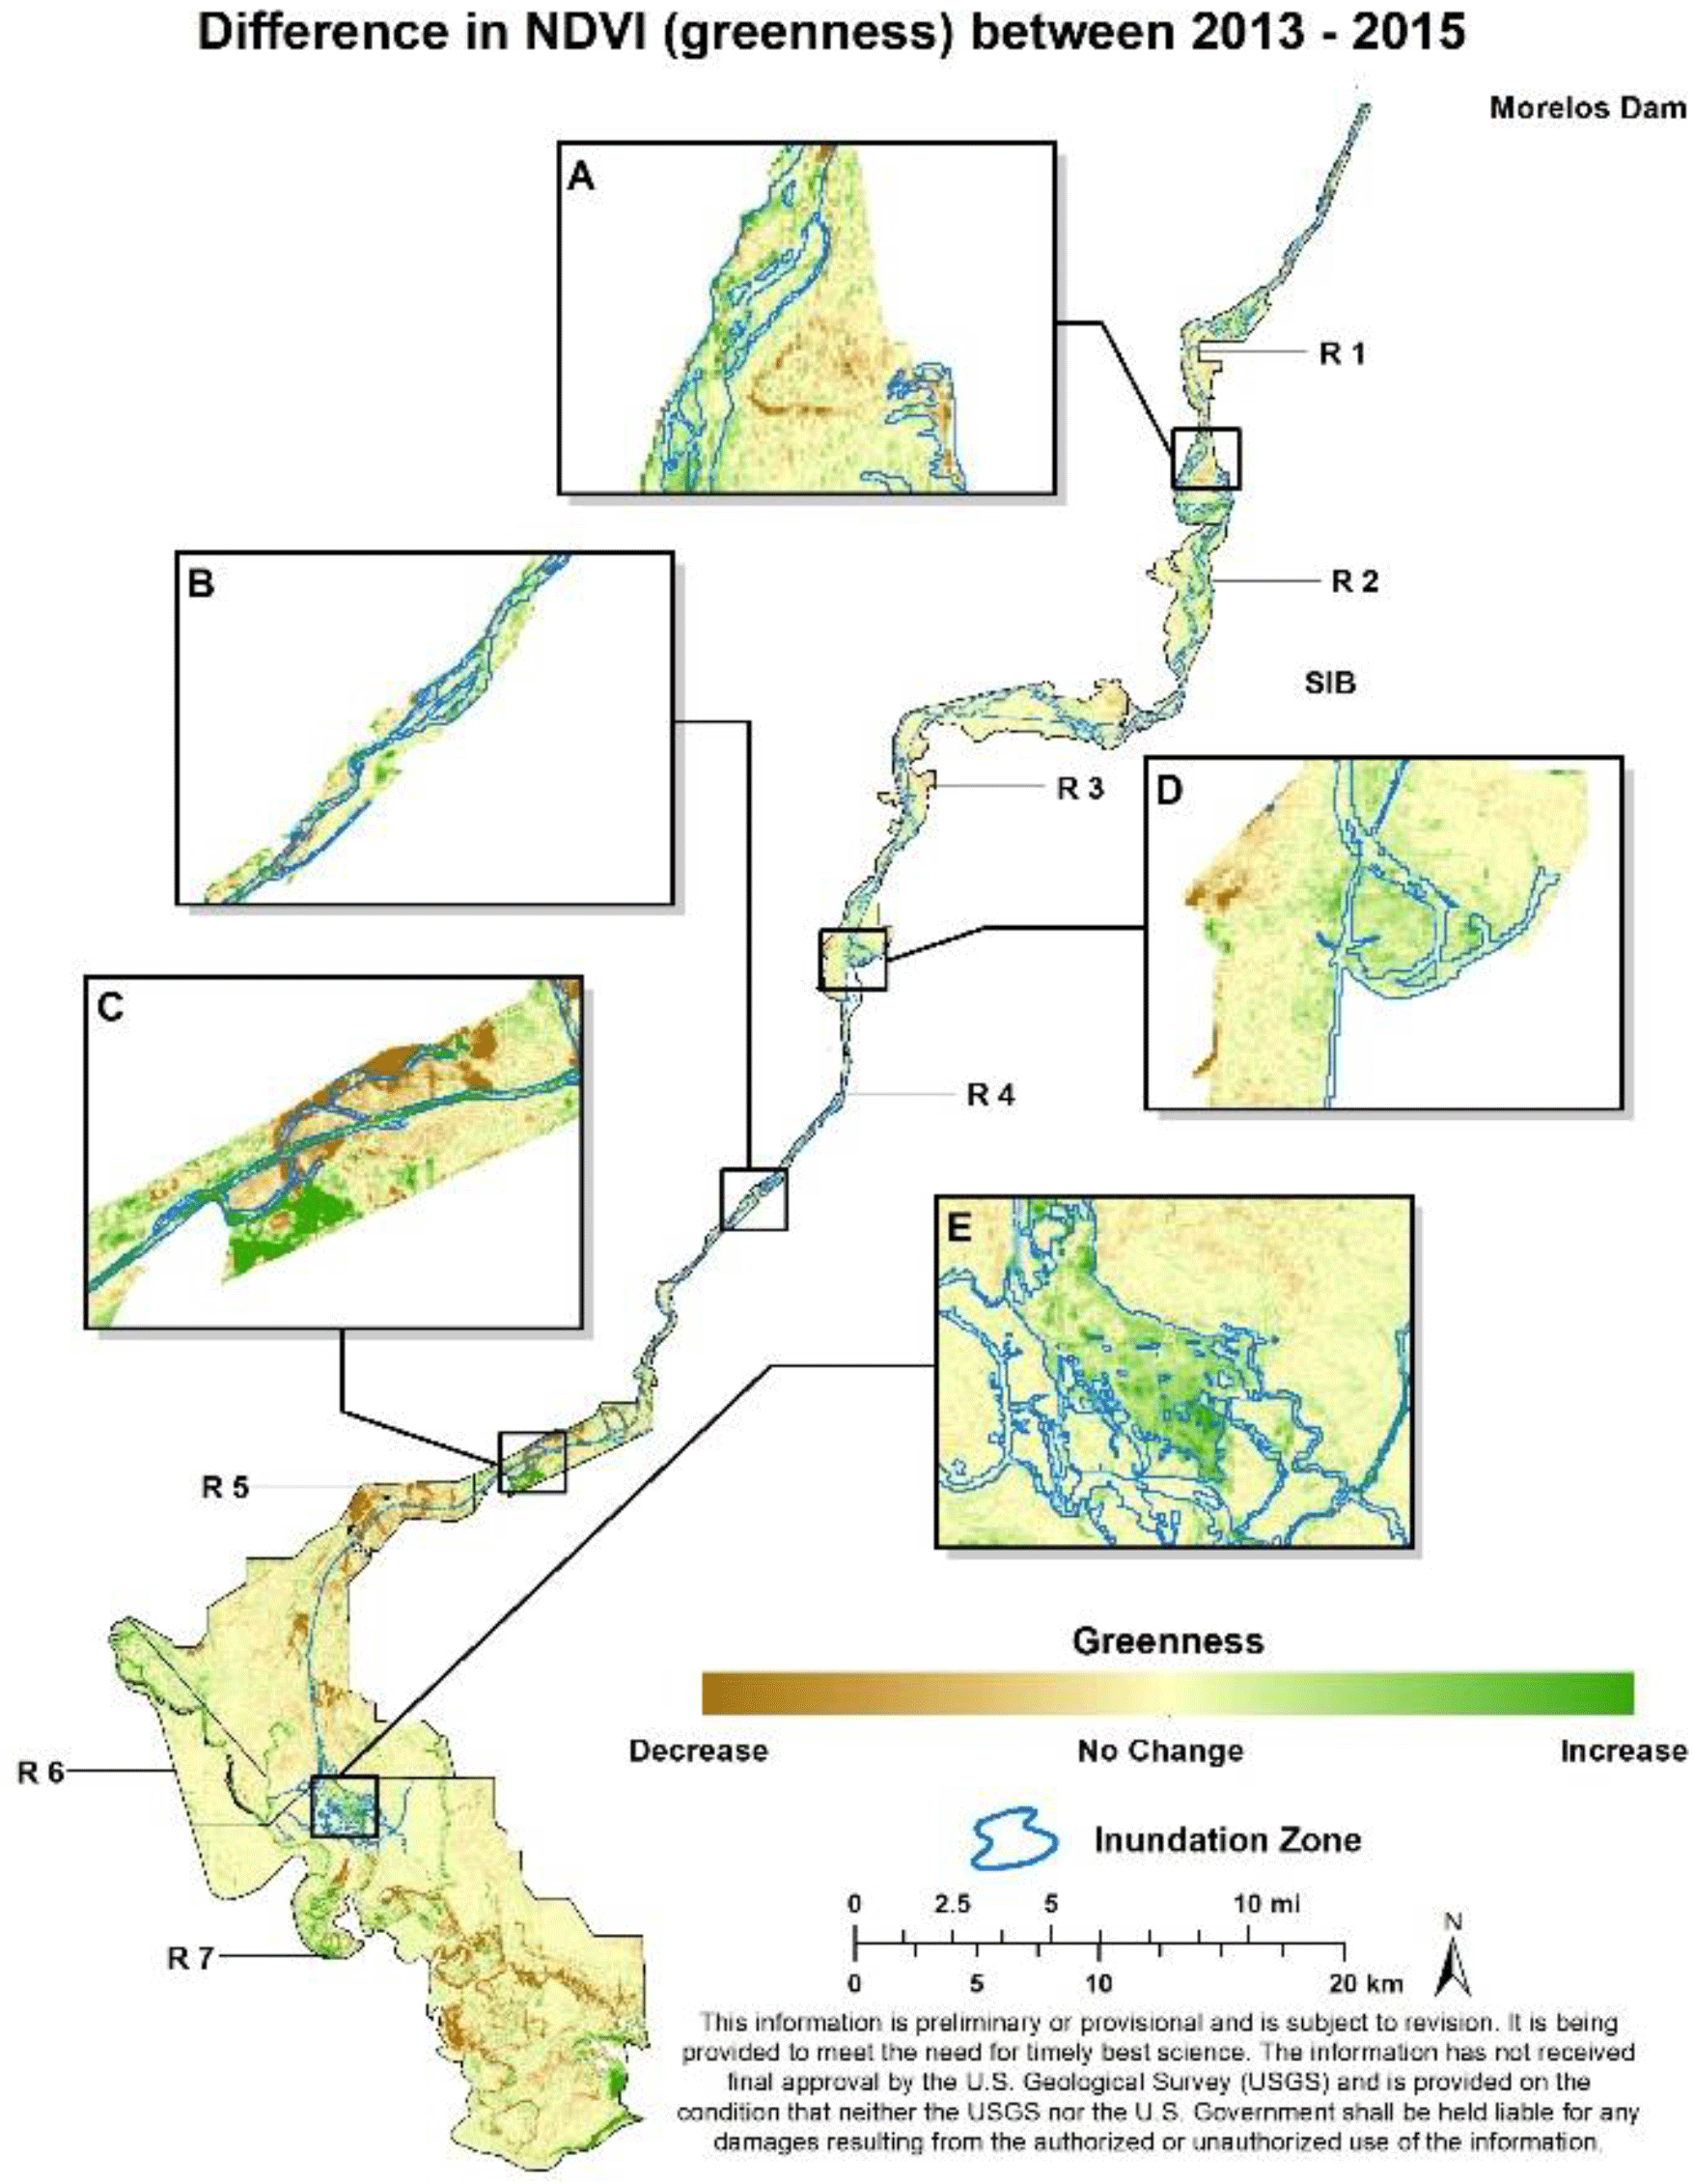
Figure 72014 pulse flow inundation zone and the difference in NDVI from 2013 and 2015. Greener color indicates higher NDVI than in previous year; browner color indicates lower NDVI than in previous year.
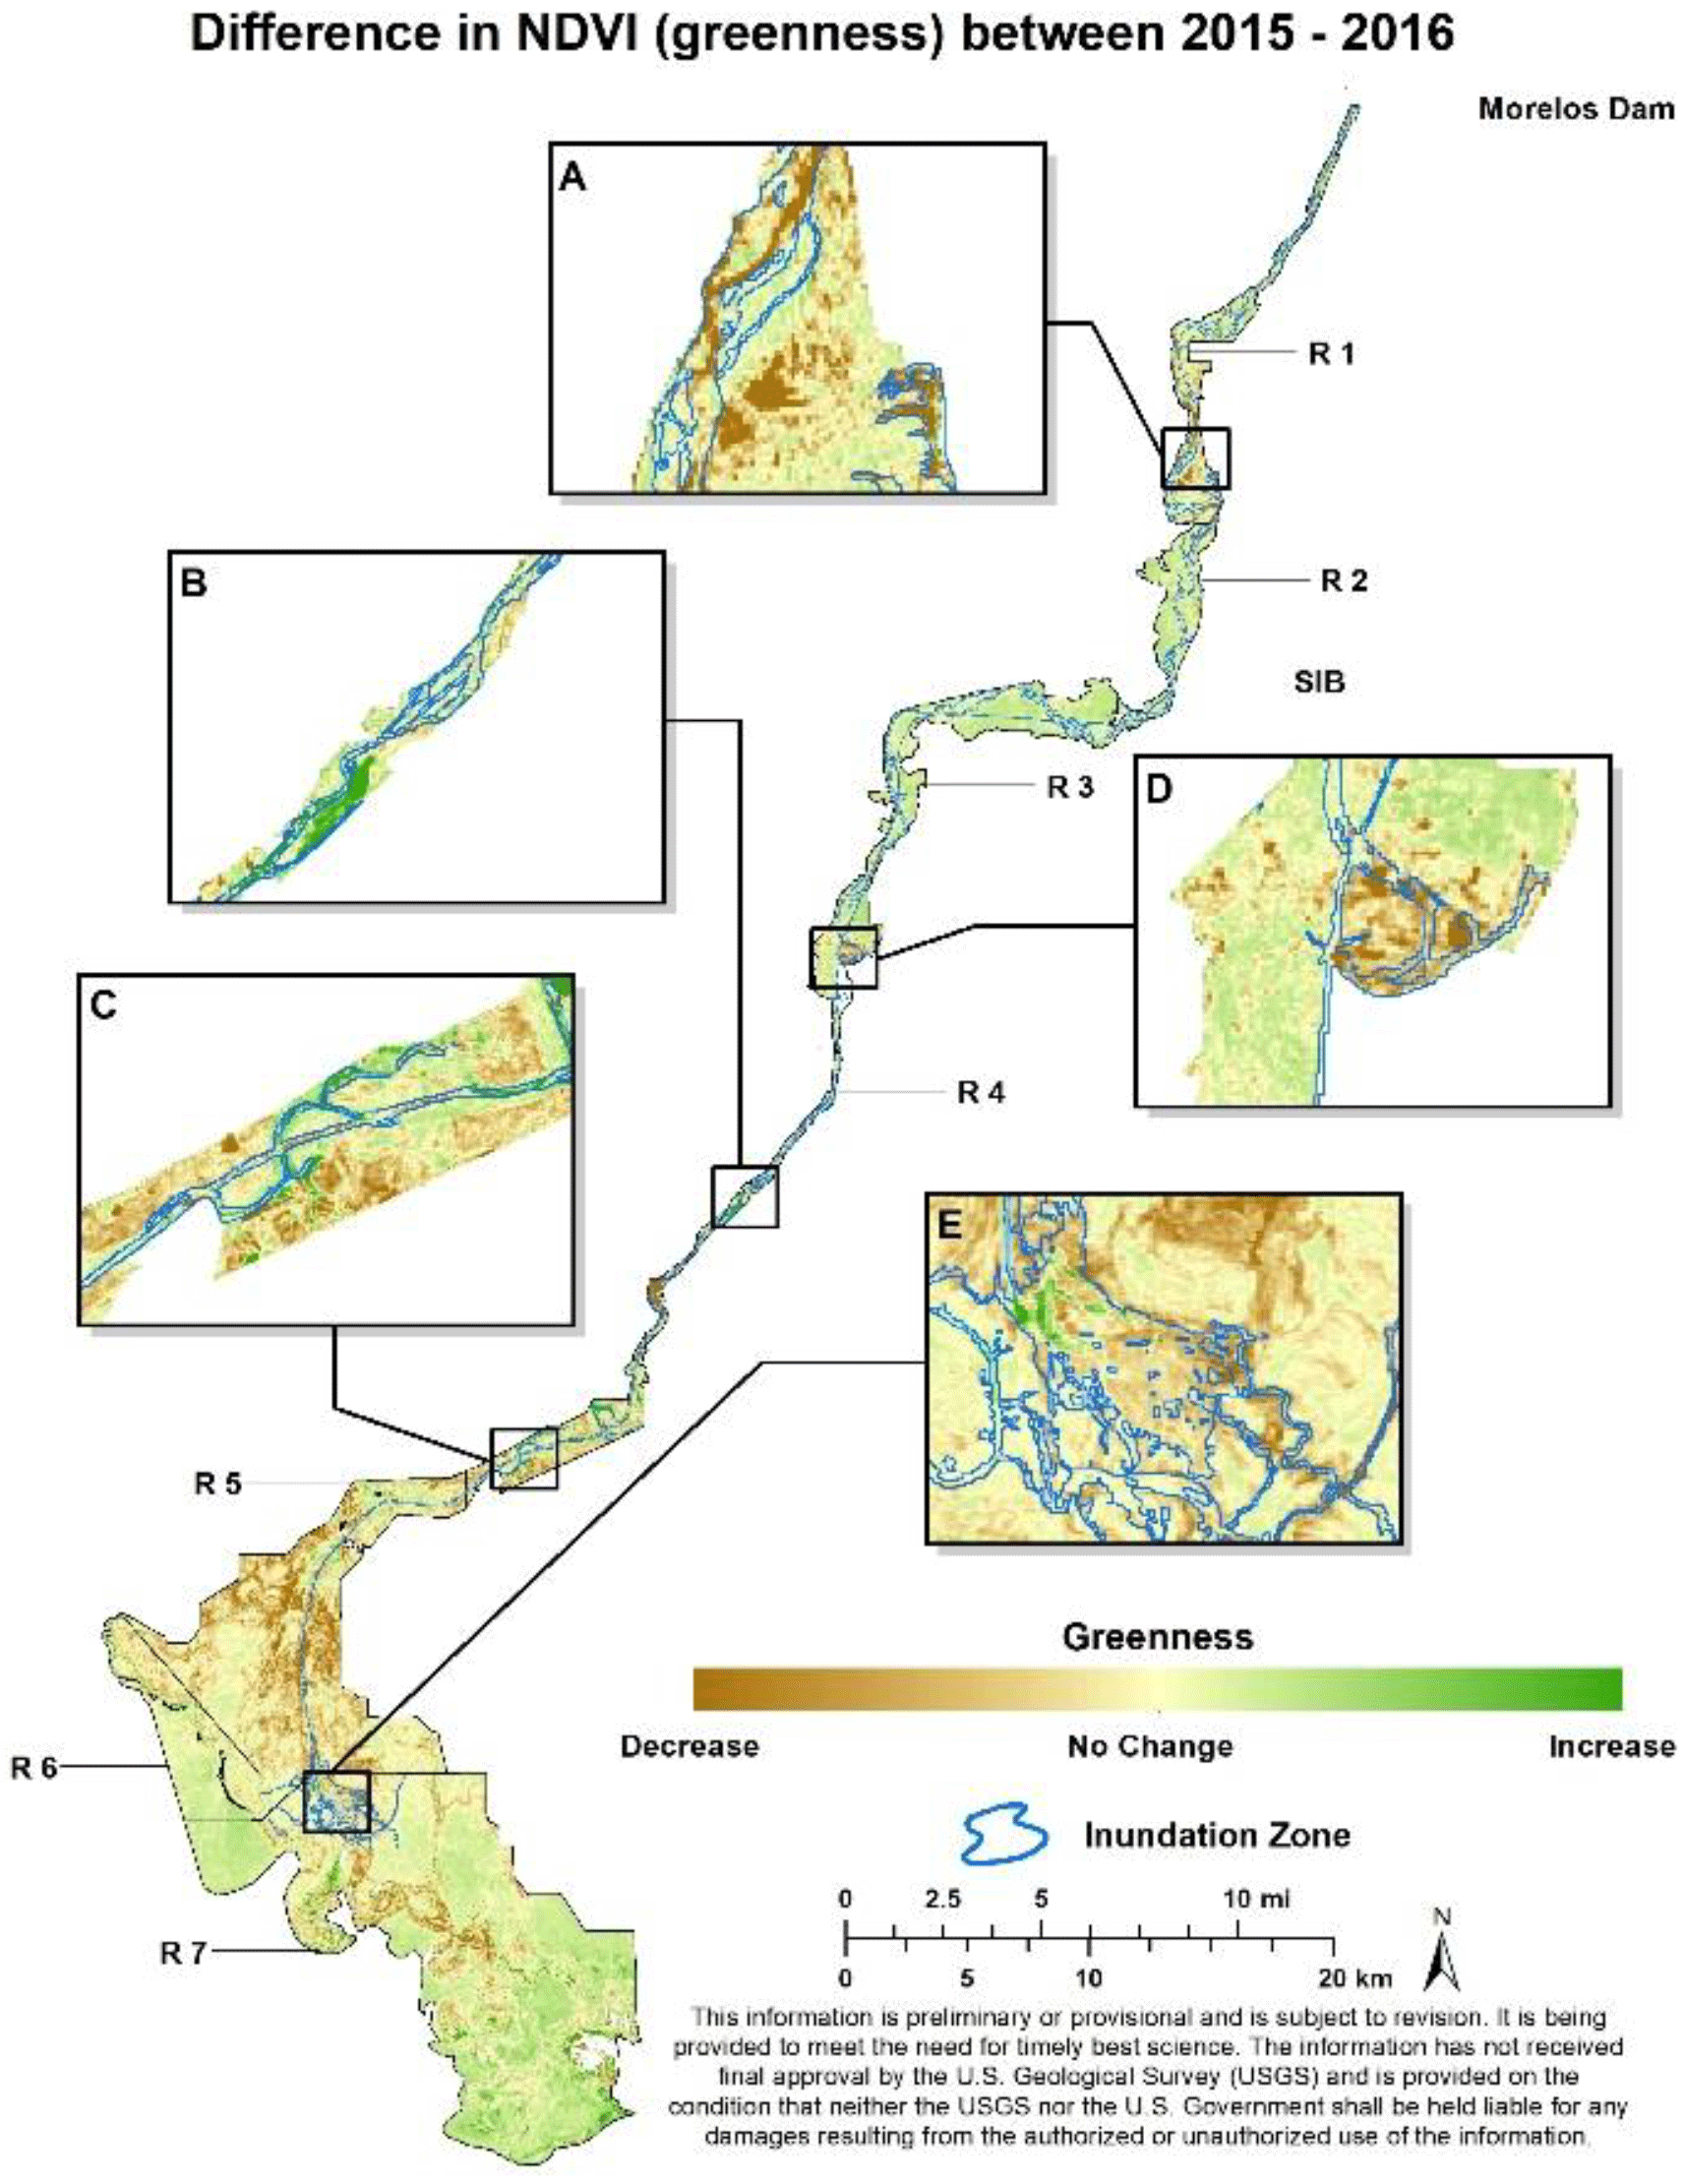
Figure 82014 pulse flow inundation zone and the difference in NDVI from 2015 and 2016. Greener color indicates higher NDVI than in previous year; browner color indicates lower NDVI than in previous year.
We used the entire MODIS EVI time-series, every 16 days since February of 2000 to present; approximately 335 MODIS images were used in this study. We used 4–5 clear sky summer Landsat images per year for the assessment during the years 2013–2018. At least five Landsat scenes were acquired during the growing season (May–October) for the years 2013, 2014, 2015, 2016 and 2017 and NDVI was averaged across the growing season. These imagery selection choices were based on previous performance comparisons made in riparian ecosystems (Groeneveld and Baugh, 2007; Groeneveld et al., 2007; Nagler et al., 2013). MODIS EVI and potential ET from the Yuma Valley AZMET station were used to estimate ET with an algorithm previously calibrated with eddy covariance flux tower data in riparian ecosystems (Nagler el al., 2005a, b) and we used this ET equation which was revised for dryland riparian and agricultural lands that included similar areas to the Colorado River Delta in Mexico, including those in the arid, southwestern US (Nagler et al., 2013). The resulting algorithm capably predicted ETa across riparian plants and crops (r2=0.73). Equation (1), which has a biophysical justification based on the Beer-Lambert Law, succeeds in unifying riparian and crop data into a single algorithm:
The riparian corridor was divided into seven river Reaches from the Northern International Border (NIB) near Yuma, AZ to the estuary (Fig. 1). Landsat NDVI (n=4 to 5 summer season scenes/year) was compared for each of the seven river Reaches for the wetted, inundation zone and the overall riparian corridor.
Monitoring of the riparian corridor was done using both MODIS EVI at the coarser level as well as Landsat NDVI at the finer level, and provided the greenness trends over the long-term (nearly two decades) and conditions of the vegetation cover over the short-term, since the year prior to the Minute 319 pulse flow through March 2018.
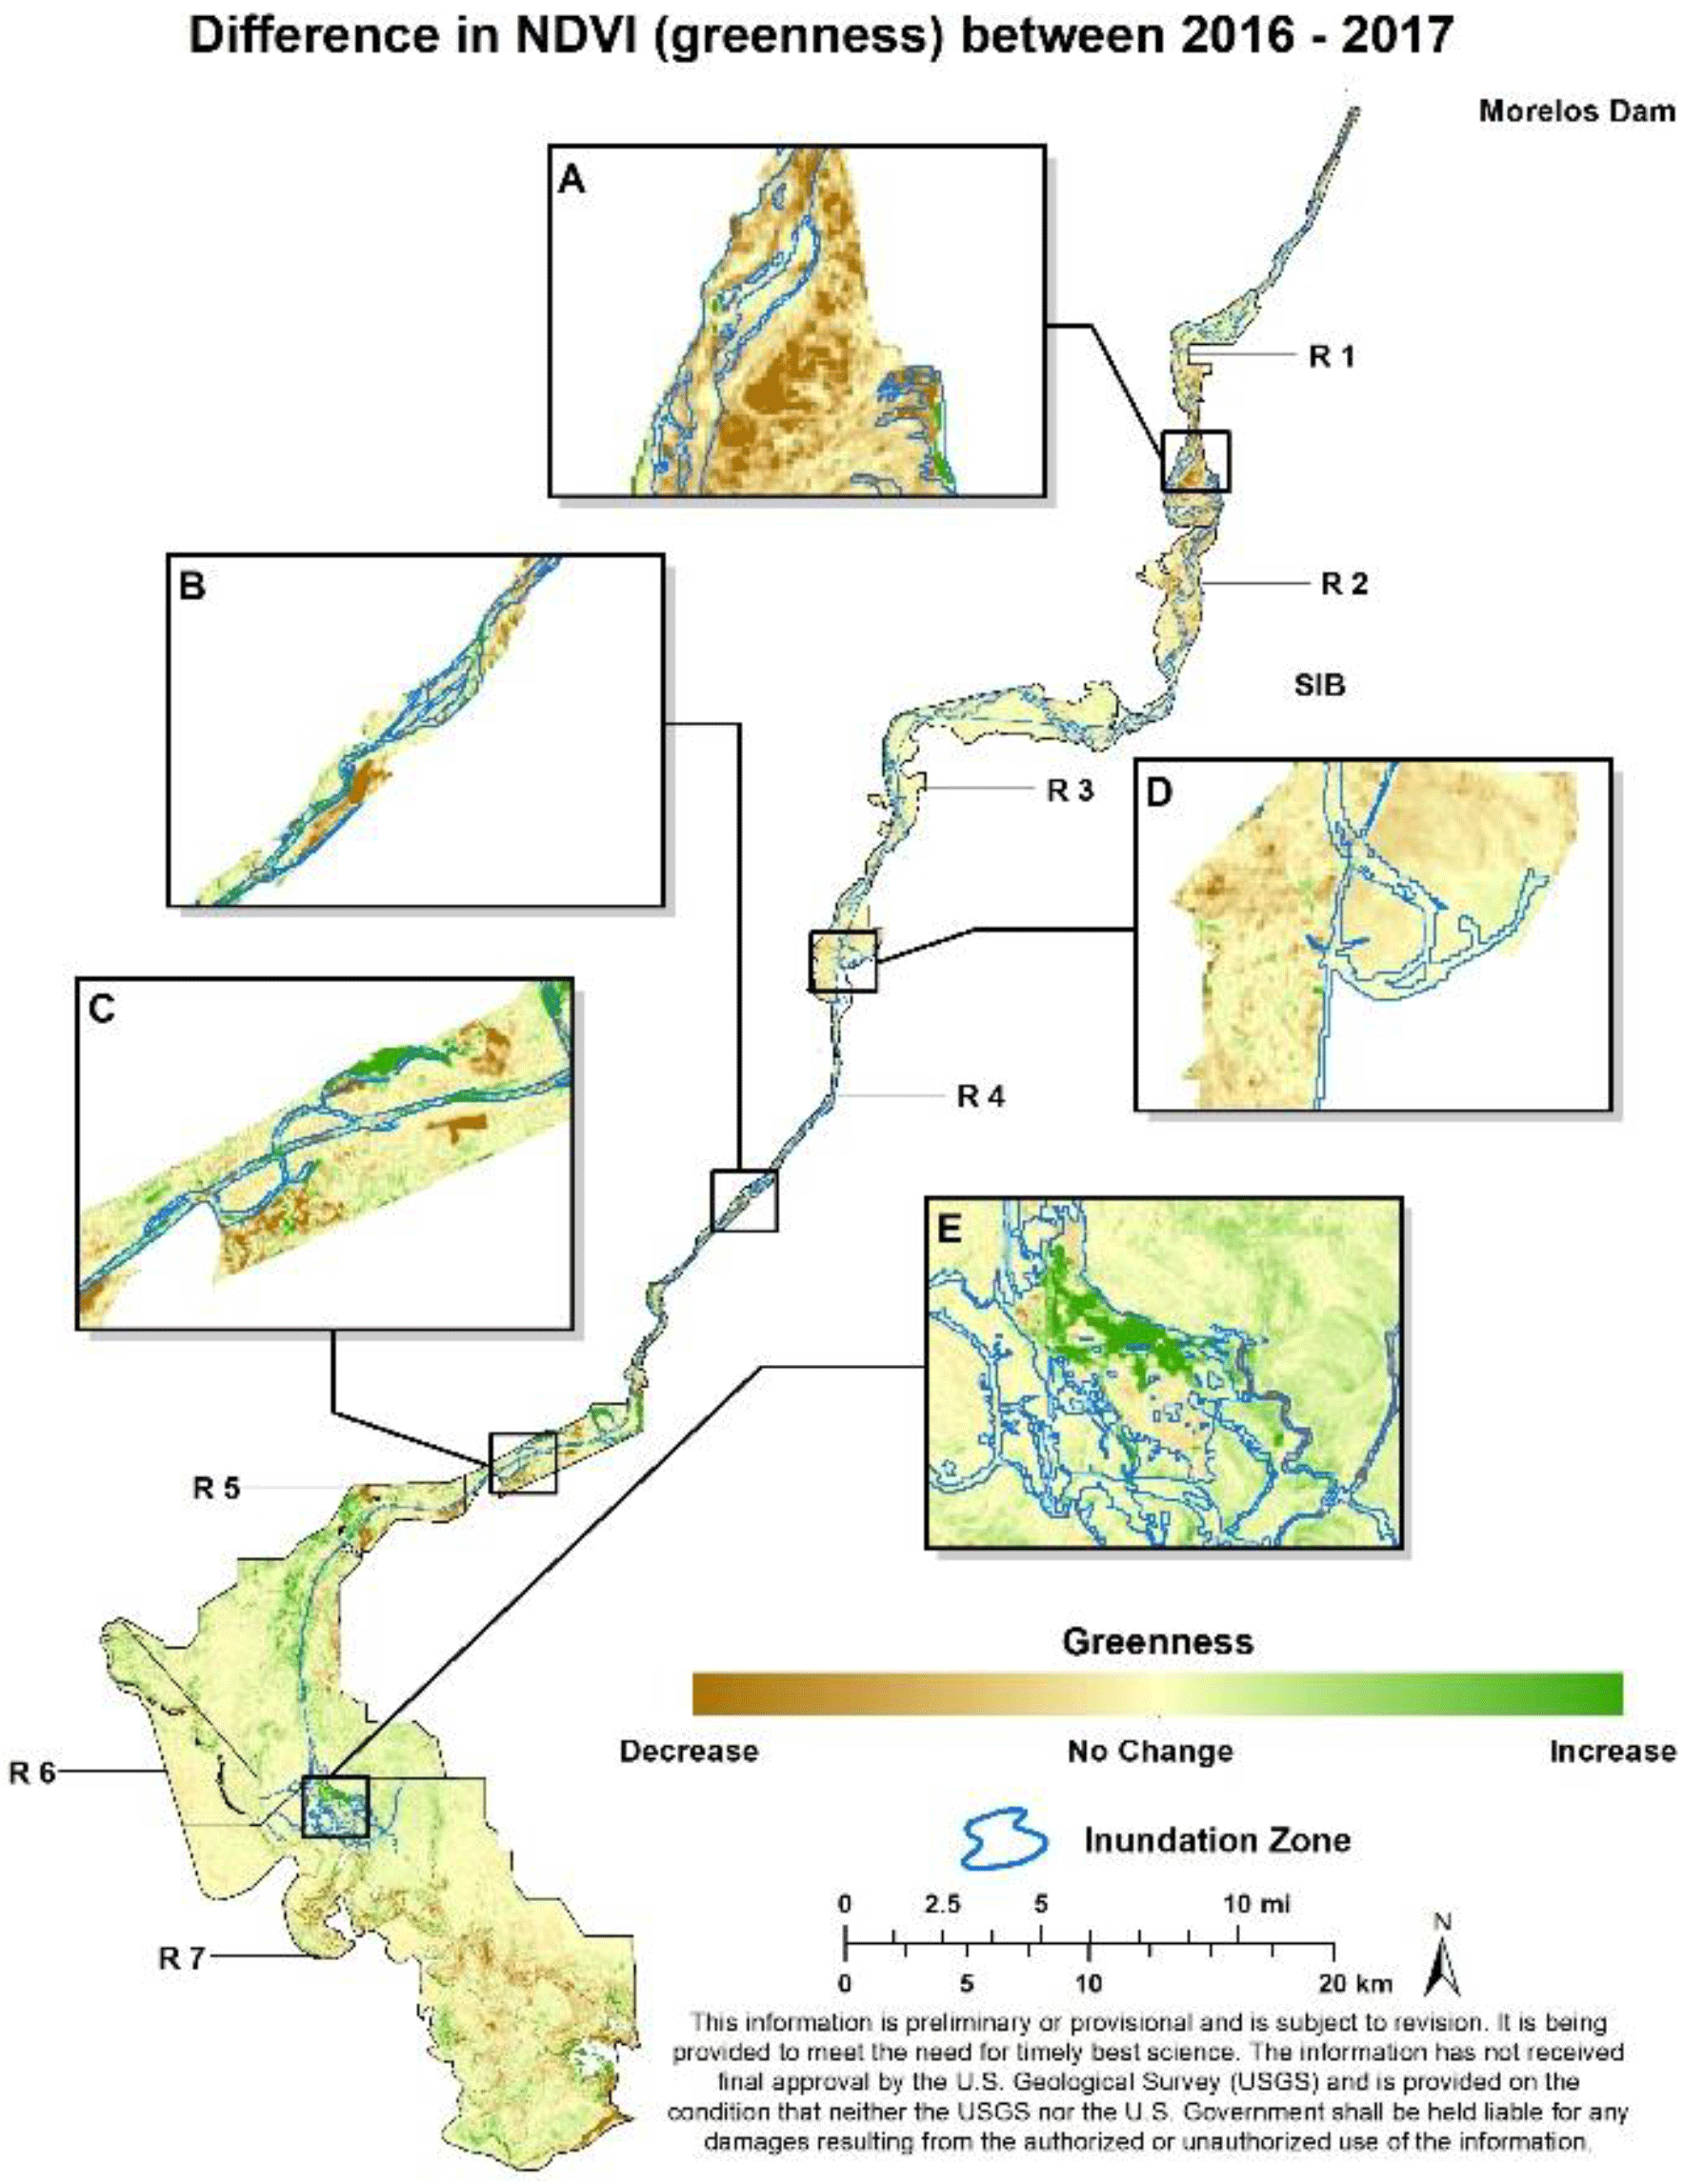
Figure 92014 pulse flow inundation zone and the difference in NDVI from 2016 and 2017. Greener color indicates higher NDVI than in previous year; browner color indicates lower NDVI than in previous year.
Figure 2 shows the annual flow volume and precipitation at the Southern International Boundary (SIB) and total annual ET (based on MODIS EVI within the riparian corridor) from 2000–2016. The last large flow in the year 2000 was approximately twice that of the Minute 319 flow.
A declining trend since the year 2000 for all the Reaches is noted, with the exception of Reach 4 which contains a variety and number of restoration plots, planted by field crews working to restore native vegetation habitat in the delta. Figure 3 shows MODIS EVI from 2000 to present for the riparian corridor for each of the seven Reaches. Figure 4 shows finer resolution Landsat images in which NDVI was acquired by river Reach. Then change maps of NDVI or “greenness” were created. Increases in NDVI in 2014 occurred in the zone inundated by the pulse flow as well as in the non-inundated outer parts of the riparian floodplain, where groundwater supported existing vegetation. NDVI was markedly higher in 2014 than in 2013 for all Reaches except Reach 4, where plants were cleared prior to the pulse flow. The overall NDVI increase above the soil baseline value (0.0947) was 17 % and was statistically significant (P < 0.001). NDVI decreased in each year since 2014 with the exception of the restoration areas, for both the riparian zone and the inundation zone (Fig. 4). Figure 4 also shows that from 2016–2017 NDVI decreased steadily, falling below 2013 levels in the riparian corridor. The most intense greening in 2014 took place in the zone of inundation but increases in NDVI also occurred outside the zone of inundation, indicating that the pulse water was stored as groundwater in these outside areas. Our analysis showed an overall increase in NDVI and evapotranspiration (ET) in the year following the 2014 pulse, which reversed a decline in those metrics since the last major flood in 2000. NDVI and ET levels decreased in 2015, but were still significantly higher than pre-pulse (2013) levels. Preliminary findings show that this decline persisted into 2016 and 2017.
Figure 5 shows areas inundated during the pulse flow and differences in NDVI between 2013 (pre-pulse) and 2014 (post-pulse), with selected enlarged portions of the riparian corridor. A greener color indicates that NDVI was higher in 2014 than in 2013. There was extensive green-up in all areas, except for the portion in the lower part of Reach 4 (Fig. 5c), where extensive land-clearing took place prior to the pulse flow. Much of the land cleared was not inundated during the pulse flow.
Figure 6 shows areas inundated during the pulse flow and differences in NDVI between 2014 and 2015. A greener color indicates that NDVI was higher in 2015 than in 2014. A browner color indicates a reduction in greenness (not necessarily the result of brown vegetation) from 2014 to 2015. Note that while some areas were greener than in the post-pulse growing season of 2014 (Fig. 6a and c), other parts of the riparian corridor were not as green as in the previous year – see especially enlarged part of Reach 7 (Fig. 6e).
Figure 7 shows areas inundated during the pulse flow and differences in NDVI between 2013 (pre-pulse) and 2015 (two growing seasons after the pulse flow). Some areas continued to increase in greenness from 2013 to 2015 (lower Reach 1 and Reach 7), while other areas show little change, or were less green than under pre-pulse conditions.
Figure 8 shows areas inundated during the pulse flow and differences in NDVI between 2015 and 2016. Note that the overall trend was a decrease in greenness, but some localized areas (such as in Reach 7 and Reach 3; Fig. 8e and d, respectively) displayed a slight increase in greenness.
Figure 9 shows areas inundated during the pulse flow and differences in NDVI between 2016 and 2017. Note that the overall trend was a decrease in greenness in 2017, but the area corresponding to the inundation zone in Reach 7 (Fig. 9e) saw a slight increase in greenness.
We have analyzed the effects of this historic release of water, providing insight into the efficacy of environmental pulses as a tool for restoring the delta's riparian corridor, an ecosystem heavily affected by decades of impoundments and diversions.
Landsat NDVI was averaged across the growing season (May–October) from 2013–2017 for each river Reach and all Reaches combined. NDVI is greatest in Reaches 1, 4 and 5, where shallow groundwater and surface water supports vegetation. Reaches 2 and 3 are within the “dry Reach” where the water table is deep and vegetation is sparse. Reach 6 is dominated by the Río Hardy drainage and was largely unaffected by the pulse flow and subsequent base flow. Reach 7 includes the upper estuary and received surface water from the pulse flow in 2014 and more regular flows from the. Groundwater is shallow in Reach 7.
NDVI was higher in 2014 than in 2013 for all Reaches. The overall NDVI increase from 2013 to 2014 was 17 % (P < 0.001). The most intense greening in 2014 took place in the zone of inundation by the pulse flow, but increases in NDVI also occurred outside the zone of inundation, indicating that the pulse flow likely enhanced groundwater conditions in those areas as well.
The overall peak NDVI values occurred in Reach 4 in 2015, perhaps reflecting the effects of planting and vegetation growth in the Laguna Grande restoration site.
For Reaches 1, 4, 5, and all combined, NDVI decreased steadily from 2016–2017, falling below 2013 levels. The rapid decrease in NDVI values in Reach 1, and the 2017 drop in the Reach 2 may be consequences of the expanding cone of depression on the water table noted in Section 2 of this report. By 2017, NDVI values in the Reaches 2 and 3 – the dry Reaches- and Reaches 6 (Río Hardy) and 7 (the upper estuary) fell to values similar to or slightly lower than those observed in 2013. Restoration activities at the Miguel Aleman site appear to have been at too small a scale to sustain overall NDVI values in Reach 2.
The Reach 4 average NDVI values did not fall as much after 2014 as in other Reaches, perhaps as a consequence of base flow deliveries to the two restoration sites in this Reach, the persistent high water table in this Reach, or, most likely, both factors.
Our results support the conclusion that these environmental flows from the US to Mexico via the Minute 319 “pulse” had a positive, but short-lived (1 year), impact on vegetation growth in the delta. Based on preliminary findings, pulse flows could be an effective tool for restoring the lower Colorado River's riparian zone. We continue to analyze results for 2018 in comparison to short-term (2013–2018) and long-term (2000–2018) trends using both MODIS EVI and Landsat NDVI. The long-term trends are able to be assessed using MODIS EVI time-series data, by Reach, for the riparian corridor. We are comparing this longer period to the area we focused on between 2013 (prior to the pulse flow) and the 2014–2018 period in which 4–5 summer Landsat NDVI images were used per year to study the effect of the 2014 pulse flow.
The Minute 319 Pulse Flow produced a 17 % increase in NDVI throughout all seven Reaches of the riparian corridor in 2014, compared with 2013. The most intense greening in 2014 took place in the zone of inundation, but increases in NDVI also occurred outside the zone of inundation, indicating that the pulse flow likely enhanced groundwater conditions in those areas as well. For Reaches 1, 4, 5, and all combined, NDVI and greenup steadily declined from 2015–2017, eventually falling to or below 2013 (pre-pulse) levels.
The pulse flow and subsequent base flows did not – at the scale of Reaches, and at 30 m satellite image resolution – produce effects on vegetation greenness in the riparian zone that persisted to the end of the 2017 growing season. Increases in greenness within restoration sites supplied with base flows are not sufficient to maintain the high average, Reach-level, NDVI values observed in the growing season after the 2014 pulse flow. The restoration sites may be too small to have a strong effect on Reach-level averages.
Although NDVI was highest in 2014 after the pulse flow, the magnitude is not what was achieved in previous flood years and it did not persist after 2014. A series of releases and active restoration projects will contribute to helping to rebuild the vegetation community to its former status. Since floods in these Reaches are rare, the bulk of riparian ET appears to be supported by existing underflows of water from the US (Glenn et al., 2001; Nagler et al., 2008). A pulse flow can be expected to have benefits in riparian corridor in the release year, after which it will flow into the subterranean estuary, where it may also perform ecosystem services. Active restoration projects can help make maximum use of environmental flows. These can include existing activities in Reach 4 to restore cottonwood habitat, but could be expanded to include mesquites (Prosopis spp.) in Reaches 2 and 3, where depth to groundwater is too deep for cottonwoods and willows, but the groundwater is low salinity and could support mesquites.
Data either are not available, or have limited availability, due to proprietary restrictions. Contact Pam Nagler (pnagler@usgs.gov) for more information.
PLN, EPG, CJJ conceived and designed the research; CJJ, PLN performed the experiments and analyzed the data; CJJ, PLN wrote and edited the manuscript.
The authors declare that they have no conflict of interest.
This article is part of the special issue “Earth Observation for Integrated Water and Basin Management: New possibilities and challenges for adaptation to a changing environment”. It is a result of The Remote Sensing & Hydrology Symposium, Cordoba, Spain, 8–10 May 2018.
We would like to posthumously honor Edward P. Glenn for his
dedication to the Colorado River's delta, a tri-national region including the
US, Mexico and Native American Tribal lands. We thank Edward P. Glenn for mentoring
dozens of students and helping NGO teams over four decades. Thanks to Edward P. Glenn's
passionate interest, his personal and professional investment, and his
research contributions as a prolific writer, several environmental Minutes
regarding water quality & salinity (306), base flows (319), and
restoration activities (323) have been added to the 1944 international treaty
(https://www.ibwc.gov/Treaties_Minutes/Minutes.html, last access: 6 September 2018). We wish
to thank Karl Flessa from the University of Arizona for his review and
text additions. We also wish to thank the Minute 319 Delta Science Team for
putting in countless hours of hard work and providing invaluable help on this
project. Without their help, this project would not have been possible. Any
use of trade, firm, or product names is for descriptive purposes only and
does not imply endorsement by the U.S. Government.
Edited by: Rafael Pimentel
Reviewed by: two anonymous referees
Bateman, H. L., Nagler, P. L., and Glenn, E. P.: Plot and landscape-level changes in climate and vegetation following defoliation of exotic saltcedar (Tamarix sp.) from the biocontrol agent Diorhabda carinulata along a stream in the Mojave Desert, USA J. Arid Environ., 89, 16–20, 2013.
Gee, G. W., Wierenga, P. J., Andraski, B. J., Young, M. H., Fayer, M. J., and Rockhold, M. L.: Variations in water balance and recharge potential at three western desert sites, Soil Sci. Soc. Am. J., 58, 63–72, 1994.
Glenn, E. P., Zamora-Arroyo, F., Nagler, P. L., Briggs, M., Shaw, W., and Flessa, K.: Ecology and conservation biology of the Colorado River Delta, Mexico, J. Arid Environ., 49, 5–16, 2001.
Glenn, E. P., Morino, K., Didan, K., Jordan, F., Carroll, K. C., Nagler, P. L., Hultine, K., Sheader, L., and Waugh J.: Scaling sap flux measurements of grazed and ungrazed shrub communities with fine and coarse-resolution remote sensing, Ecohydrology, 1, 316–329, 2008.
Groeneveld, D. P. and Baugh, W. M.: Correcting satellite data to detect vegetation signal for eco-hydrologic analyses, J. Hydrol., 344, 135–145, 2007.
Groeneveld, D. P., Baugh, W. M., Sanderson, J. S., and Cooper, D. J.: Annual groundwater evapotranspiration mapped from single satellite scenes, J. Hydrol., 344, 146–156, 2007.
Hinojosa-Huerta, O., Nagler, P. L., Carillo-Guererro, Y. K., and Glenn, E. P.: Effect of drought on birds and riparian vegetation in the Colorado River Delta, Mexico, Ecol. Eng., 59, 104–110, 2013.
Jarchow, C. J., Nagler, P. L., Glenn, E. P., Ramírez-Hernández, J., and Rodríguez-Burgueno, J. E.: Evapotranspiration by remote sensing: An analysis of the Colorado River Delta before and after the Minute 319 pulse flow to Mexico, Ecol. Eng., 106, 725–732, 2017a.
Jarchow, C. J., Nagler, P. L., and Glenn, E. P.: Greenup and evapotranspiration following the Minute 319 pulse flow to Mexico: An analysis using Landsat 8 normalized difference vegetation index (NDVI) data, Ecol. Eng., 106, 776–783, 2017b.
Nagler, P. L., Cleverly, J., Glenn, E. Lampkin, D., Huete, A., and Wan, Z.: Predicting riparian evapotranspiration from MODIS vegetation indices and meteorological data, Remote Sens. Environ., 94, 17–30, 2005a.
Nagler, P. L., Scott, R., Westenburg, C., Cleverly, J., Glenn, E., and Huete, A.: Evapotranspiration on western U.S. rivers estimated by the Enhanced Vegetation Index from MODIS and data from eddy covariance and Bowen ratio flux towers, Remote Sens. Environ., 97, 337–351, 2005b.
Nagler, P. L., Hinojosa-Huerta, O., Glenn, E. P., Garcia-Hernandez, J., Romo, R., Curtis, C., Huete, A. R., and Nelson, S. G.: Regeneration of Native Trees in the Presence of Invasive Saltcedar in the Colorado River Delta, Mexico, Conserva.Biol., 19, 1842–1852, 2005c.
Nagler, P. L., Glenn, E. P., Hinojosa-Huerta, O., Zamora, F., and Howard, K.: Riparian Vegetation Dynamics and Evapotranspiration for the Riparian Corridor in the Delta of the Colorado River, Mexico: Implications for Conservation and Management, J. Environ. Manage., 88, 864–874, 2008.
Nagler, P. L., Glenn, E., Scott, R., and Doody, T.: Estimating riparian and agricultural actual evapotranspiration by reference evapotranspiration and MODIS Enhanced Vegetation Index, Special Issue “Advances in Remote Sensing of Crop Water Use Estimation”, Remote Sensing, 5, 3849–3871, 2013.
Shanafield, M., Gutierrez Jurado, H., Eliana Rodríguez Burgueño, J., Ramírez Hernández, J., Jarchow, C. J., and Nagler, P. L.: Short- and long-term evapotranspiration rates at ecological restoration sites along a large river receiving rare flow events, Hydrol. Process., 31, 4328–4337, 2017.