the Creative Commons Attribution 4.0 License.
the Creative Commons Attribution 4.0 License.
 | 18 Dec 2018
Use of Sentinel 2 – MSI for water quality monitoring at Alqueva reservoir, Portugal
Gonçalo Rodrigues
Alexandra Marchã Penha
Maria Helena Novais
Maria João Costa
Rui Salgado
Maria Manuela Morais
Alqueva reservoir located in southeast of Portugal has a surface area of 250 km2 and total capacity of 4150 hm3. Since 2006 the water quality of this reservoir is explored by the authors using remote sensing techniques. First using MERIS multi-spectral radiometer on-board of ENVISAT-1 and presently with MSI multi-spectral radiometer on-board SENTINEL-2. The existence of two satellites (A and B) equipped with MSI enable the area to be revisited, under the same viewing conditions, every 2–3 days. Since 2017 the multidisciplinary project ALOP (ALentejo Observation and Prediction systems) expands the team knowledge about the physical and bio-chemical properties of the reservoir. This project includes an integrated field campaign at different experimental sites in the reservoir and its shores, at least until September 2018. Previous algorithms developed by the team for MERIS are tested with the new MSI instrument for water turbidity, chlorophyll a concentration and density of cyanobacteria. Results from micro-algae bloom occurred in late summer/early autumn 2017 on the reservoir are presented, showing the capabilities of MSI sensor for detection and high resolution mapping over the reservoir. The results are compared with in situ sampling and laboratorial analysis of chlorophyll a associated with the bloom.


The water quality monitoring of inland reservoirs is essential to ensure that it remains within acceptable boundaries or otherwise, to trigger actions that may revert the water quality degradation. The set-up of early warning systems is important for reservoirs, which may be affected by pollution events, alerting the authorities to water quality degradation episodes. The Alqueva reservoir, located in southwestern Iberian Peninsula (south of Portugal), has a total capacity of 4.150 hm3 and a surface area of 250 km2, constituting the largest reservoir in the Iberian Peninsula. It is a multi-purpose structure used for water supply, irrigation, hydroelectric power generation and recreation, thus water quality management is critical. Since 2017 the multidisciplinary project ALOP (ALentejo Observation and Prediction systems) expands the knowledge about the physical and bio-chemical properties of Alqueva reservoir. This project includes an integrated field campaign at different experimental sites in the reservoir and its shores, at least until September 2018. It aims to develop a multi-functional activity in the field of atmosphere-water-ecosystem interaction, which embraces observation, prediction and risk alert. It intends to develop tools of observation, forecasting and alert in the domains of meteorology and water (quantity and quality), at regional scale. Satellite remote sensing constitutes a useful tool to complement in situ data sampling and laboratorial analysis of water quality parameters, which is laborious and expensive and thus spatially and temporally limited. Unless a water body is adequately instrumented with in situ sensors, remote-sensing is the only suitable method to monitor the quality of remote and large inland waters (WMO, 2013) and can undoubtedly contribute to early warning systems. Several satellite remote sensing studies have been proposed using a variety of sensors over a number of worldwide reservoirs (Gholizadeh et al., 2016). Remote sensing of water bodies rely on the varying colour of natural waters that correspond to different spectral reflectances, assuming that these variations depend on the water constituents. Water remote sensing was used to monitor ocean colour already since the 1960s, and in the last three decades there has been a growing interest to apply these remote sensing techniques also to inland water quality. For this purpose, remote sensing measurements, mainly using visible and near-infrared wavelengths, are used to develop bio-optical models that aim to relate radiometric (optical) and biological quantities. Inland waters are optically complex due to the presence of several constituents that may interact, creating uncertainties in the remote sensing retrievals (Toming et al., 2016; Ogashawara et al., 2017). Thus there is a need to study inland waters at a local and regional scale and to quantify the performance of remote sensing methods to monitor inland water quality. The first remote sensing studies over Portuguese reservoirs were carried out by the authors, proposing semi-empirical bio-optical models to estimate concentrations of chlorophyll a and cyanobacteria (Potes et al., 2011), as well as turbidity (Potes et al., 2012) over Alqueva from MERIS sensor onboard ENVISAT satellite.
The launch of ESA Sentinel-2 (MSI) mission (S-2A launched in June 2015 and S-2B launched in March 2017), carrying as single payload the Multi-Spectral Instrument (MSI), brought a great opportunity to study inland reservoirs. It presents a systematic global coverage of two to three days at mid-latitudes, which supports monitoring of changes in reservoirs, with relatively high spatial resolution. MERIS sensor, on board ENVISAT, presented maximum spatial resolution of 300 m, whereas MSI presents a spatial resolution of 10, 20 or 60 m, depending on the spectral band. Potes et al. (2011, 2012) proposed a method to monitor chlorophyll a, cyanobacteria and turbidity over inland reservoirs using MERIS data. The objective of this work is to show the potential of MSI used with the set of algorithms developed for MERIS, to study the water quality of inland waters. Specifically, a micro-algae bloom that occurred in early autumn 2017 is analysed and its evolution related to the influence of a hurricane progressing over the Eastern North Atlantic region.
Section 2 presents the data used and methodology. Results are presented and discussed in Sect. 3 and finally Sect. 4 summarizes the main conclusions.
Data from Sentinel 2 is used in this work, namely level 2A from MSI instrument, which corresponds to images with atmospheric correction, providing information of surface reflectance in 12 spectral channels from 443 to 2190 nm (central wavelength). The product Maximum Chlorophyll Index (MCI) was also extracted from the level 2 images which is an indicator of the amount of chlorophyll present in water mass (Gower et al., 2008) and thus a useful tool in the monitoring of algae blooms of inland waters. The bands selected for MCI index were the 665, 705 and 740 nm.
The algorithms from Potes et al. (2011, 2012) developed for MERIS are:
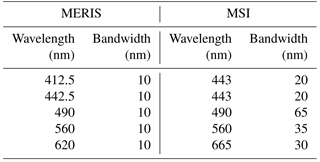
Table 1 presents the information about MERIS bands used in the algorithms to estimate the concentration of chlorophyll a (Chl a in Eq. 1), density of cyanobacteria (Cya in Eq. 2) and water turbidity (Turb in Eq. 3). In the same table the equivalent MSI wavelengths applied in this work is presented.
Table 1MERIS bands wavelengths and equivalent MSI bands used in the algorithms.
The algorithms represented by Eqs. (1) to (3) were applied now to the same water body as in Potes et al. (2011, 2012). The chlorophyll a concentration was also obtained on a bimensal basis from in situ sampling and laboratory analysis in the framework of ALOP project, in order to validate the results. The method used was the molecular absorption spectroscopy and the equations developed by Lorenzen (1967).
Alqueva reservoir project was concluded in 2002 and the reservoir reached the capacity of 80 % in March 2004. Figure 1 shows the surface area of the reservoir at its full capacity as well as the sites considered in this work.

Figure 1Map of Alqueva reservoir located in Southeast Portugal. The sites used in this work are also represented.
The algorithms developed by Potes et al. (2011, 2012) for MERIS have been applied to MSI imagery in Alqueva reservoir. ALOP field campaign is ongoing since January 2017 and a case study of October 2017 was chosen, because this was a particular month in Portugal with the influence of Ophelia hurricane amidst a very dry period. Ophelia started as a tropical storm but it reached category 3 hurricane in Saffir–Simpson hurricane wind scale, South of Azores islands being the strongest hurricane ever recorded so far East in the Atlantic (Fig. 2). In its trajectory towards Ireland it started to lose strength as is entered in cold waters being very close to Iberian Peninsula, about 360 km from Cape Finisterre (Spain).
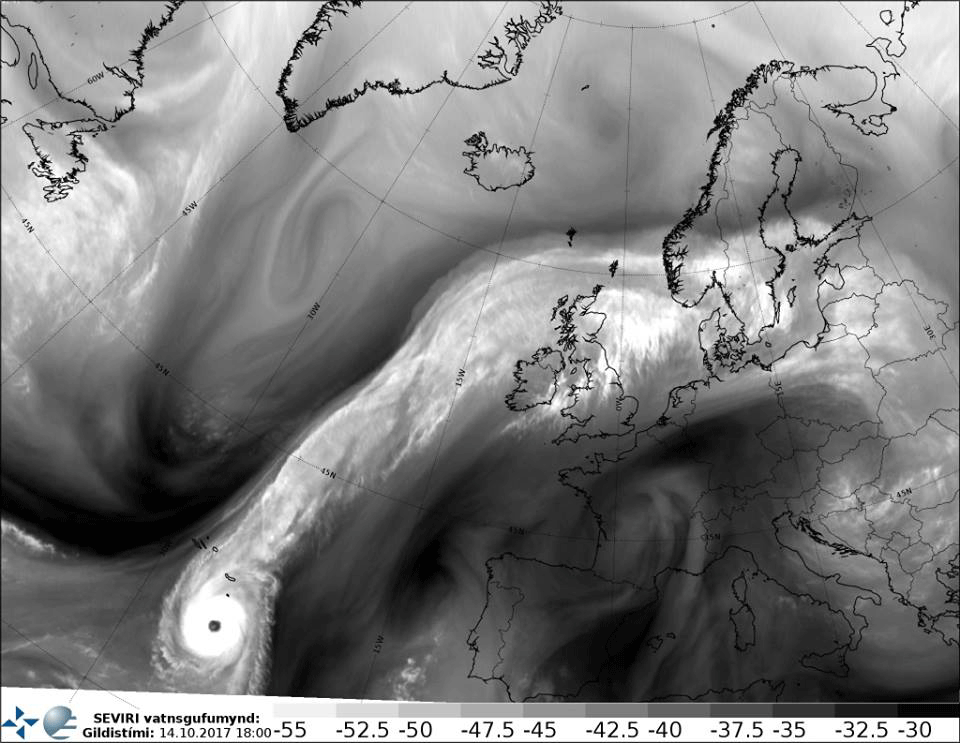
Figure 2Spinning Enhanced Visible and Infrared Imager (SEVIRI) image of hurricane Ophelia located South of Azores islands on 14 October 2017, at 18:00 UTC (https://irishweatheronline.wordpress.com/, last access: 15 April 2018).
This hurricane brought a meteorological breakup window in the unprecedented drought scenario that the country was facing by October (which is normally the beginning of the rainy season). In particular, this event led to the increase of wind speed and relative humidity and a decrease in the air temperature. Precipitation was concentrated in two days (17 and 18 October) with an accumulated value of 32.0 mm. Figure 3 shows the evolution of air temperature for October 2017 recorded in CidAlmeida meteorological station installed in the area of Alqueva (ALOP project) where the influence of the hurricane can be detected between 16 and 22 October.
Figure 4 presents a wind rose from the same inland station for the period 15 to 22 October, where the stronger winds from the South and West quadrants are clearly visible, as a consequence of hurricane Ophelia passing by Portugal.
According to this scenario, three Sentinel-2 images from October 2017 were selected on clear sky days (12, 22 and 29) to use the MSI instrument in Alqueva reservoir. Table 2 shows acquisitions date and time for both satellite data and in situ water collection.
On 12 October the reservoir was under a micro-algae bloom especially on the northern part as can be seen in Fig. 5 (row a) in terms of concentration of chlorophyll a, density of cyanobacteria and water turbidity. Values greater than 50 mg m−3 of chlorophyll a were estimated for the northern part, as well as greater than 75 000 cells mL−1 cyanobacteria with turbidity values reaching 30 NTU.
On 22 October (Fig. 5 – row b), six days after, all the three parameters decreased sharply in the northern part probably due to very different weather conditions in the six days under the influence of the hurricane Ophelia passage along the Portuguese coast. It is well known that lower temperatures inhibit the phytoplankton growth (Wu et al., 2015) the same occurs with increasing wind speed and precipitation, which leads to increasing in water mixing (Fleming-Lehtinen and Laamanen, 2012). For these reasons a regress of the bloom due to the changes in meteorological conditions was expected.
Table 2MSI acquisition dates and in situ date for water collection.
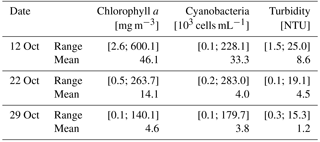
In the central part of the reservoir the values are above the eutrophic threshold for chlorophyll a presented by Bukata et al. (1995), of 6 mg m−3. In addition, most of the branches of reservoir present values are above the ecological potential and eutrophic threshold for chlorophyll a for reservoirs in the South of Portugal, which according with the Water Frame Directive is 9.5 and 8 mg m−3, respectively (INAG, 2009). Nine days after 22 October, on the images of 29 October presented in Fig. 5 (row c) the reservoir is clear from the presence of the micro-algae bloom. All the three parameters present low values indicating good water quality on that day. Nevertheless, some thinner branches of the reservoir still present some occasional high values. A summary table with minimum, maximum and mean values is presented for the three parameters in the three days (Table 3).
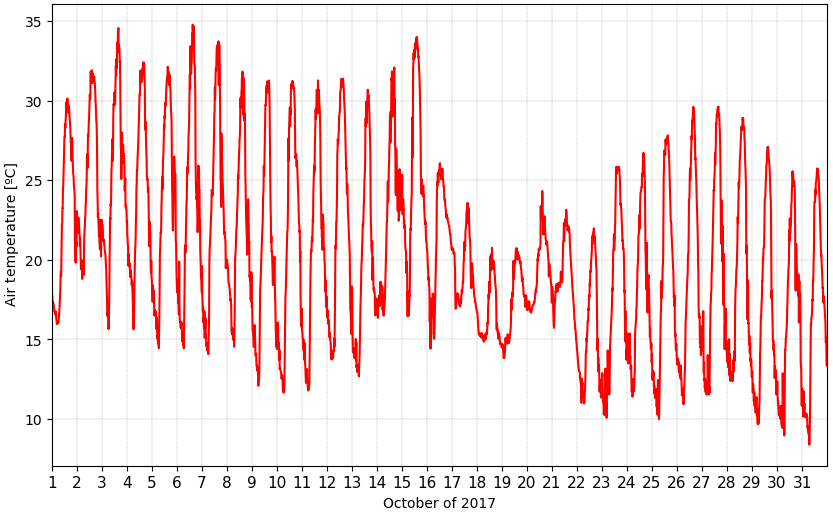
Figure 3One-minute averages of air temperature recorded in CidAlmeida meteorological station located inland nearby Alqueva-Montante site (Fig. 1) for October 2017.
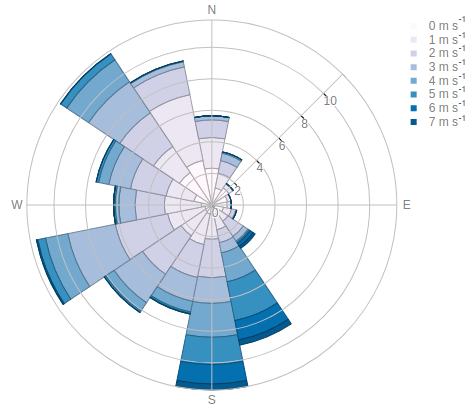
Figure 4Wind rose recorded in a meteorological station located inland nearby Alqueva-Montante site (Fig. 1) for the period 15 to 22 October 2017.
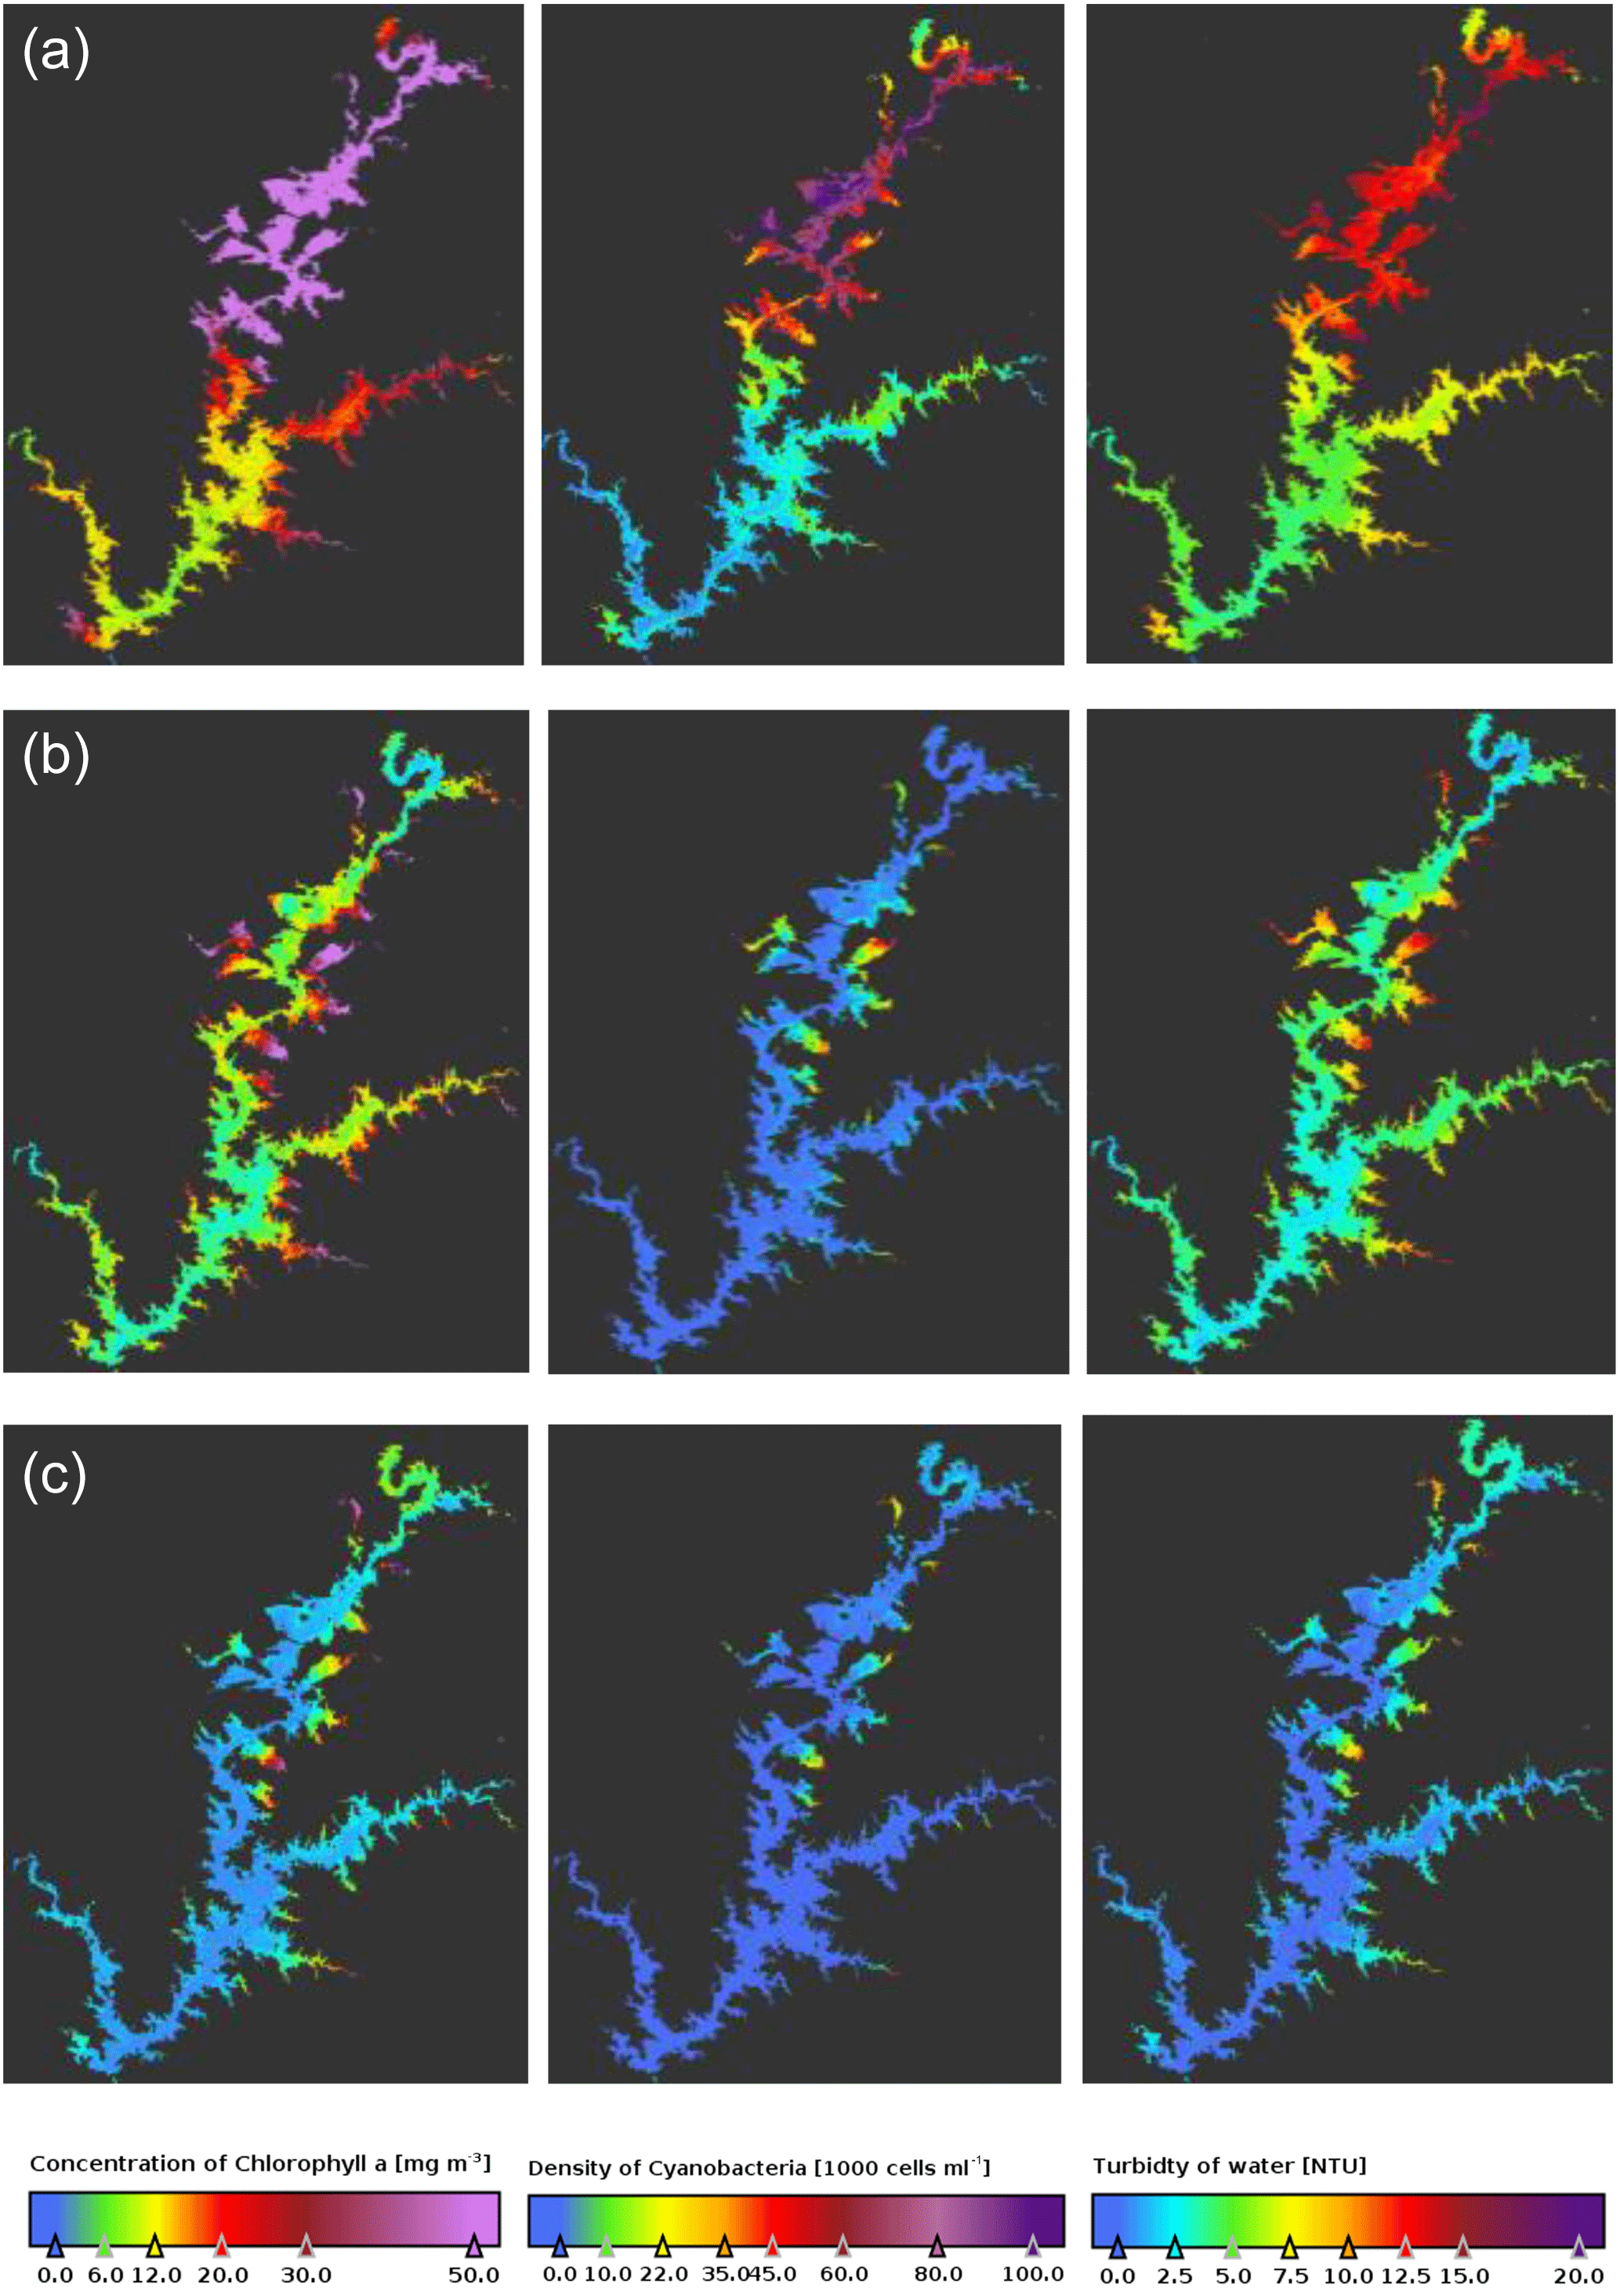
Figure 5Concentration of chlorophyll a, density of cyanobacteria and water turbidity estimated from the Eqs. (1) to (3) for 12 October (row a), 22 October (row b) and 29 October (row c).
Figure 6 presents a scatter plot between the MCI and concentration of chlorophyll a obtained from satellite. All pixels from 22 October are used in the plot, in a total of 28 251 points. These two parameters are well correlated (correlation coefficient of 0.70) with a RMSE (Root Mean Square Error) of 21.5 mg m−3. Future work foresees the use of longer data series to quantify MCI as chlorophyll concentration.
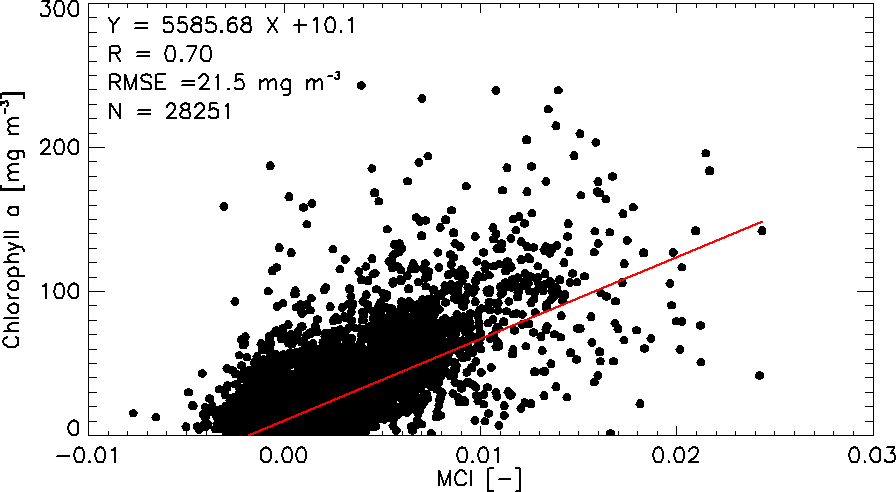
Figure 6Scatter plot between MCI and concentration of chlorophyll a estimated by Eq. (1) for day 22 October all pixels.
Satellite derived results were compared with data obtained from laboratory analysis. Unfortunately, there are no water laboratory analyses for the same days as MSI acquired images, rather five days before (22 October) and two days after (29 October). From the analysis of MSI retrieved data, it was concluded that the water quality has improved from 22 to 29 October and thus it is expected that the water analysis should be more or less similar or in-between the values of MSI. This is shown in Fig. 7 where the chlorophyll a concentration estimated from MSI (22 and 29 October) and obtained in laboratory (27 October) for five sites (Fig. 1) is plotted. The results are generally in agreement. From 22 to 29 October, MSI reports a decrease in chlorophyll a concentration and the laboratory analysis (middle day) confirms this decrease presenting a middle value in all sites, except for Alqueva-Montante and Site 1, which presents a very similar value nevertheless slightly greater than the MSI value for 22 October. In these two sites the MSI values, nearby the in situ measurement place, were more heterogeneous than in the other sites probably due to their central location where the water is under more currents than in the other sites, in this part of the year. The results also suggest that the decrease of chlorophyll a was not linear in time, but more pronounced near the end of the five day period.
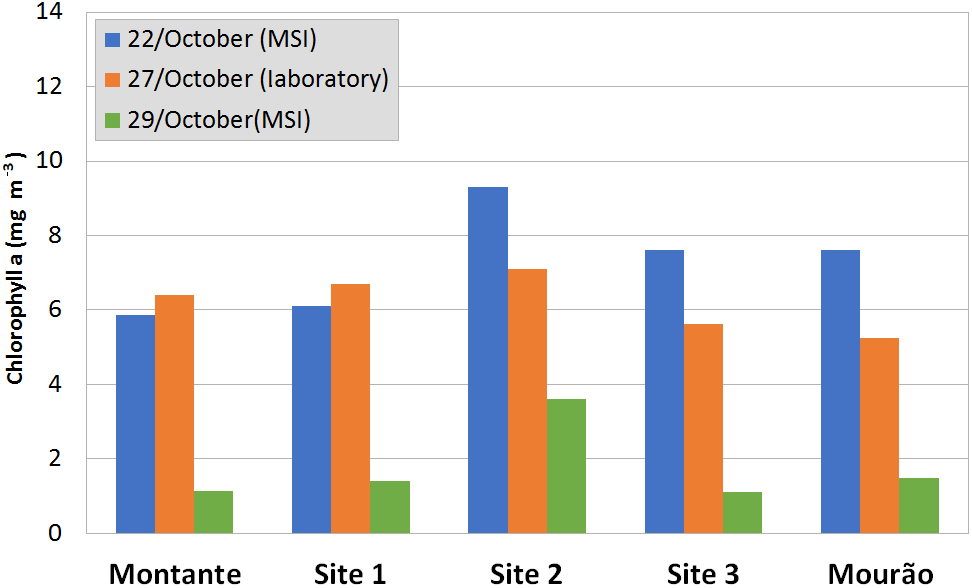
Figure 7Bar plot of concentration of chlorophyll a estimated by Eq. (1) for 22 and 29 October and obtained in laboratory for 27 October for 5 sites shown on Fig. 1.
In this work the potential of Sentinel-2 MSI instrument for monitoring the water quality of inland waters is shown. In the case study reported, different conditions of Alqueva reservoir are analysed for one month. Systems like Alqueva reservoir are highly dynamic and respond rapidly to changes in atmospheric conditions, thus is very importance to have these kinds of tools for monitoring the water surface as a whole. In this work, a set of algorithms developed for another space borne spectroradiometer (MERIS) were applied with good results. The team is now working to tune the algorithms in order to make use of the full potential of MSI instrument. Specific algorithms were already developed successfully by Toming et al. (2016) using the same MSI instrument over Estonian lakes, regarding chlorophyll a concentration as well as colored dissolved organic matter (CDOM) and dissolved organic carbon (DOC).
Data used in this work is available on request to the first author.
MP conceptualized and led the team on this research. He also wrote great part of the manuscript and carried out the corrections during the write-up. GR gathered, processed and prepared the spatial data and maps used for this article. AMP and MHN were responsible for the in situ and laboratory data analysis used in the work. MJC participated in the data processing and discussion and wrote the first part of the manuscript. RS and MMM participated in the discussion of results and reviewed the manuscript for necessary corrections.
The authors declare that they have no conflict of interest.
This article is part of the special issue “Earth Observation for Integrated Water and Basin Management: New possibilities and challenges for adaptation to a changing environment”. It is a result of The Remote Sensing & Hydrology Symposium, Cordoba, Spain, 8–10 May 2018.
The work was funded by the ALOP project (ALT20-03-0145-FEDER-000004) and also
through the European Union through the European Regional Development Fund,
included in the COMPETE 2020 (Operational Program Competitiveness and
Internationalization) through the ICT project (UID/GEO/04683/2013) with the
reference POCI-01-0145-FEDER 007690.
Edited
by: María José Polo
Reviewed by: two anonymous
referees
Bukata, R. P., Jerome, J. H., Kondratyev, K. Y., and Pozdnyakov, D. V.: Optical Properties and Remote Sensing of Inland and Coastal Waters, 135–250, CRS Press, Boca Raton, Florida 33431, USA, 1995.
Fleming-Lehtinen, V. and Laamanen, M.: Long-term changes in Secchi depth and the role of phytoplankton in explaning light attenuation in the Baltic Sea, Estuar. Coast. Shelf S., 102–103, 1–10, 2012.
Gholizadeh, M. H., Melesse, A. M., and Reddi, L.: A Comprehensive Review on Water Quality Parameters Estimation Using Remote Sensing Techniques, Sensors, 16, 1298, https://doi.org/10.3390/s16081298, 2016.
Gower, J. F., King, R. S., and Goncalves, P.: Global monitoring of plankton blooms using MERIS MCI, Int. J. Remote Sens., 29, 6209–6216, https://doi.org/10.1080/01431160802178110, 2008.
INAG (Instituto da Água Instituto Público): Critérios para a Classificação do Estado das Massas de Água Superficiais – Rios e Albufeiras, Ministério do Ambiente, do Ordenamento do Território e do Desenvolvimento Regional, Lisboa, Portugal, 2009.
Lorenzen, C. J.: Determination of chlorophyll and phaeopigments: Spectrophotometric equations, Limnol. Oceanogr., 12, 348–356, 1967.
Ogashawara, I., Mishra, D. R., and Gitelson, A. A.: Chapter 1 – Remote Sensing of Inland Waters: Background and Current State-of-the-Art, in: Bio-optical Modeling and Remote Sensing of Inland Waters, edited by: Mishra, D. R., Ogashawara, I., and Gitelson, A. A., Elsevier, 1–24, https://doi.org/10.1016/B978-0-12-804644-9.00001-X, 2017.
Potes, M., Costa, M. J., Silva, J. C. B., Silva, A. M., and Morais, M.: Remote sensing of water quality parameters over Alqueva reservoir in the south of Portugal, Int. J. Remote Sens., 32, 3373–3388, https://doi.org/10.1080/01431161003747513, 2011.
Potes, M., Costa, M. J., and Salgado, R.: Satellite remote sensing of water turbidity in Alqueva reservoir and implications on lake modelling, Hydrol. Earth Syst. Sci., 16, 1623–1633, https://doi.org/10.5194/hess-16-1623-2012, 2012.
Toming, K., Kutser, T., Laas, A., Sepp, M., Paavel, B., and Nõges, T.: First Experiences in Mapping Lake Qater Quality Parameters with Sentinel-2 MSI Imagery, Remote Sens., 8, 640, https://doi.org/10.3390/rs8080640, 2016.
WMO: Planning of water-quality monitoring systems, WMO-No. 1113, Geneva, Switzerland, 2013.
Wu, Z., Zhang, Y., Zhou, Y., Liu, M., Shi, K., Yu, Z., and Lin, Y.-P.: Seasonal-Spatial Distribution and Long-Term Variation of Transparency in Xin'anjiang Reservoir: Implications for Reservoir Management, Int. J. Environ. Res. Pu., 12, 9492–9507, 2015.