the Creative Commons Attribution 4.0 License.
the Creative Commons Attribution 4.0 License.
 | 22 Apr 2020
IoT technology and big data processing for monitoring and analysing land subsidence in Central Taiwan
Wei-Chia Hung
Yi-An Chen
Cheinway Hwang
Over 1992–2018, groundwater overexploitation had caused large-scale land subsidence in the Choshui River Alluvial Fan (CRAF) in Taiwan. The Taiwan High Speed Railway (THSR) passes through an area of severe subsidence in CRAF, and the subsidence poses a serious threat to its operation. How to effectively monitor land subsidence here has become a major issue in Taiwan. In this paper, we introduce a multiple-sensor monitoring system for land subsidence, including 50 continuous operation reference stations (CORS), multi temporal InSAR (MT-InSAR), a 1000 km levelling network, 34 multi-layer compaction monitoring wells and 116 groundwater monitoring wells. This system can monitor the extent of land subsidence and provide data for studying the mechanism of land subsidence. We use the Internet of Things (IoT) technology to control and manage the sensors and develop a bigdata processing procedure to analyse the monitoring data for the system of sensors. The procedure makes the land subsidence monitoring more efficient and intelligent.


Due to the continuous growth of population and economy in Taiwan, more water resources are needed. The use of the groundwater resources is inevitable when the surface water sources become insufficient. Groundwater overexploitation may result in land subsidence and other disasters. In coastal areas, sea water can intrude the water-bearing stratum and result in soil salinization. The salinization can degrade the vital functions of the soil and the salinized land can no longer support industry developments are downgraded. The underground water resources will no longer be utilized. These land subsidence problems will increase the social cost. Selected cases of land subsidence (Tosi et al., 2007; Tomás et al., 2010; Hung et al., 2011).
Taiwan is located in the subtropical monsoon region, and the climate of Taiwan is oceanic tropical and subtropical. The rainfall is plentiful; the annual rainfall reaches up to 2500 mm, which is 2.5 times of the average world rainfall. However, Taiwan is a country suffering from severe water shortage due to a number of reasons. Taiwan is highly populated, with foothills and high mountains over 2/3 of the island. Because of the steep terrains, the discharge times of major rivers to the oceans are short. As Taiwan's economy continues to grow the total water consumption continues to rise rapidly. As a result, groundwater now has become a major water source. Overexploitation of the groundwater is common in the suburban areas. In particular, severe land subsidence has occurred in the southwestern coastal areas, especially over Choushui River Alluvial Fan (CRAF) in recent years.
CRAF is the most important agricultural area in western, central Taiwan, with elevations ranging from 0 to 100 m. CRAF covers a total area of 2000 km2 and is bounded by Wu River (north), Pekang Creek (south), Douliu Mound (east) and Taiwan Strait (west). Figure 1 shows the geographical location of CRAF, which is centered at 24.0∘ N and 120.5∘ E.
Choshui River is the longest river in Taiwan. The sediments in CRAF originate from rock formations in the the river's upstream watershed, including slate, metamorphic quartzite, shale, sandstone, and mudstone (Fig. 2). Sediment loads composed of weathered rock fragments of different sizes gradually settled on the riverbed, floodplain, and seabed to form CRAF. The head of CRAF contains mainly gravel and coarse sand, and theproximal CRAF is a delta covered by fine sand. Because the upstream watershed area of Choshui River is wide and infiltrative, surface water in the head of the fan penetrates the ground to recharge the sub-surface aquifers over CRAF.
According to the statistics of Water Resource Agency of Taiwan, the extracted groundwater in Yunlin is 94 metric tons per day, and is 305 million tons per year. Without enough recharge, the withdrawal of groundwater can decrease the water level and consequently reduce the porous pressure and increase the effective stress, inevitably leading to land subsidence. The Taiwan High Speed Rail (THSR) passes through Yunlin, where subsidence poses a serious threat to its operation (Hung et al., 2011).

Figure 1Geographical location of Choushui River Alluvial Fan (CRAF).
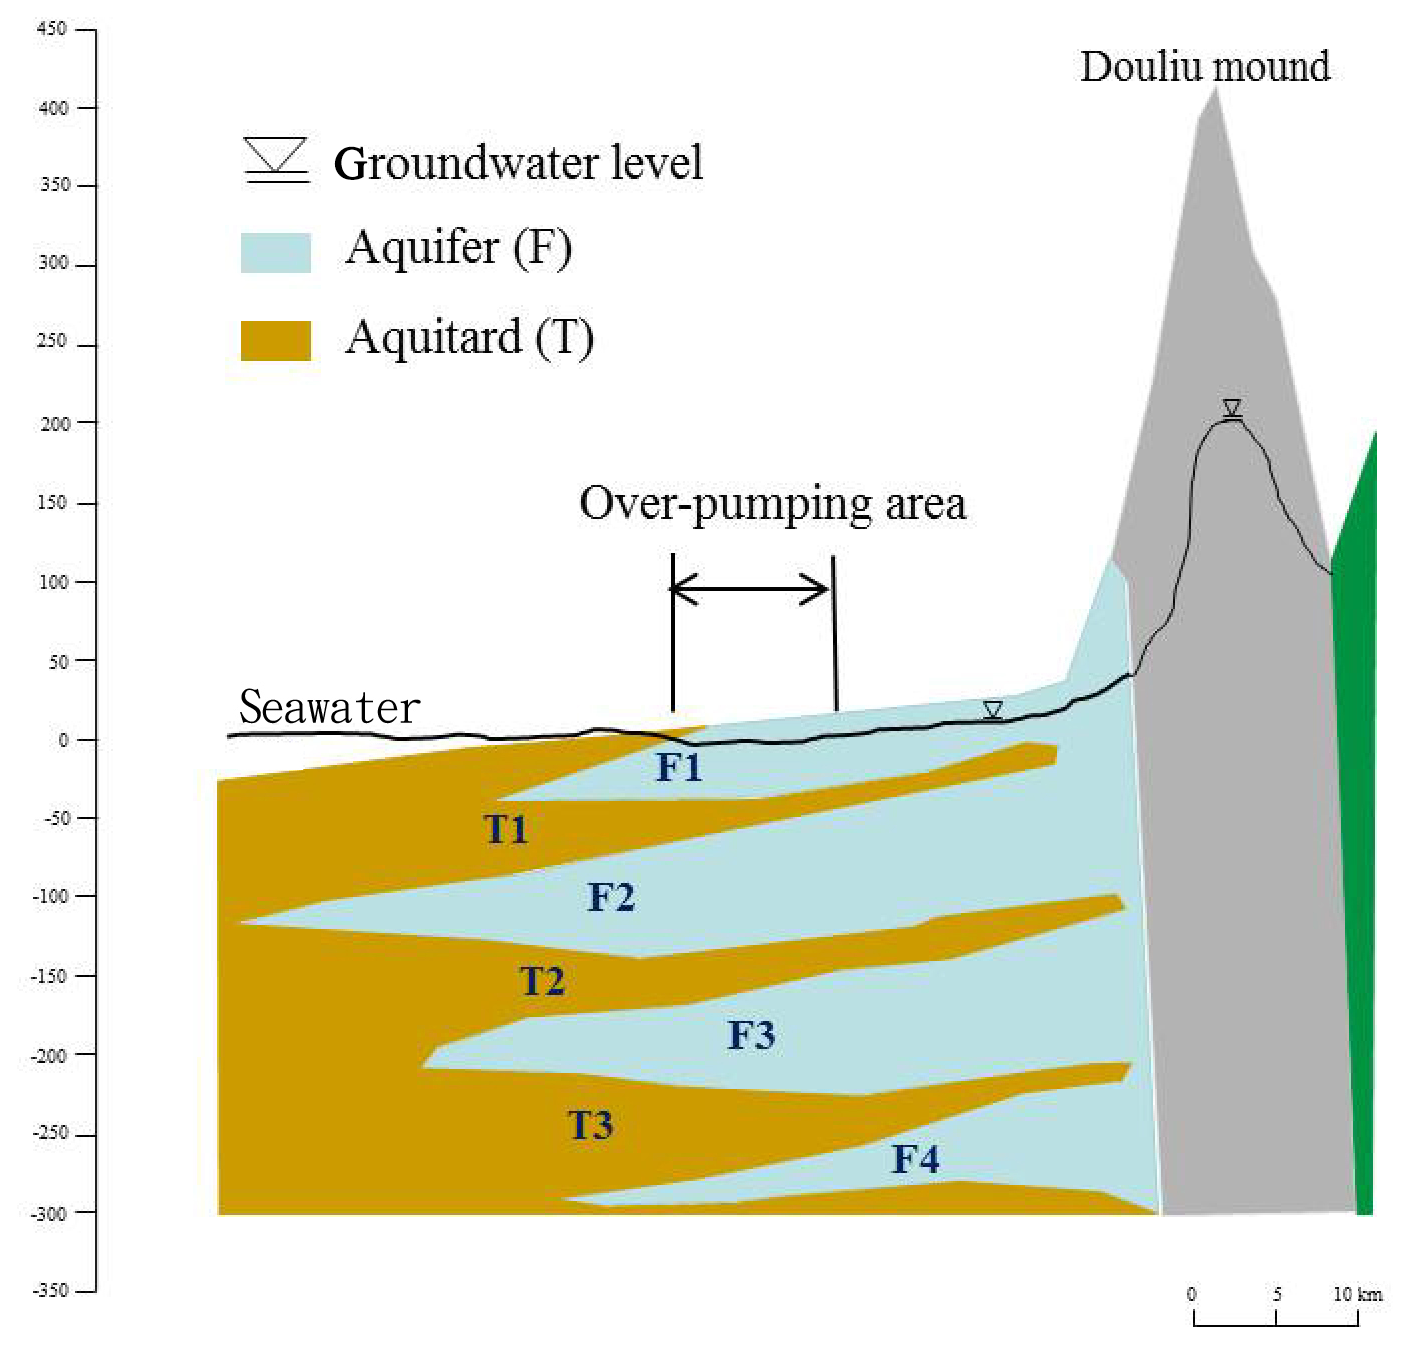
Figure 2Geological settings of Choshui River Alluvial Fan (modified from Central Geological Survey of Taiwan, http://www.moeacgs.gov.tw/, last access: December 2019).
In order to investigate the mechanism of land subsidence in central Taiwan, a multi-sensor monitoring system is installed. The system includes InSAR, GPS, leveling, multi-layer compaction monitoring well and Piezometer. Figure 3 shows a conceptual picture of the multi-sensor monitoring system. These sensors complement each other in spatial and temporal resolutions, and the results from these sensors can be compared for validation of the observed land subsidence. With a good spatial correlation and proper environmental corrections for Sentinel images, the method of Small Baseline Subset Differential (SBAS) will deliver areal vertical displacements accurate to few cm at a 25 m spatial resolution and at a time scale equivalent to the satellite repeat period. At the continuous GPS stations, the accuracy of vertical displacements is about 1 cm from the daily solutions. With precision levels and adequate correction models, leveling can deliver point-wise vertical displacements accurate to few mm at the leveling benchmarks. Figure 4 shows the distributions of leveling networks, continuously operating reference Stations (CORS) of GPS, groundwater monitoring wells and multi-layer compaction monitoring wells used in this paper.
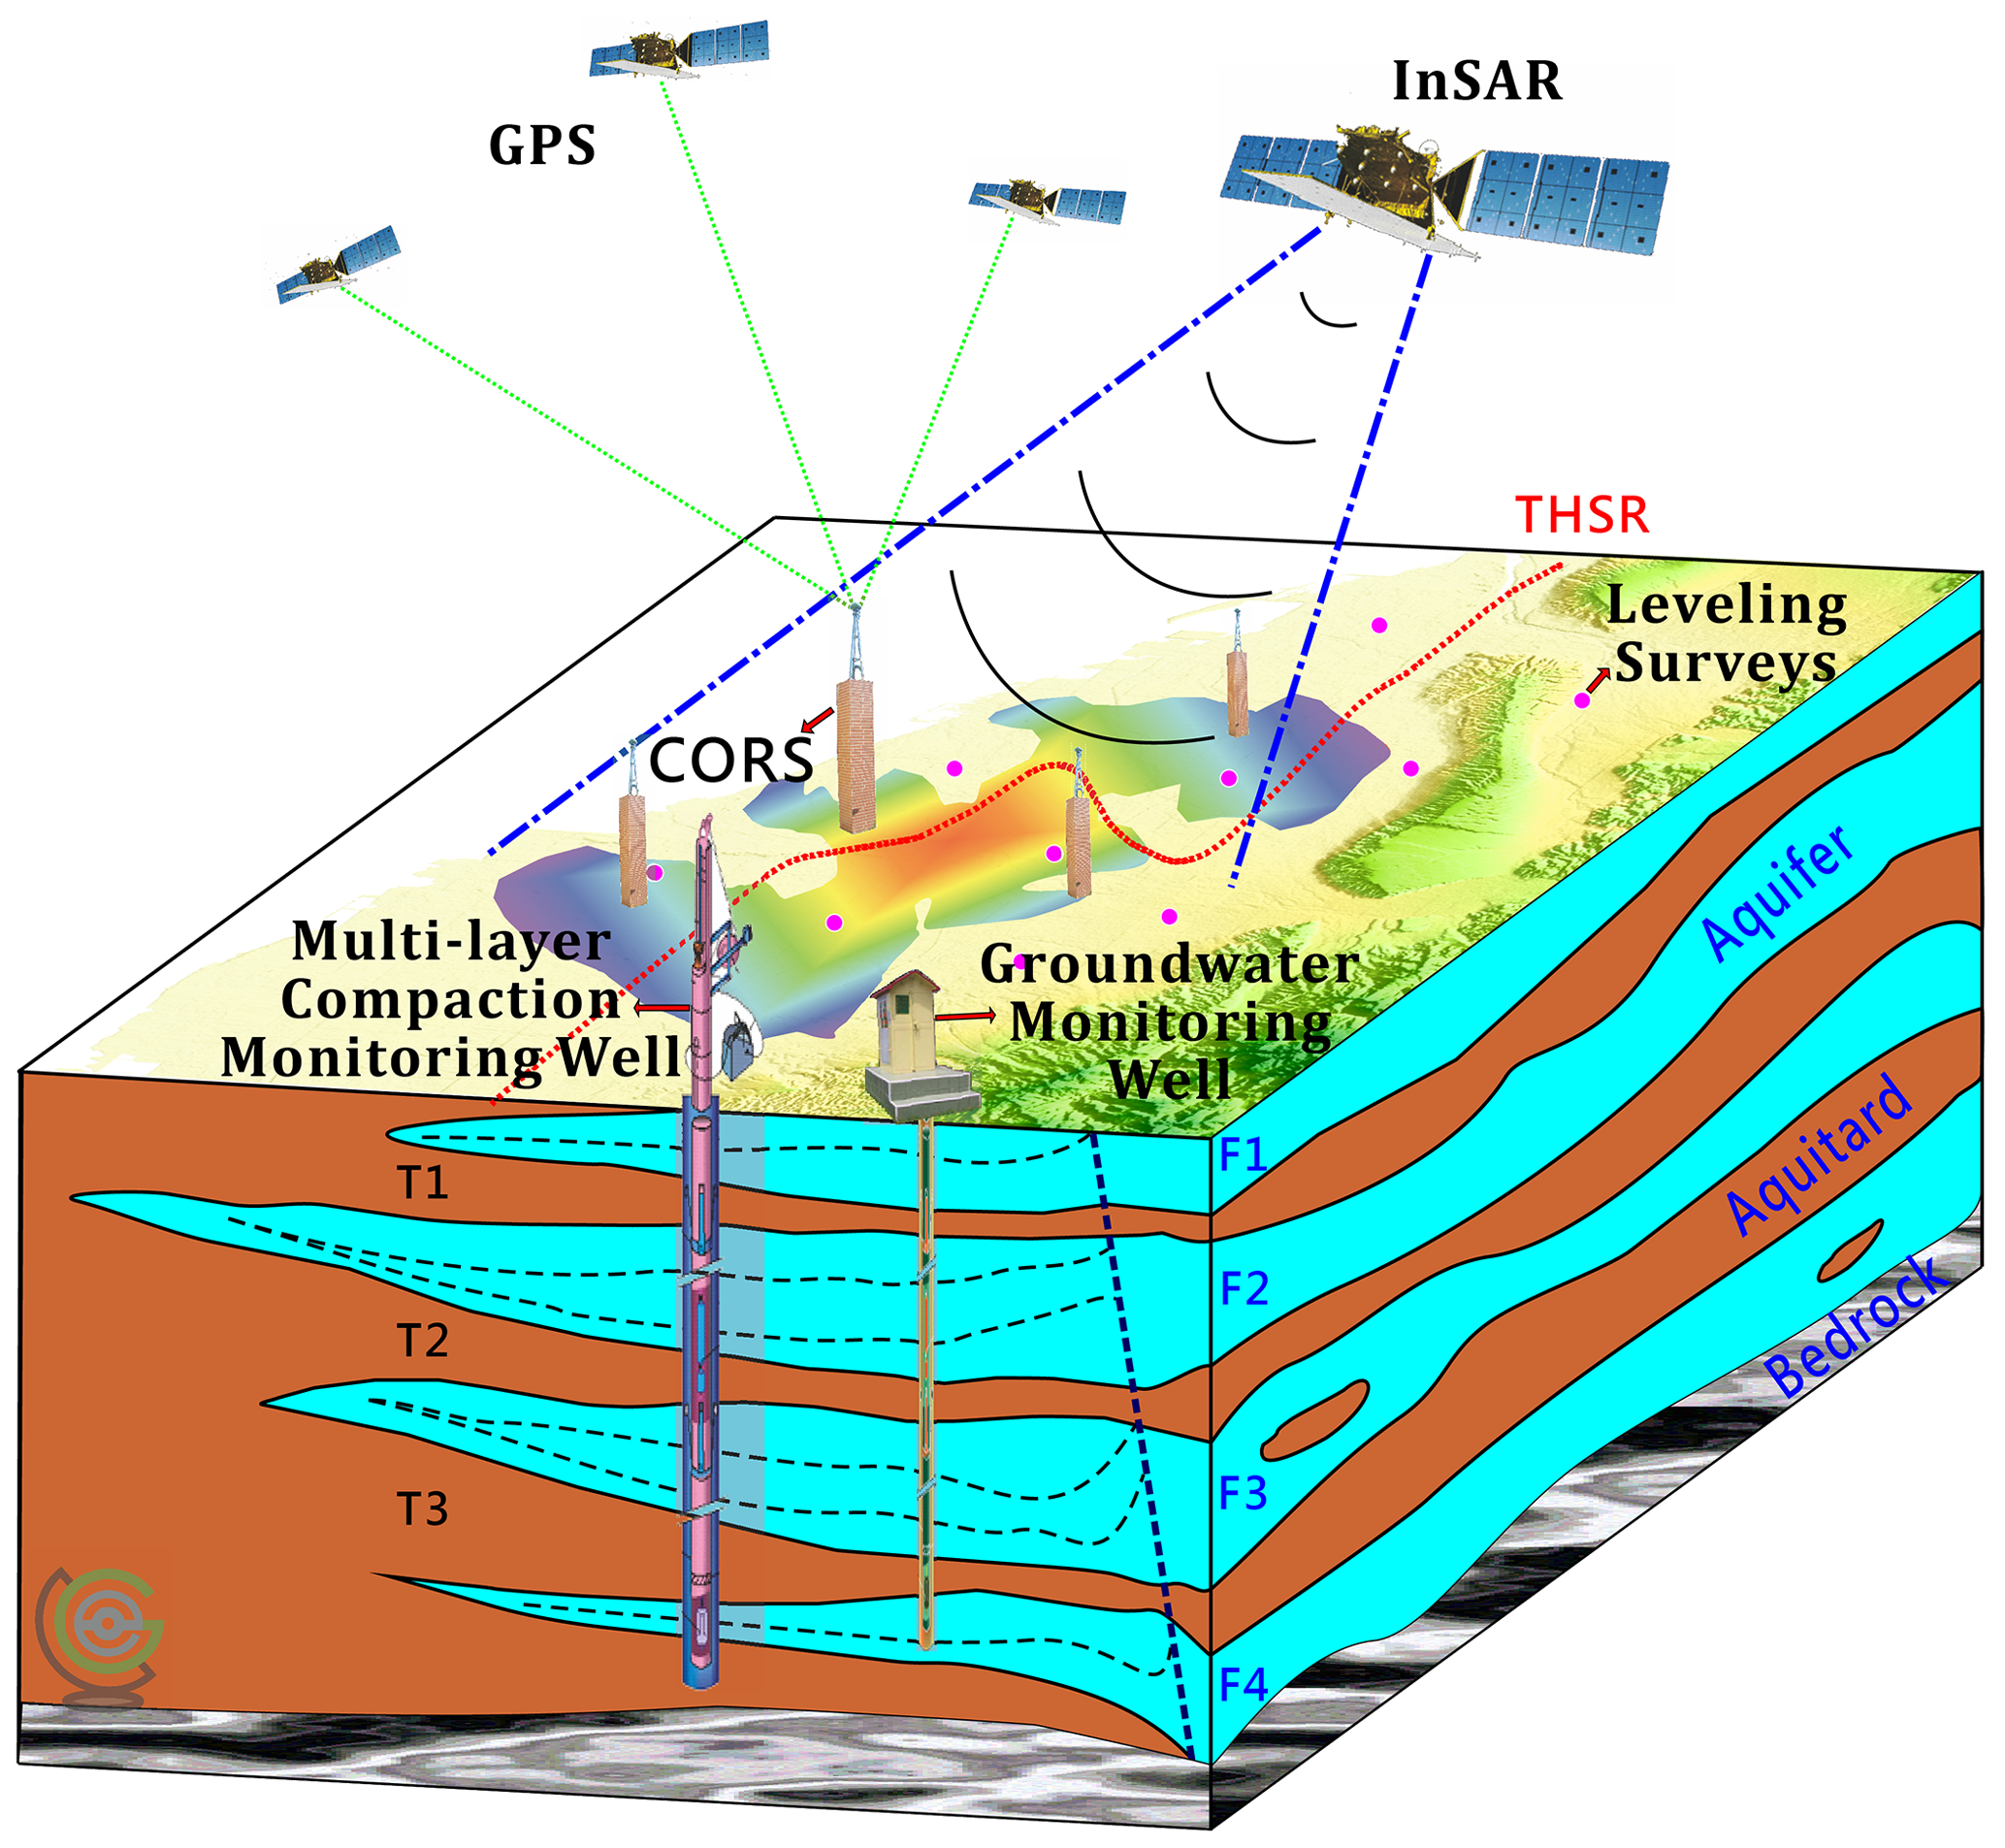
Figure 3A conceptual picture of the multi-sensor land subsidence monitoring system in central Taiwan.
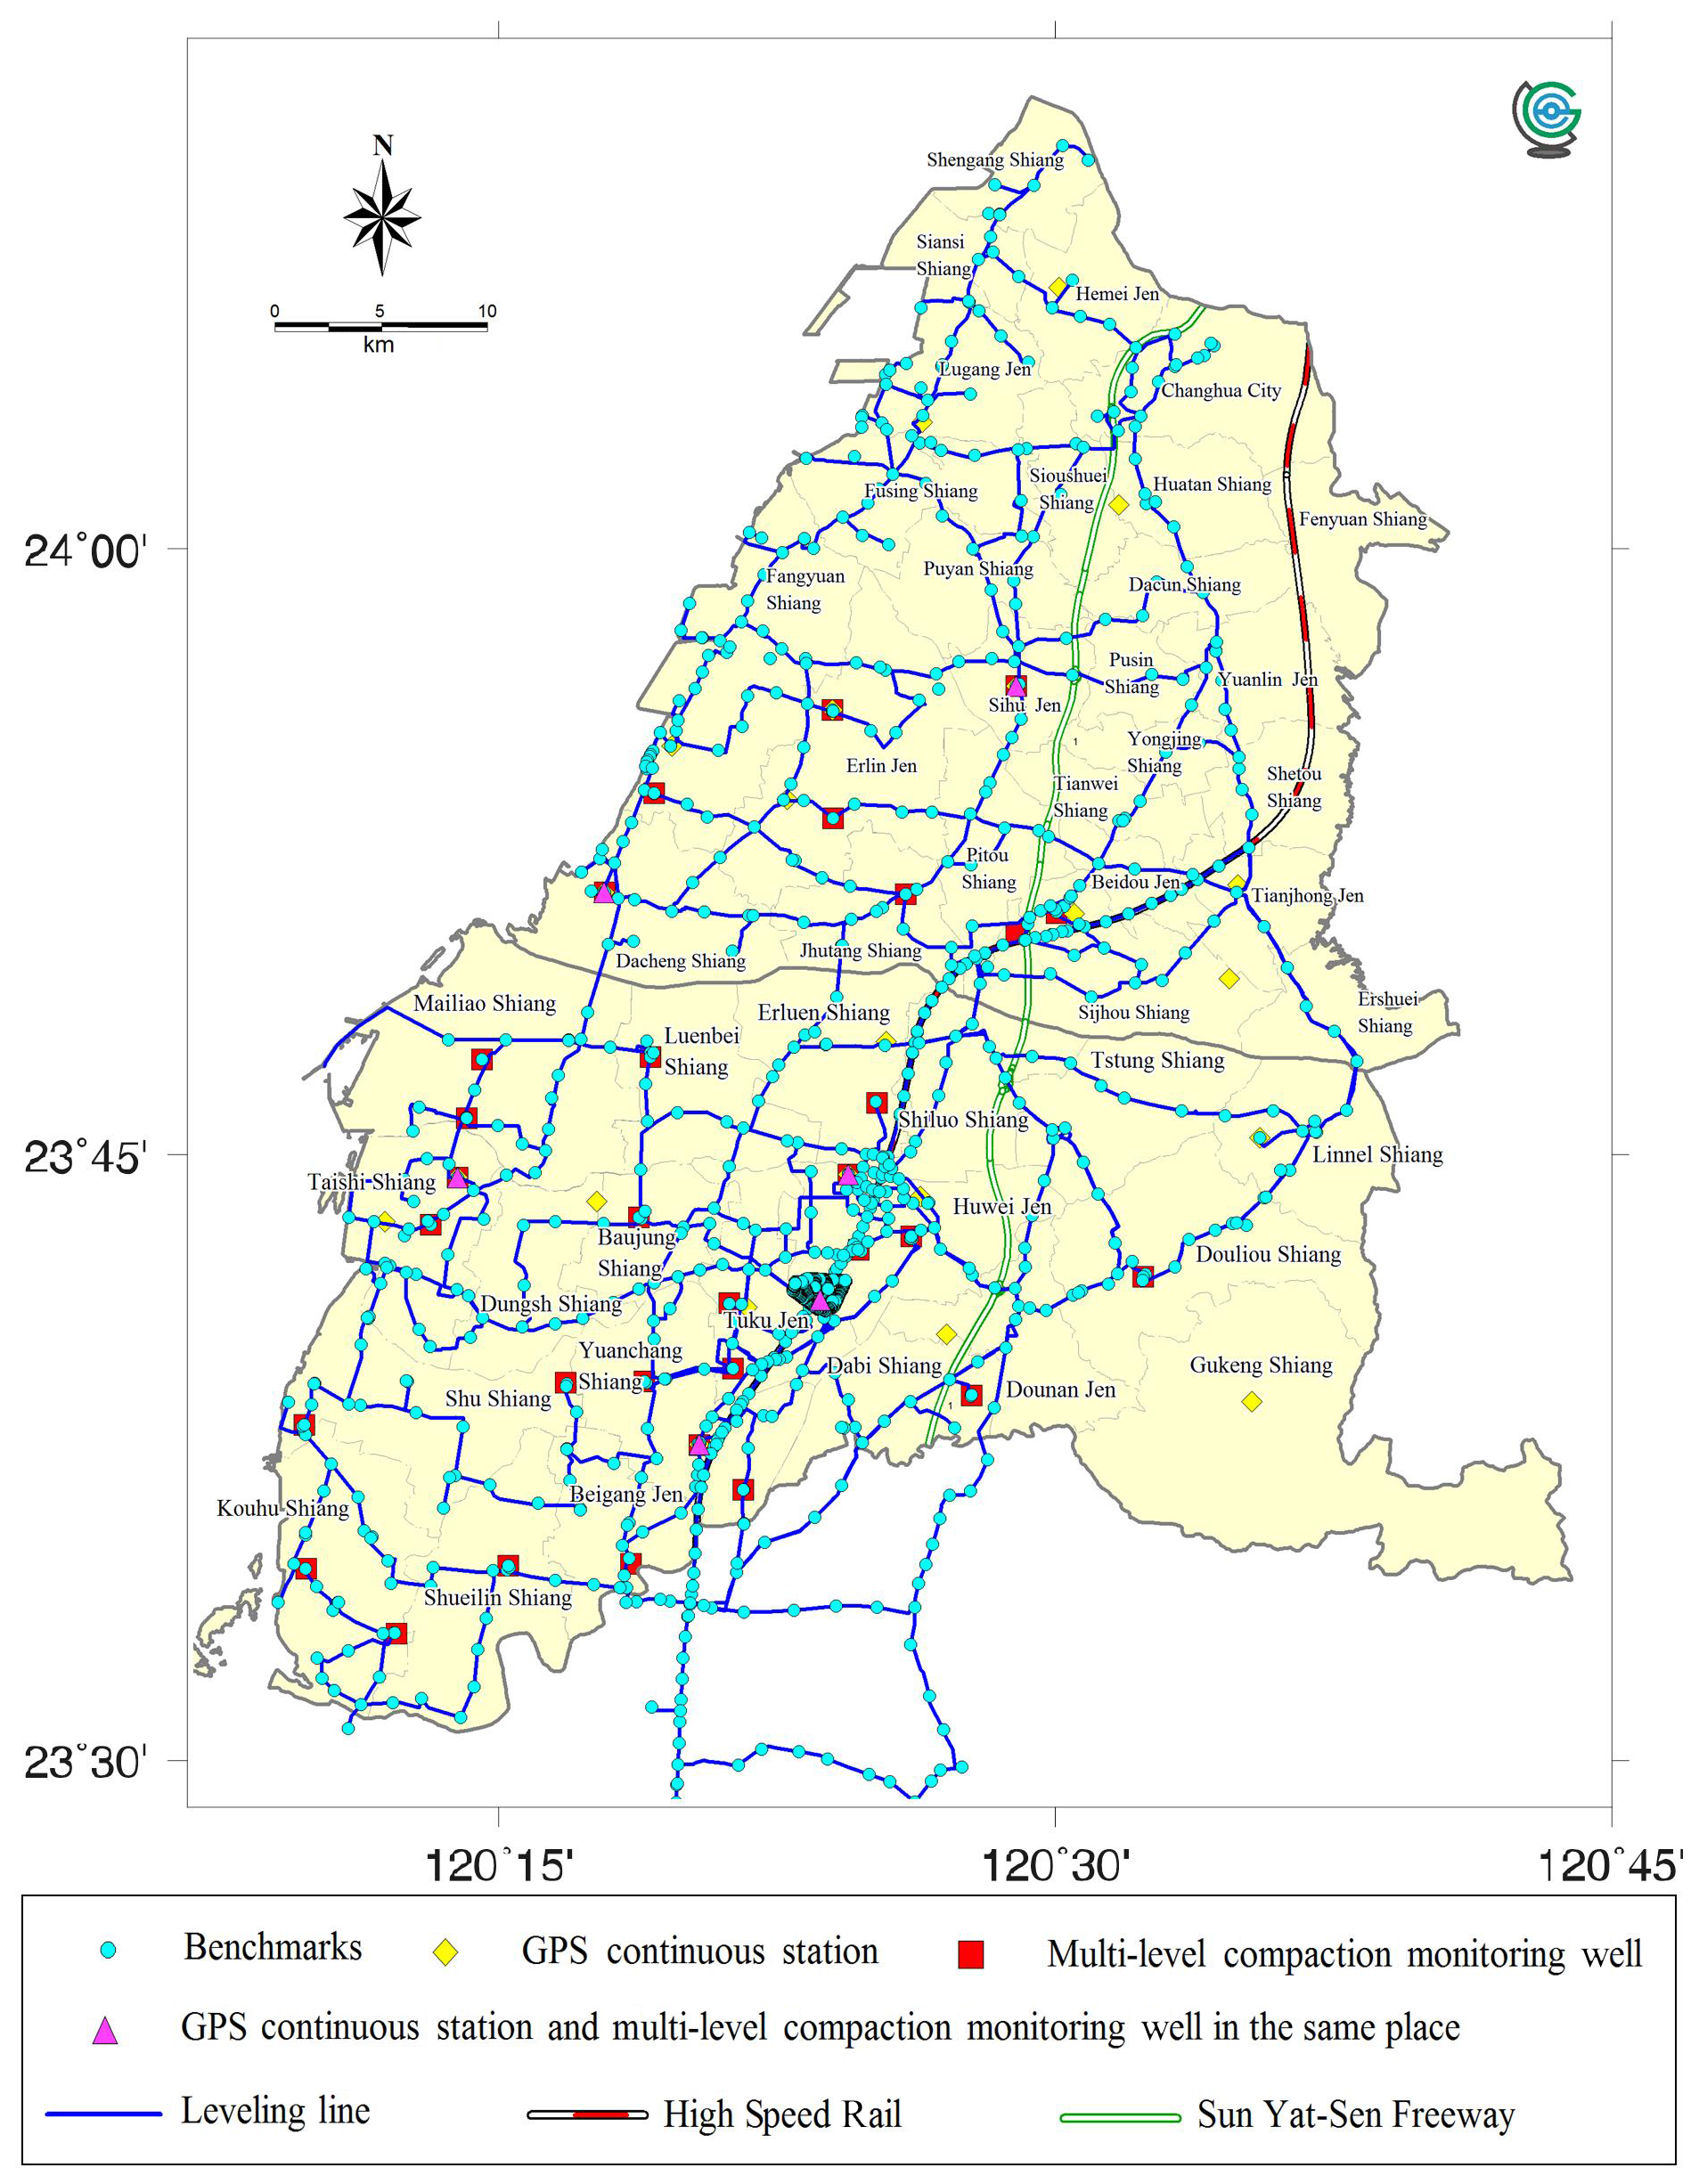
Figure 4Distributions of leveling benchmarks, monitoring wells and CORS GPS stations in CRAF, the names of townships in Yunlin County and Changhua County are shown here.
In this study, leveling and InSAR results were used to detect the land subsidence area and calculate land subsidence rate in CRAF. In the center of the bowl-shaped subsidence area, the data from the CORS GPS stations and multi-layer compaction monitoring wells were used to analyze the mechanism of land subsidence.
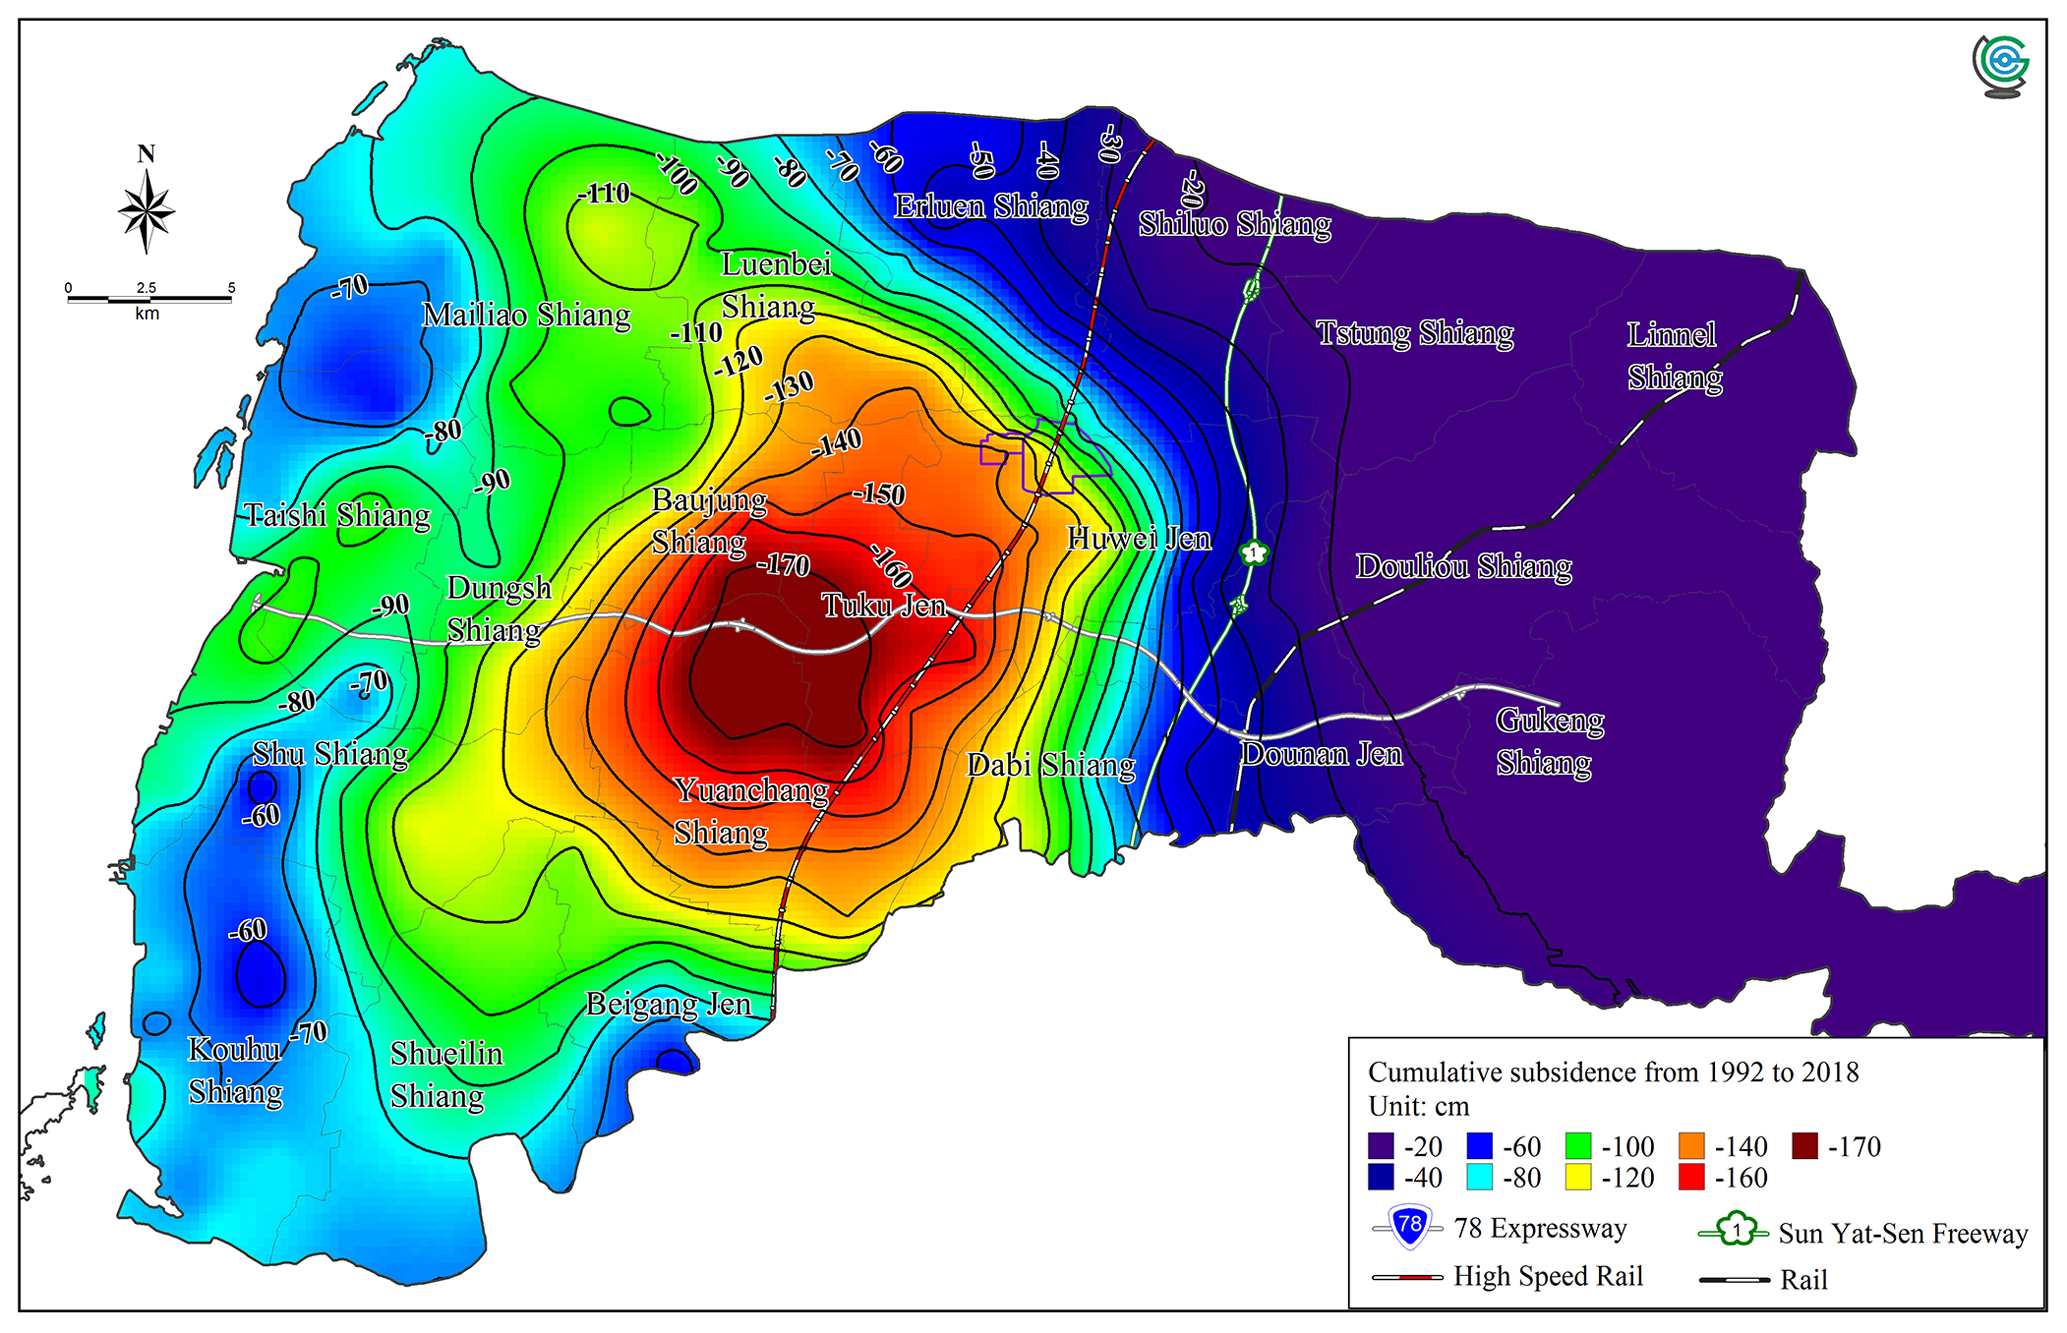
Figure 5Cumulative subsidence derived from leveling over 1992–2018.
3.1 Leveling
The length of the leveling network in the CRAF monitoring system is 1000 km (Fig. 4). The accuracy requirement for the leveling is a mm misclosure in any double run, where K is the distance between two neighboring benchmarks in km. At each leveling setup, the distances to the foresight and back sight were measured by an electronic distance measurement (EDM) device to ensure the two are nearly identical. Corrections for collimation error, atmospheric refraction and the earth's curvature were applied to the differential heights. Because the cumulative differences between foresight and backsight distances do not exceed 10 m, residual collimation errors, the earth's curvature and atmospheric effects were negligible. Figure 5 shows the contours of cumulative subsidence based on the interpolations using Kriging. In the past two decades, the maximum cumulative subsidence is over 170 cm and the contours of subsidence show a basin-like pattern centering at Huwei, Tuku, and Yuanchang Townships. THSR nearly passes through the center of this basin (Fig. 5), and it would have a major safety concern resulting from the subsidence.
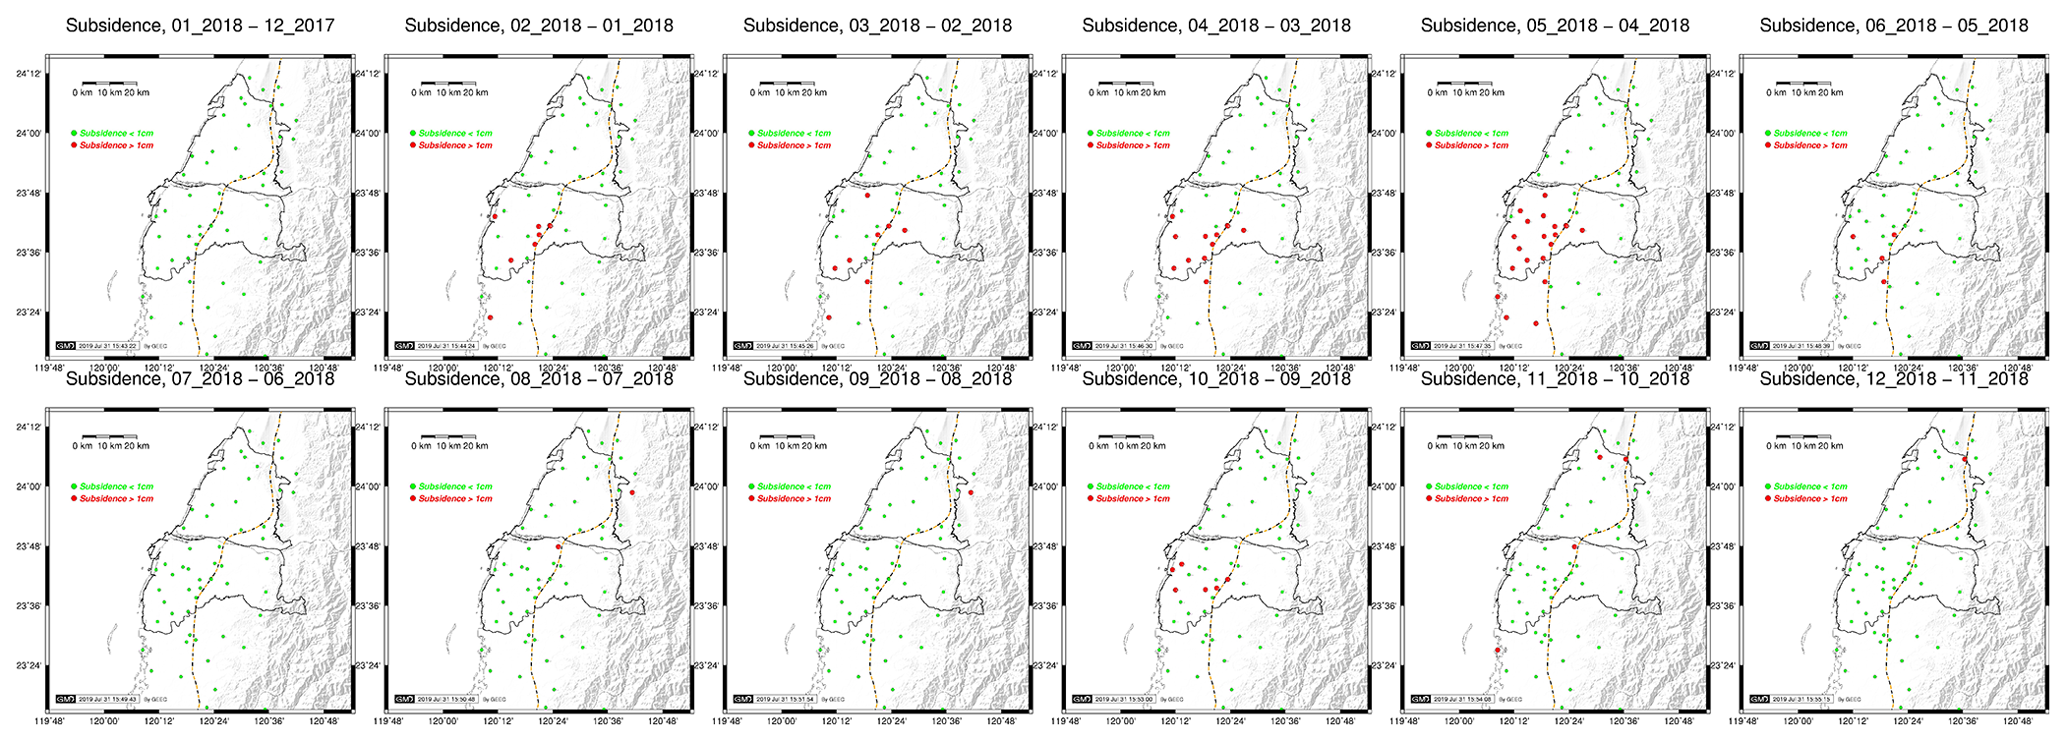
Figure 6Distributions of continuous GPS stations in CRAF and vertical displacement rates from GPS over January 2018–December 2018.

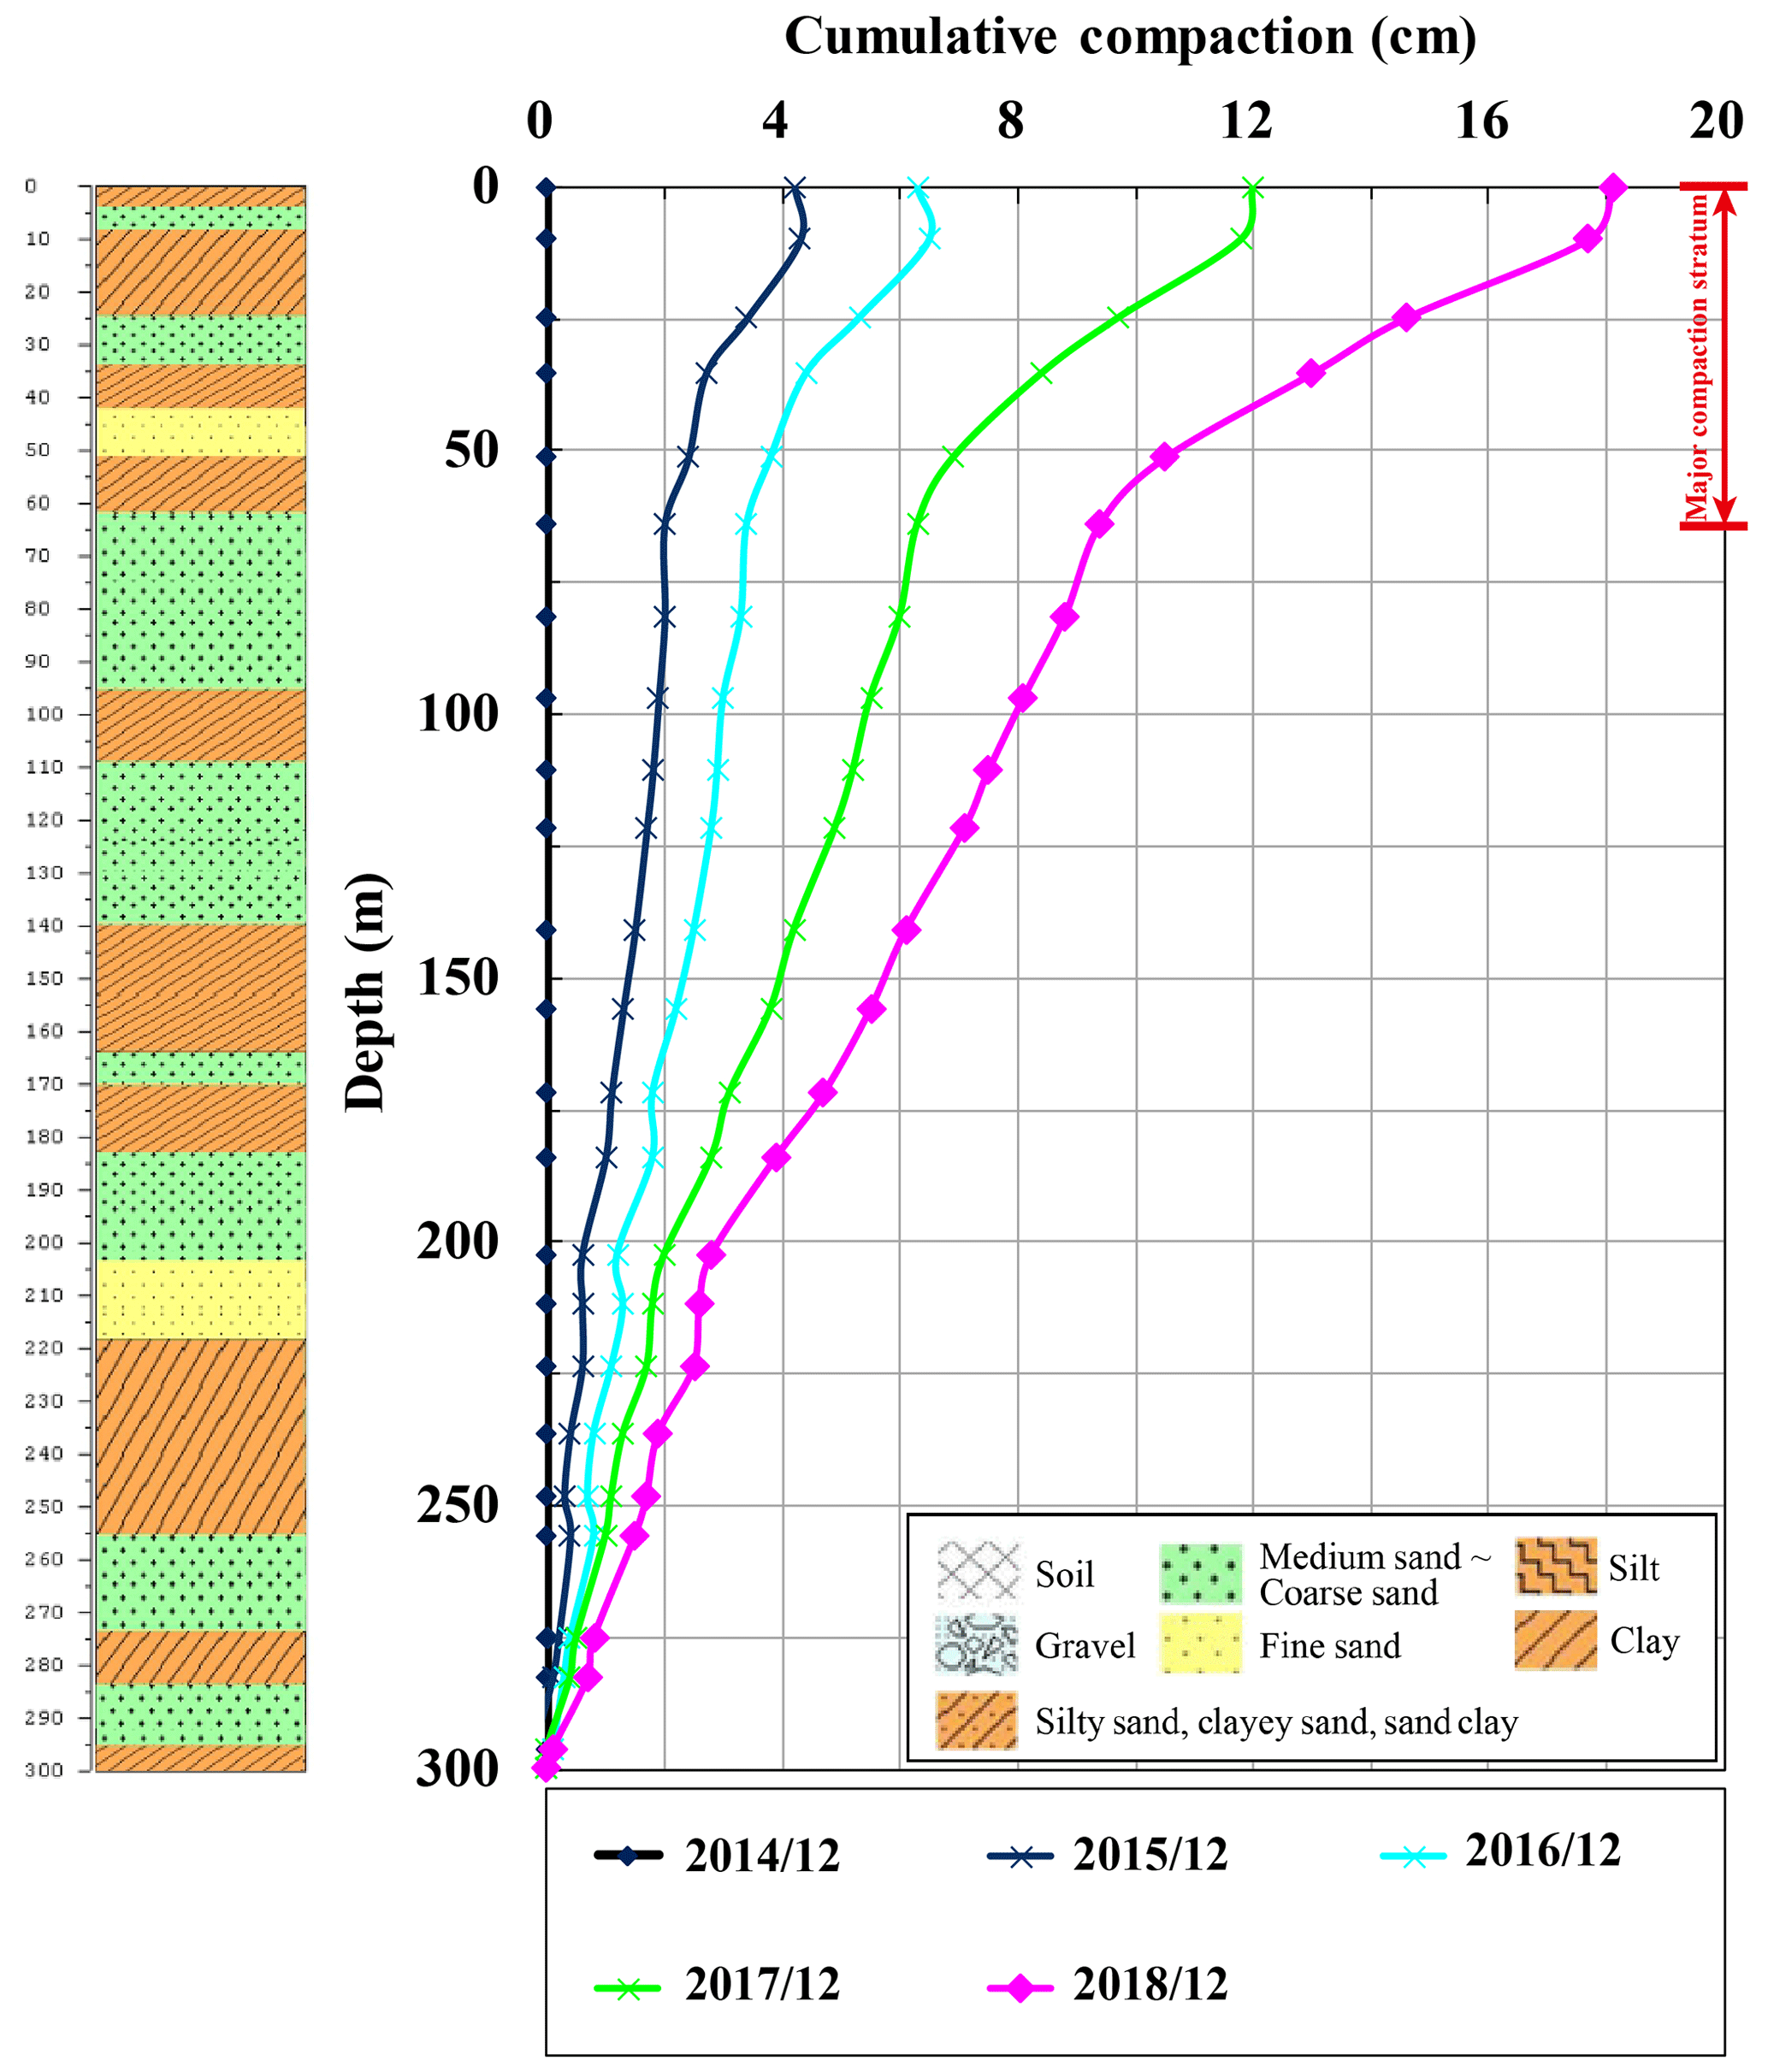
Figure 8Layers of sediments (column on the left) and cumulative compactions from 2014 to 2018 at STES.
3.2 Continuously Operating Reference Stations based on GPS
The GPS network used in the study (Fig. 6) consists of 50 GPS stations. The Bernese software (Version 5.2), developed by Bern University, was used to compute the horizontal and vertical coordinates of the stations using an automatic data processing procedure. This procedure was used to establish a cloud GPS early warning system for surface deformation, which can show ongoing land subsidence values in central Taiwan at a short latency. The system was established on the Amazon Web Services (AWS), which receives the GPS measurements from the GPS stations to perform coordinate computations, analyse coordinate changes and store the results using a highly automatic procedure. The final graphic results of land subsidence are broadcasted automatically through the internet for early warning. This warning system takes advantage of the internet-based cloud service for a large-scaled monitoring of ongoing land subsidence in central Taiwan.
The GPS-derived vertical displacement rates in Fig. 6 (from January 2018 to December 2018) indicate that a section of THSR passes through the main subsidence area in Yunlin County, and this is consistent with the result in Fig. 5. The major subsidence in Yunlin occurs from February to May during the dry season of Taiwan, followed by October. The major land subsidence (February–May) concurred with the 1st rice plantation in central Taiwan, when the rainfall was the least and the plantation area was the largest. During the wet season (June to September), land subsidence here is less significant thanks to relatively large rainfall and small amount of groundwater extraction.
3.3 Multi-layer compaction monitoring well
As mentioned in Sect. 1, the subsurface deposits in the aquifer system of CRAF are heterogeneous, with different hydraulic and mechanical properties across the different layers of deposits. In order to well understand the mechanism of subsidence seen in Figs. 5 and 6, multi-layer compaction monitoring wells (Hung et al., 2012) were installed to measure compactions at different stratigraphic intervals within the aquifer system (Fig. 7).
A multi-layer compaction monitoring well is able to measure the depths of magnetic rings with respect to the bottom of the well (300 m depth) at a mm accuracy, which are then used to determine the depth variations at all the ring locations. That is, the difference between the depths measured at two successive epochs at the same ring is the compaction between the two epochs occurring in the stratigraphic section of the ring . The total compaction is the sum of the compactions at all rings. In general, 20 to 26 magnetic rings are anchored in in a well, depending on the stratigraphic types determined from drilling data near the well. The depths of the rings are measured at a one-month interval. The variations in the ring depths at a well are accurate to 1 mm and the depth measurements are stable (Hung et al., 2012). Currently, we have installed 34 multi-layer compaction monitoring wells in CRAF (Fig. 4).
Figure 8 shows the cumulative compactions from 2014 to 2018 at the STES monitoring well, located in the most severe subsidence area along the rail of THSR. The aquifers near STES contains highly compressible sand and clay in alternations, resulting in the major and the secondary compactions at depths 0–60 m and 60–200 m, respectively. The compactions at different strata of a monitoring well like STES can be used to infer the source of the main groundwater use. For example, if a major compaction over a shallow stratum indicates that the source of the groundwater use is agriculture, for which shallow groundwater is preferred for concerns of energy consumption. In contrast, a major deep-aquifer compaction indicates potential sources from municipal and industrial groundwater uses. As such, measurements from a compaction monitoring well can be used to detect the sources of major compactions, thereby mitigating the problems causing the compactions (land subsidence).
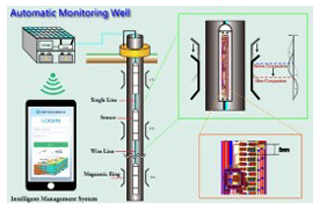
In 2019, we developed a new automatic system to collect data at a multi-layer compaction well (Fig. 9). The new system consists of 36 sensors that can automatically detect the magnetic forces every 10 min from the anchored magnetic rings in the well. The system then transforms the forces to the depths of the rings to calculate the compactions at the rings. Using the IoT technology, we transmit the compaction time series to a control center for an intelligent monitoring of land subsidence. In addition, we installed this IoT device at each of the groundwater monitoring stations in central Taiwan to transmit groundwater levels every 10 min to the control center for real-time monitoring of groundwater use. We used the methods of FFT and wavelet analyses to detect the frequency and amplitude of groundwater withdrawals, which help to identify the timing and purpose of ground-water pumping (Fig. 10). Our analyses show that daytime pumping is mostly for agriculture use, while nighttime pumping is for industrial use. Using this intelligent IoT monitoring equipment and a big-data processing method, we can monitor land subsidence in real time and act to mitigate it.
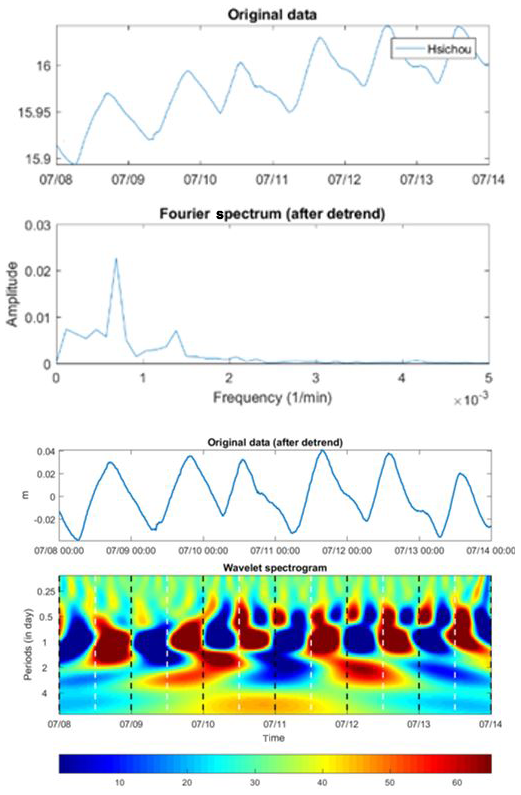
Figure 10Groundwater levels transmitted by the IOT (top two rows) and their Fourier spectrum (left bottom) and time-frequency spectrum (right bottom).
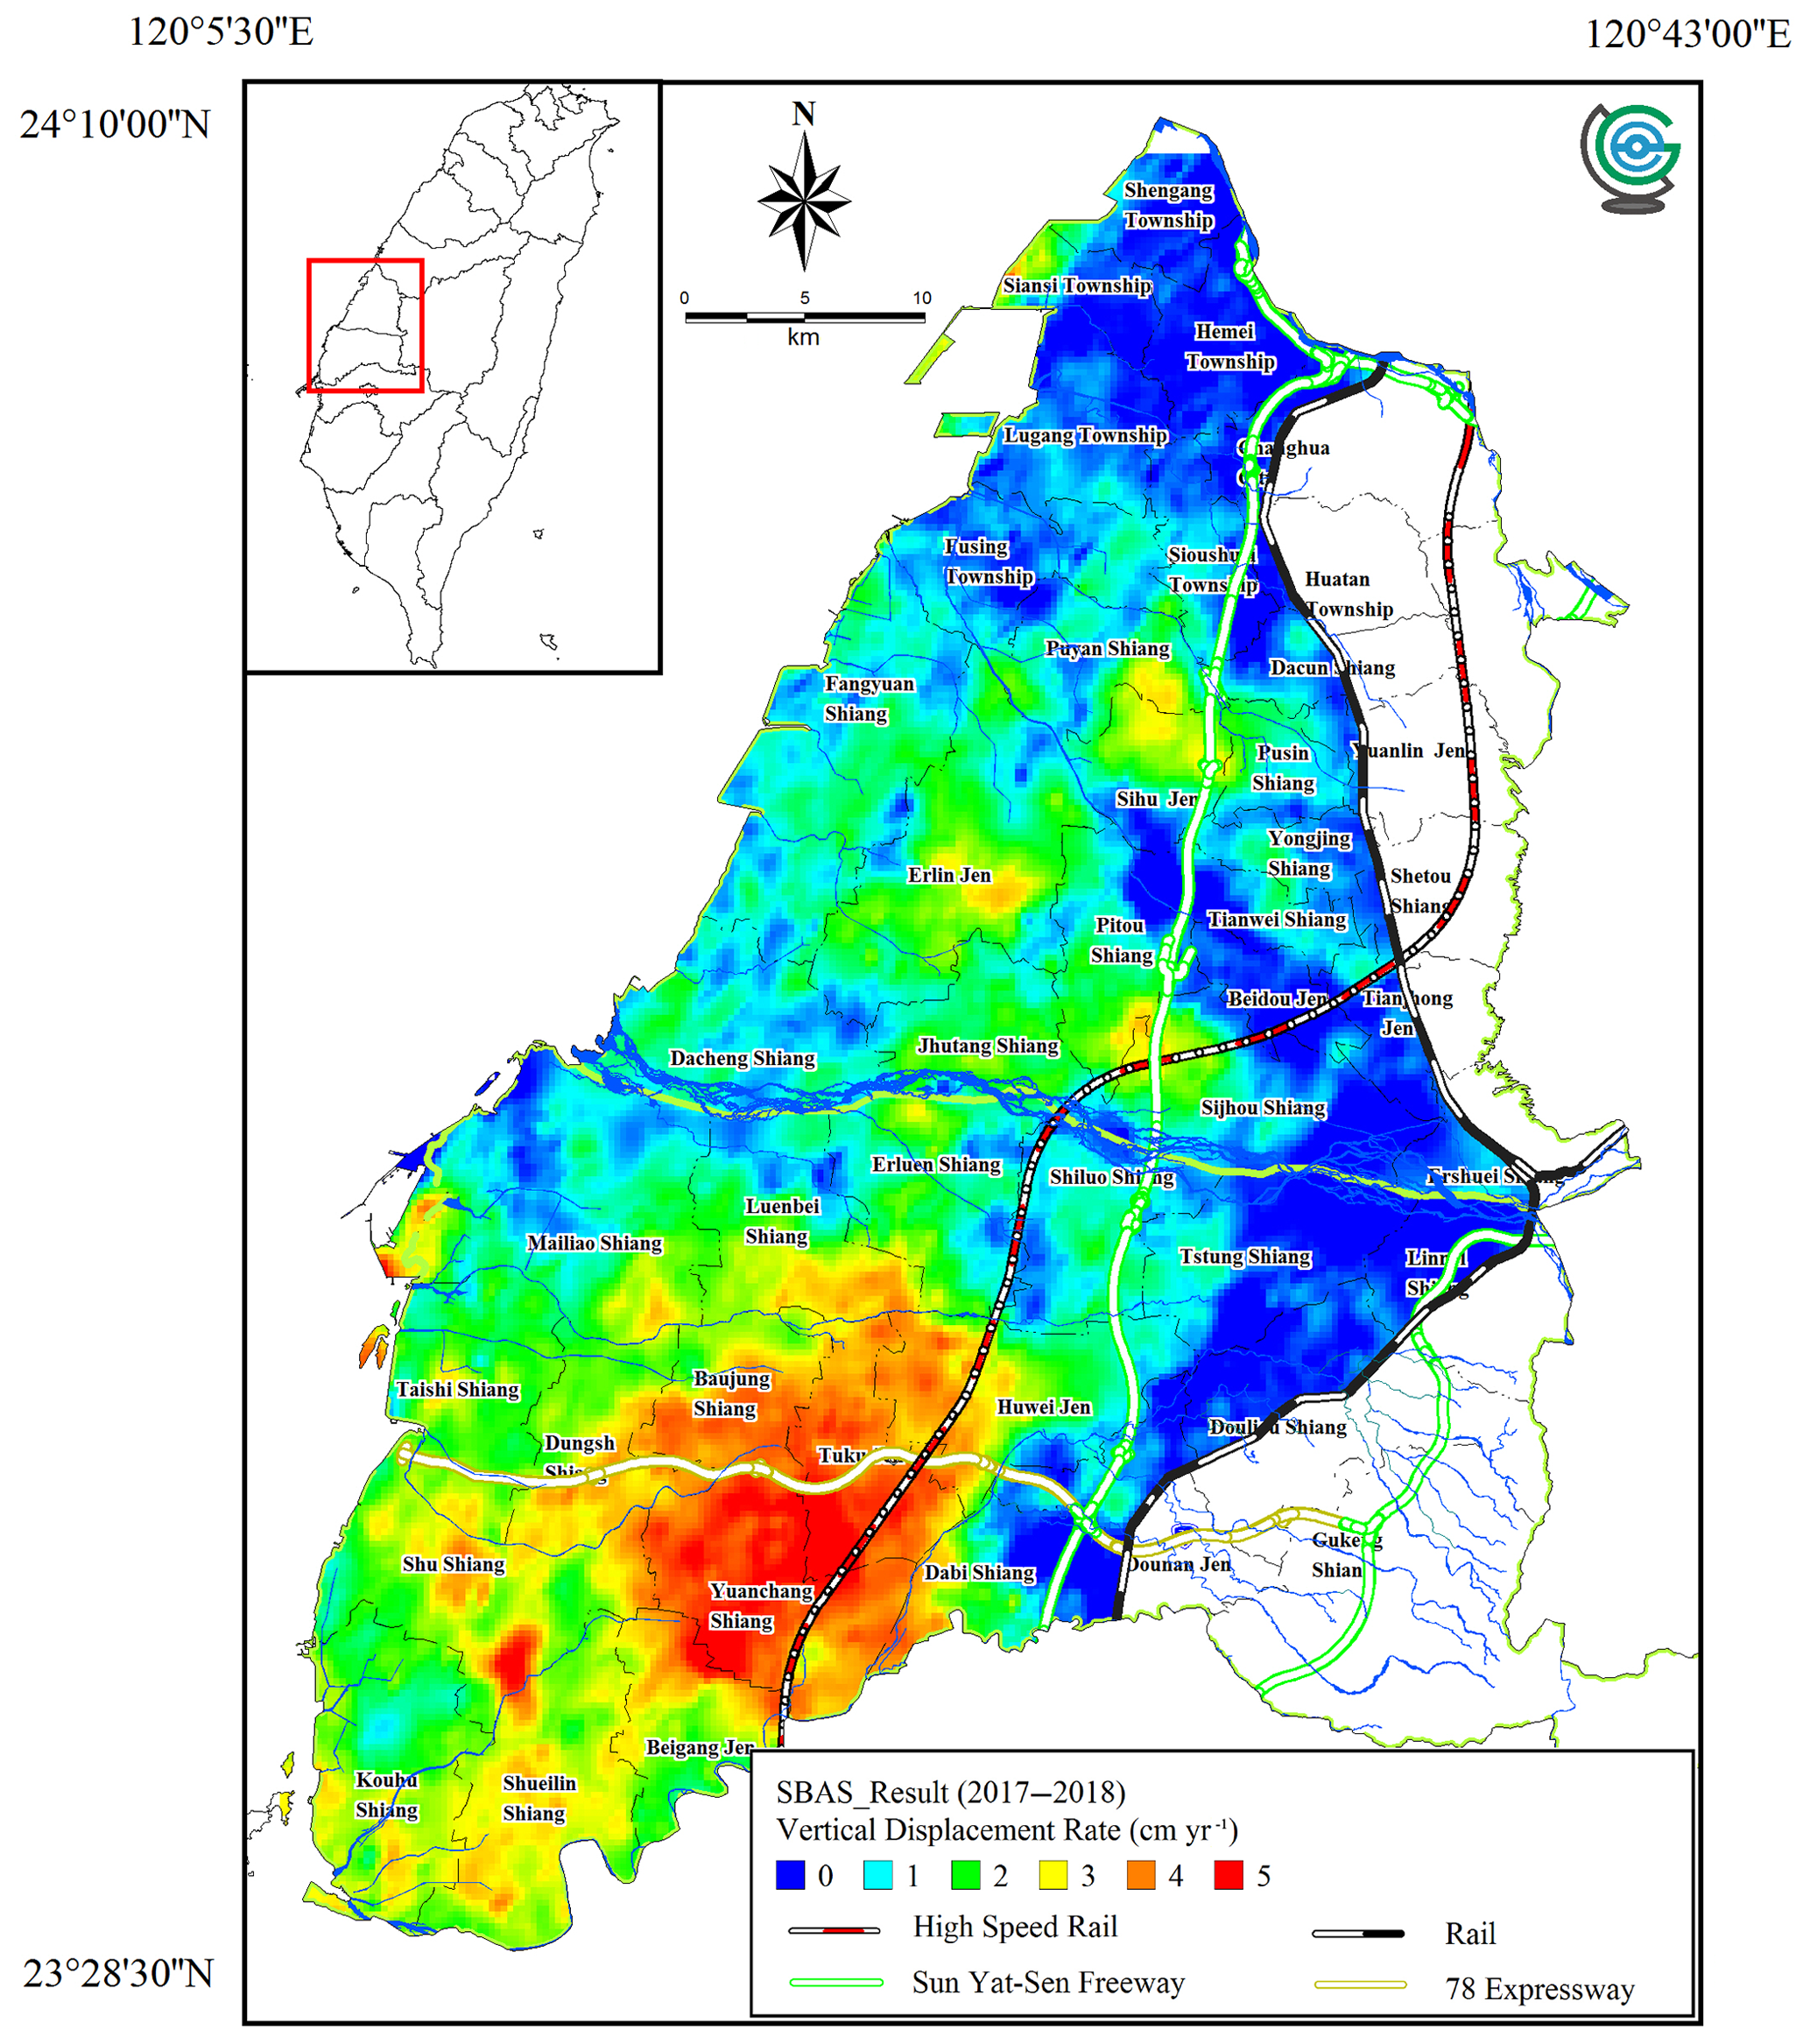
Figure 11Vertical displacement rate from SBAS over 2017–2018.
3.4 Areal subsidence by Multi Temporal InSAR (MT-InSAR)
In the past decades, synthetic aperture radar interferometry (InSAR) has been proved to be a powerful and effective geodetic technique for measuring surface deformation. InSAR can produce subsidence rates with high spatial resolutions and sub-centimeter accuracy. However, changes in surface attributes and variations in water vapor stratification between image acquisition times can cause spatial decorrelations in conventional SAR interferometry can cause errors in deformation measurements. Such errors in DInSAR may be mitigated by using the multi-temporal InSAR (MT-InSAR) technique. The InSAR literature shows that three MT-InSAR methods have been used to monitor land subsidence in Taiwan, namely the methods of persistent scatterers InSAR (PSI) (Hooper et al., 2004), Small Baseline Subset Differential (SBAS) (Berardino et al., 2002) and temporarily coherence point InSAR (TCPInSAR) (Zhang et al., 2011).
In this paper, we used the SBAS method to determine surface deformations in CRAF from 2017 to 2018, which were then compared with the deformations from precise leveling. The pixel density over CRAF from SBAS is 89 pixels km−2, compared to 0.2 points km−2 in the leveling network. The vertical displacements inferred from SBAS are consistent with those from leveling to 8 mm yr−1 (RMS). Furthermore, for a data fusion we computed a smooth correction surface for the SBAS result using the differences between the leveling and InSAR displacements (Hung et al., 2011). Figure 11 shows the vertical displacement rates after the data fusion from 2017 to 2018.
The deformation pattern in Figure 11 is in good agreement with the pattern from leveling. The major subsidence areas are located western of Sun Yat-Sen Freeway, e.g., in the middle fan and distal fan of CRAF (Fig. 1). The combined displacement field is more representative of the overall deformation characteristics than the SBAS-only or the leveling-only field, providing more land subsidence information for to better assess the impact of land subsidence over CRAF.
The long-term land subsidence in central Taiwan can damage infrastructure such as THSR and threaten lives. The multi-sensor system developed in this paper, including GPS, MT-InSAR, Leveling, monitoring well, and groundwater well, can effectively monitor such land subsidence from space, ground, and underground. This system collects subsidence data for understanding the magnitude and major sources of groundwater uses in shallow and deep aquifers, which can be used for decision making in industrial developments. The result from the system can help to reduce the rate and area of land subsidence. This system will be enhanced by extending the monitoring area and using an improved automation. About 400 GPS CORSs around Taiwan will be included in the system enhancement to determine three dimensional surface deformations. Combining deformations from InSAR, GPS, and leveling allow to effectively determine the space-time evolutions of land subsidence. The Internet of Things (IoT) technology developed in this paper allows to control and manage the monitoring sensors for intelligent monitoring of land subsidence.
In this study, the continuous GPS data, leveling, multi-layer compaction monitoring well and groundwater data are provided by Water Resource Agency (WRA), Dept of Economics, Taiwan, R.O.C.
WCH produced the leveling, GPS, multi-layer compaction monitoring well and InSAR data, developed the automatic multi-layer compaction monitoring well system, drafted and revised the manuscript. YAC prepared the Sentinel-1A data, produced InSAR and the multi-layer compaction monitoring well data and revised the manuscript. CH provided the professional reference suggestion and revised the manuscript. All authors read and approved the final manuscript.
The authors declare that they have no conflict of interest.
This article is part of the special issue “TISOLS: the Tenth International Symposium On Land Subsidence – living with subsidence”. It is a result of the Tenth International Symposium on Land Subsidence, Delft, the Netherlands, 17–21 May 2021.
This study is supported by Water Resource Agency, Dept of Economics, Taiwan, R.O.C.
This research has been supported by the Water Resource Agency (project no. MOEAWRA1080322).
Berardino, P., Fornaro, G., Lanari, R., and Sansosti, E.: A new algorithm for surface deformation monitoring based on small baseline differential SAR interferograms, IEEE Trans. Geosci. Remote Sens., 40, 2375–2383, 2002.
Hooper, A., Zebker, H., Segall, P., and Kampes, B.: A new method for measuring deformation on volcanoes and other natural terrains using InSAR persistent scatterers, Geophys. Res. Lett., 31, L23611, https://doi.org/10.1029/2004GL021737, 2004.
Hung, W.-C., Hwang, C., Chen, Y.-A., Chang, C.-P., Yen, J.-Y., Hooper, A., and Yang, C.-Y.: Surface deformation from persistent scatterers SAR interferometry and fusion with leveling data: A case study over the Choushui River Alluvial Fan, Taiwan, Remote Sens. Environ., 115, 957–967, 2011.
Hung, W.-C., Hwang, C., Liou, J.-C., Lin, Y.-S., and Yang, H.-L.: Modeling aquifer-system compaction and predicting land subsidence in central Taiwan, Eng. Geol., 147, 78–90, 2012.
Tomás, R., Herrera, G., Delgado, J., Lopez-Sanchez, J. M., Mallorquí, J. J., and Mulas, J.: A ground subsidence study based on DInSAR data: Calibration of soil parameters and subsidence prediction in Murcia City (Spain), Environ. Geol., 111, 19–30, 2010.
Tosi, L., Teatini, P., Carbognin, L., and Frankenfield, J.: A new project to monitor land subsidence in the northern Venice coastland (Italy), Environ. Geol., 52, 889–898, 2007.
Zhang, L., Ding, X., and Lu, Z.: Ground settlement monitoring based on temporarily coherent points between two SAR acquisitions, ISPRS J. Photogramm. Remote Sens., 66, 146–152, 2011.