Articles | Volume 382
https://doi.org/10.5194/piahs-382-111-2020
Pre-conference publication
 | 
22 Apr 2020
Pre-conference publication |  | 22 Apr 2020

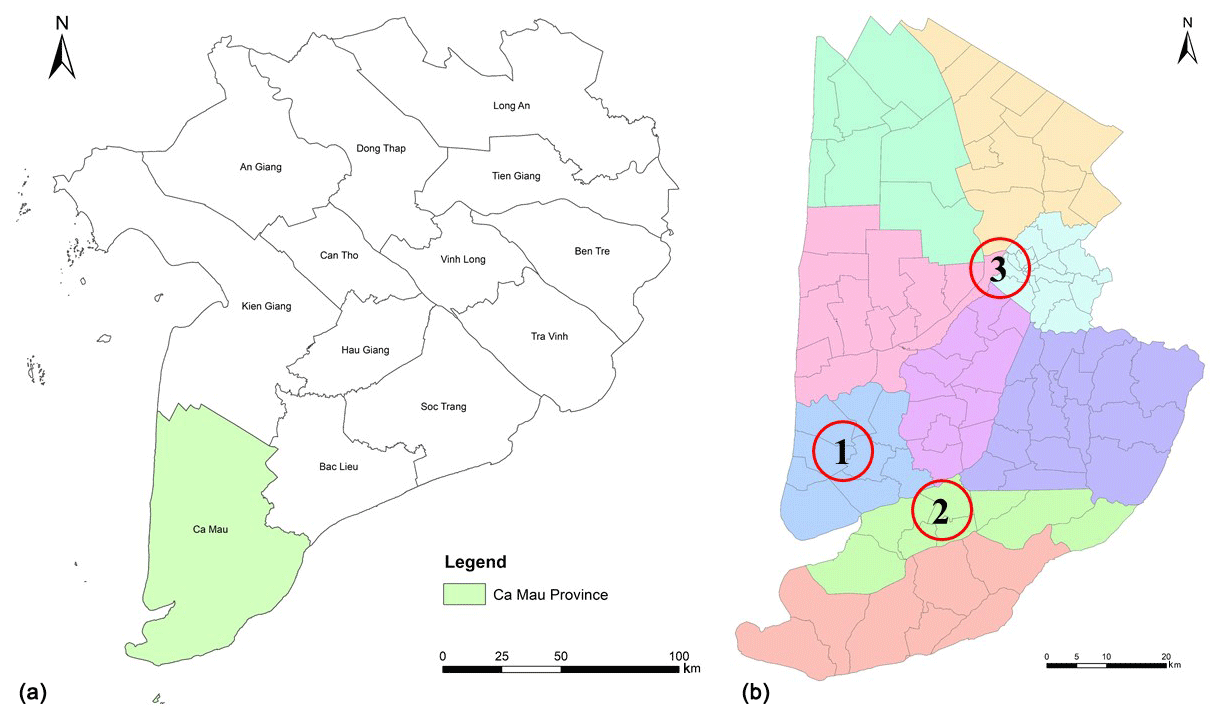
Preliminary results of land subsidence monitoring in the Ca Mau Province

Kjell Karlsrud, Lloyd Tunbridge, Nguyen Quoc Khanh, and Nguyen Quoc Dinh
Abstract

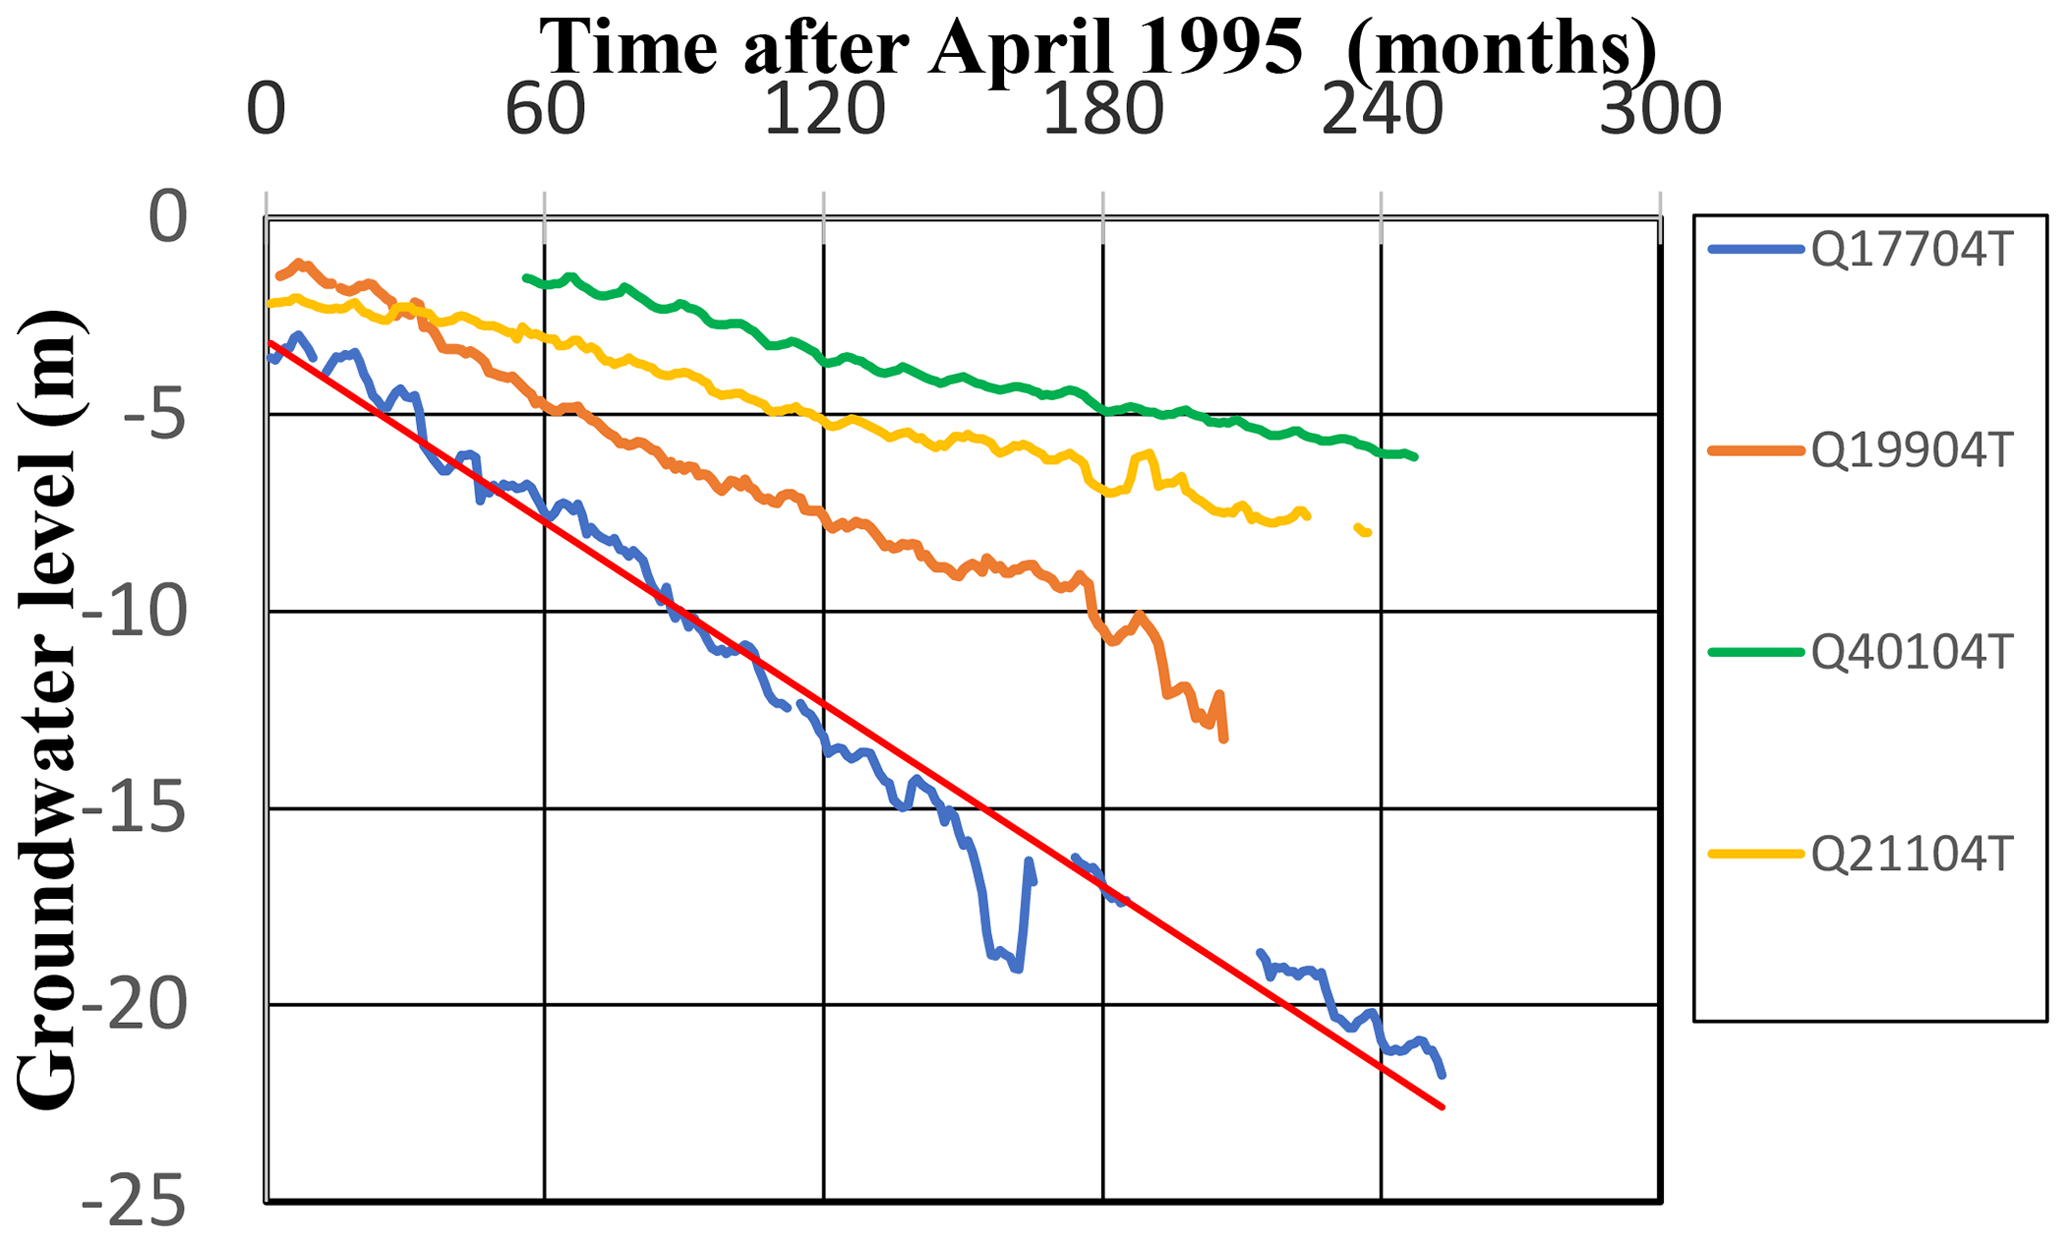
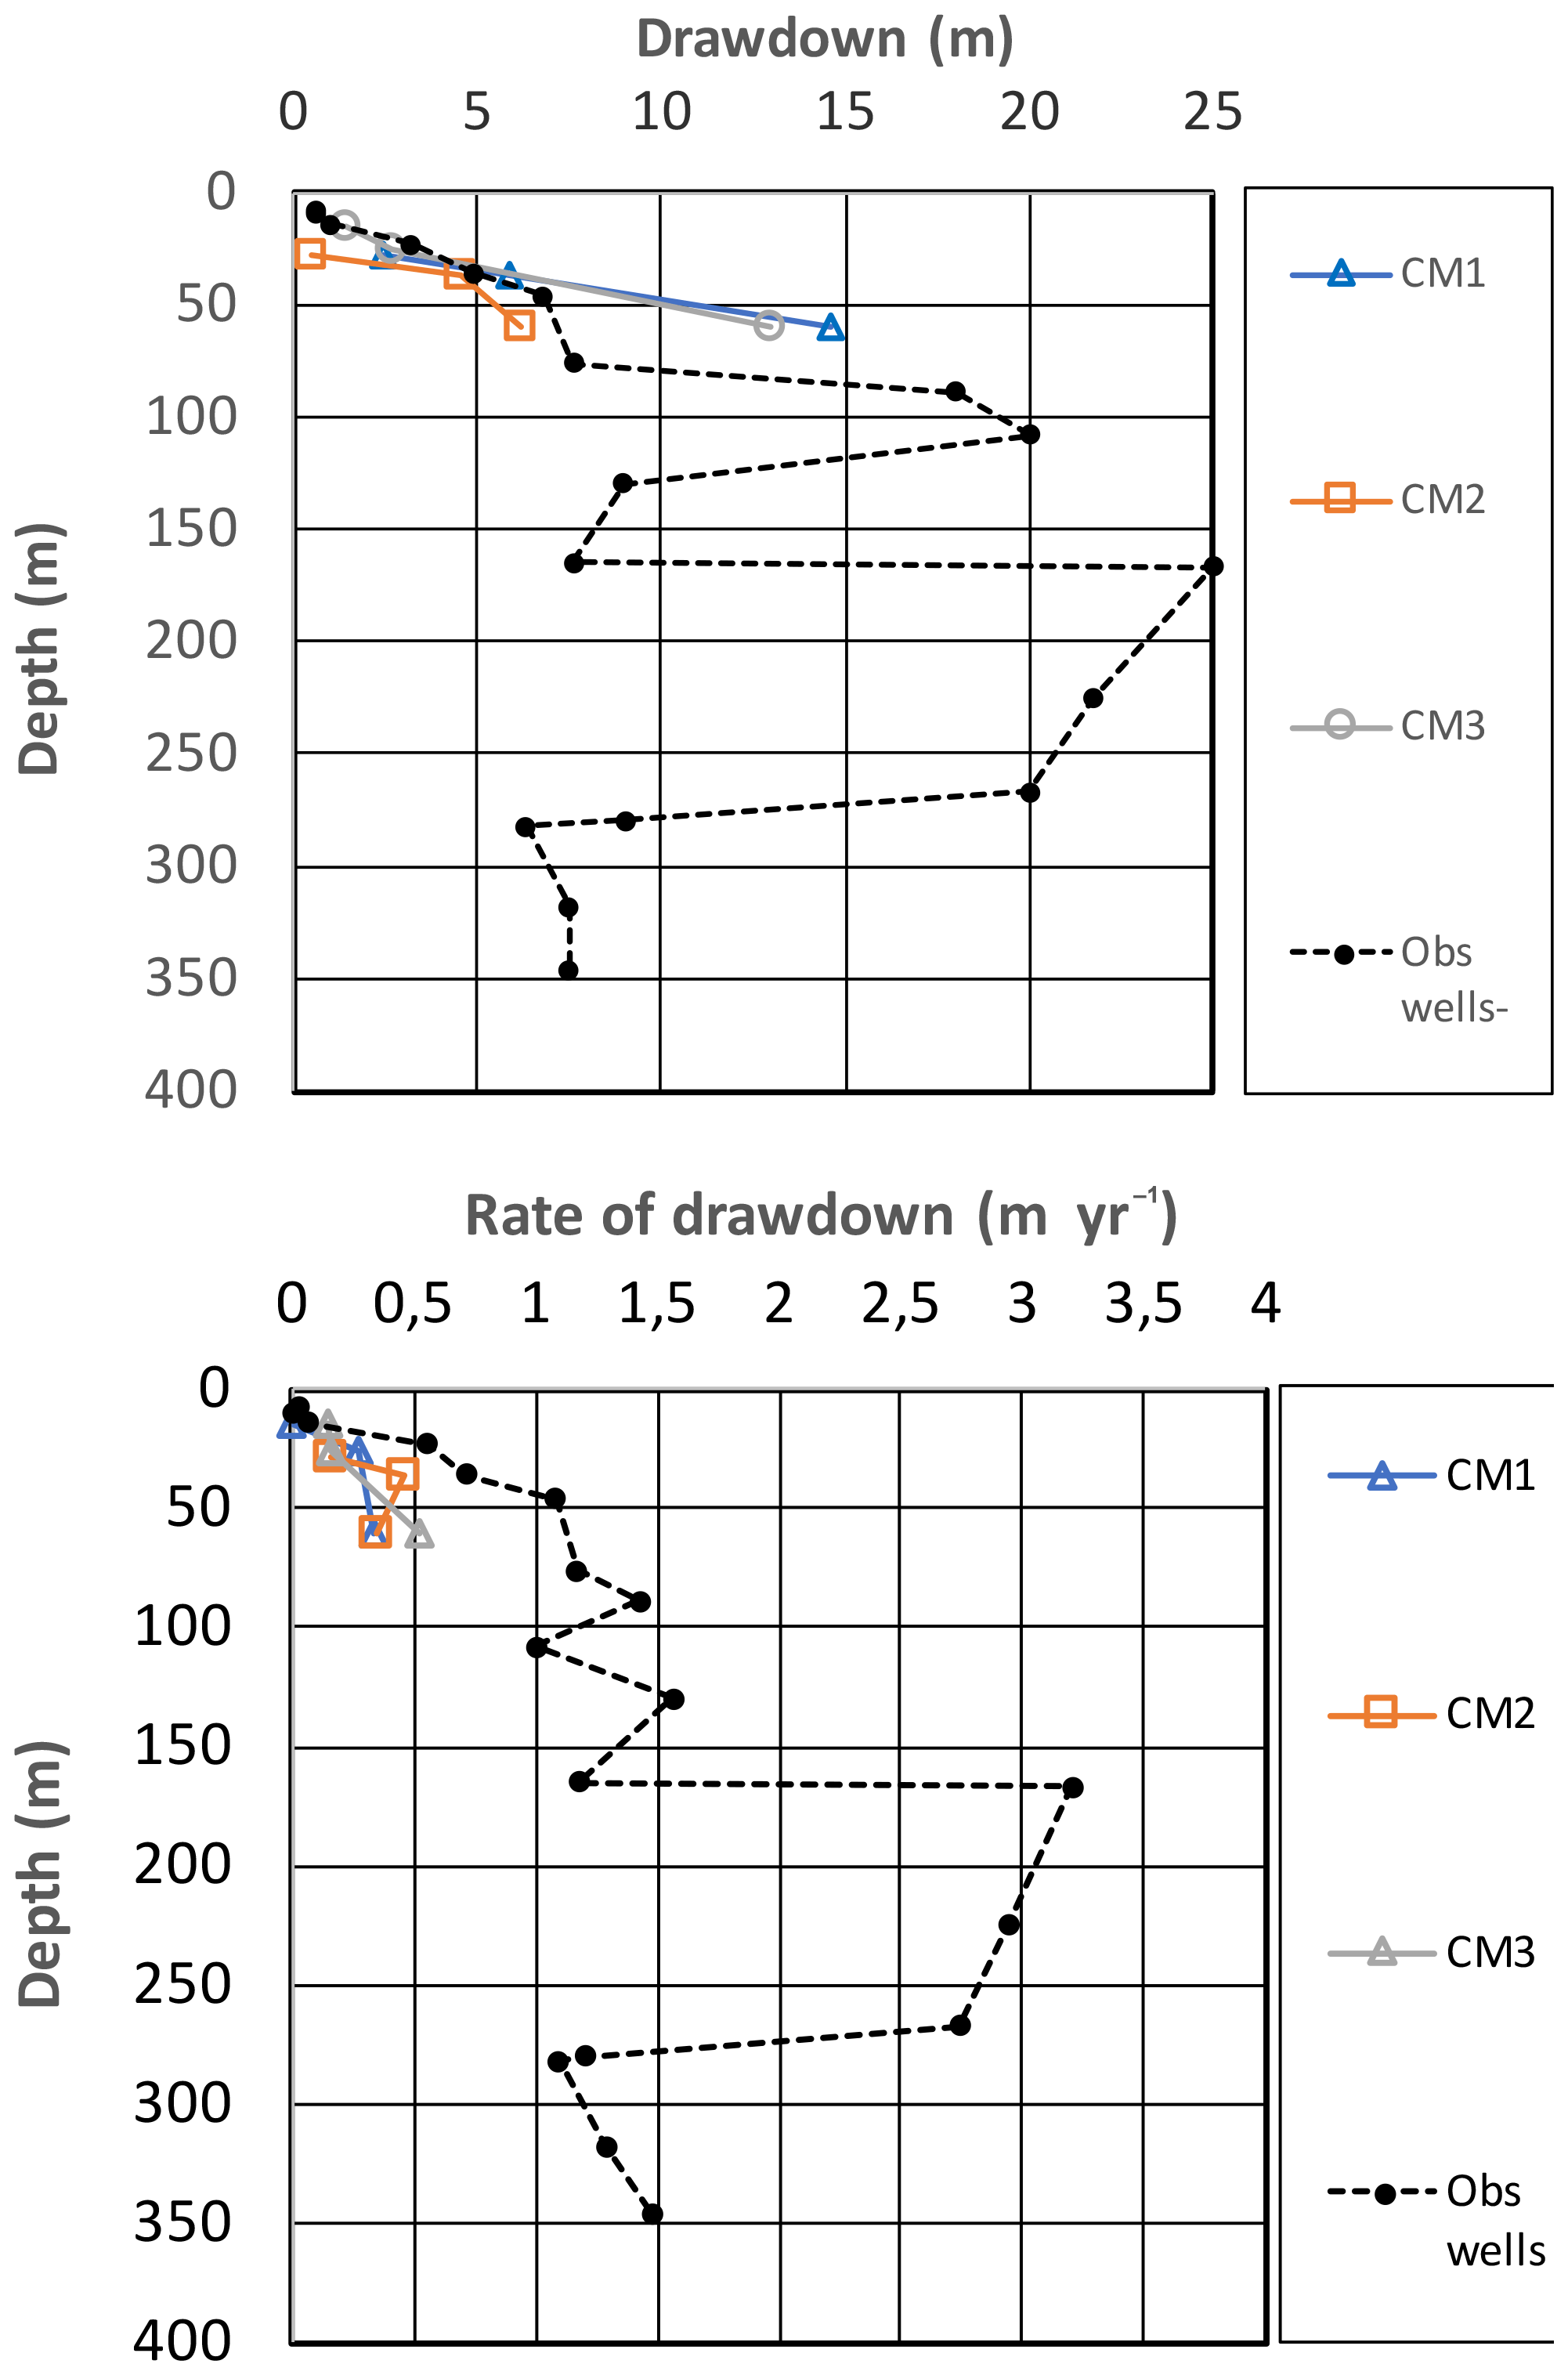
A previous study of the Ca Mau province in Vietnam (Karlsrud et al., 2017a) suggested that ongoing groundwater pumping, which by 2012 had caused a drawdown of the water level in aquifers of up to 20 m, caused subsidence of the order 2–4 cm yr−1, and could have reached over 40 cm already. Earlier InSAR studies also suggested ongoing subsidence rates of that order. If the groundwater pumping continues, the total subsidence could reach well over 1 m within the next few decades. The predicted climate driven sea level rise, to be of the order of 60 cm by 2100, will further add to the severe effect of the subsidence. As most of the Ca Mau province lies only 0.5 to 1.5 m a.s.l. (above sea level), the consequences would rapidly become very serious for the livelihood of people in the region. Increased saltwater intrusion into canals and tributaries in the province, and beginning salination of some of the aquifers from which groundwater is pumped, is already observed.

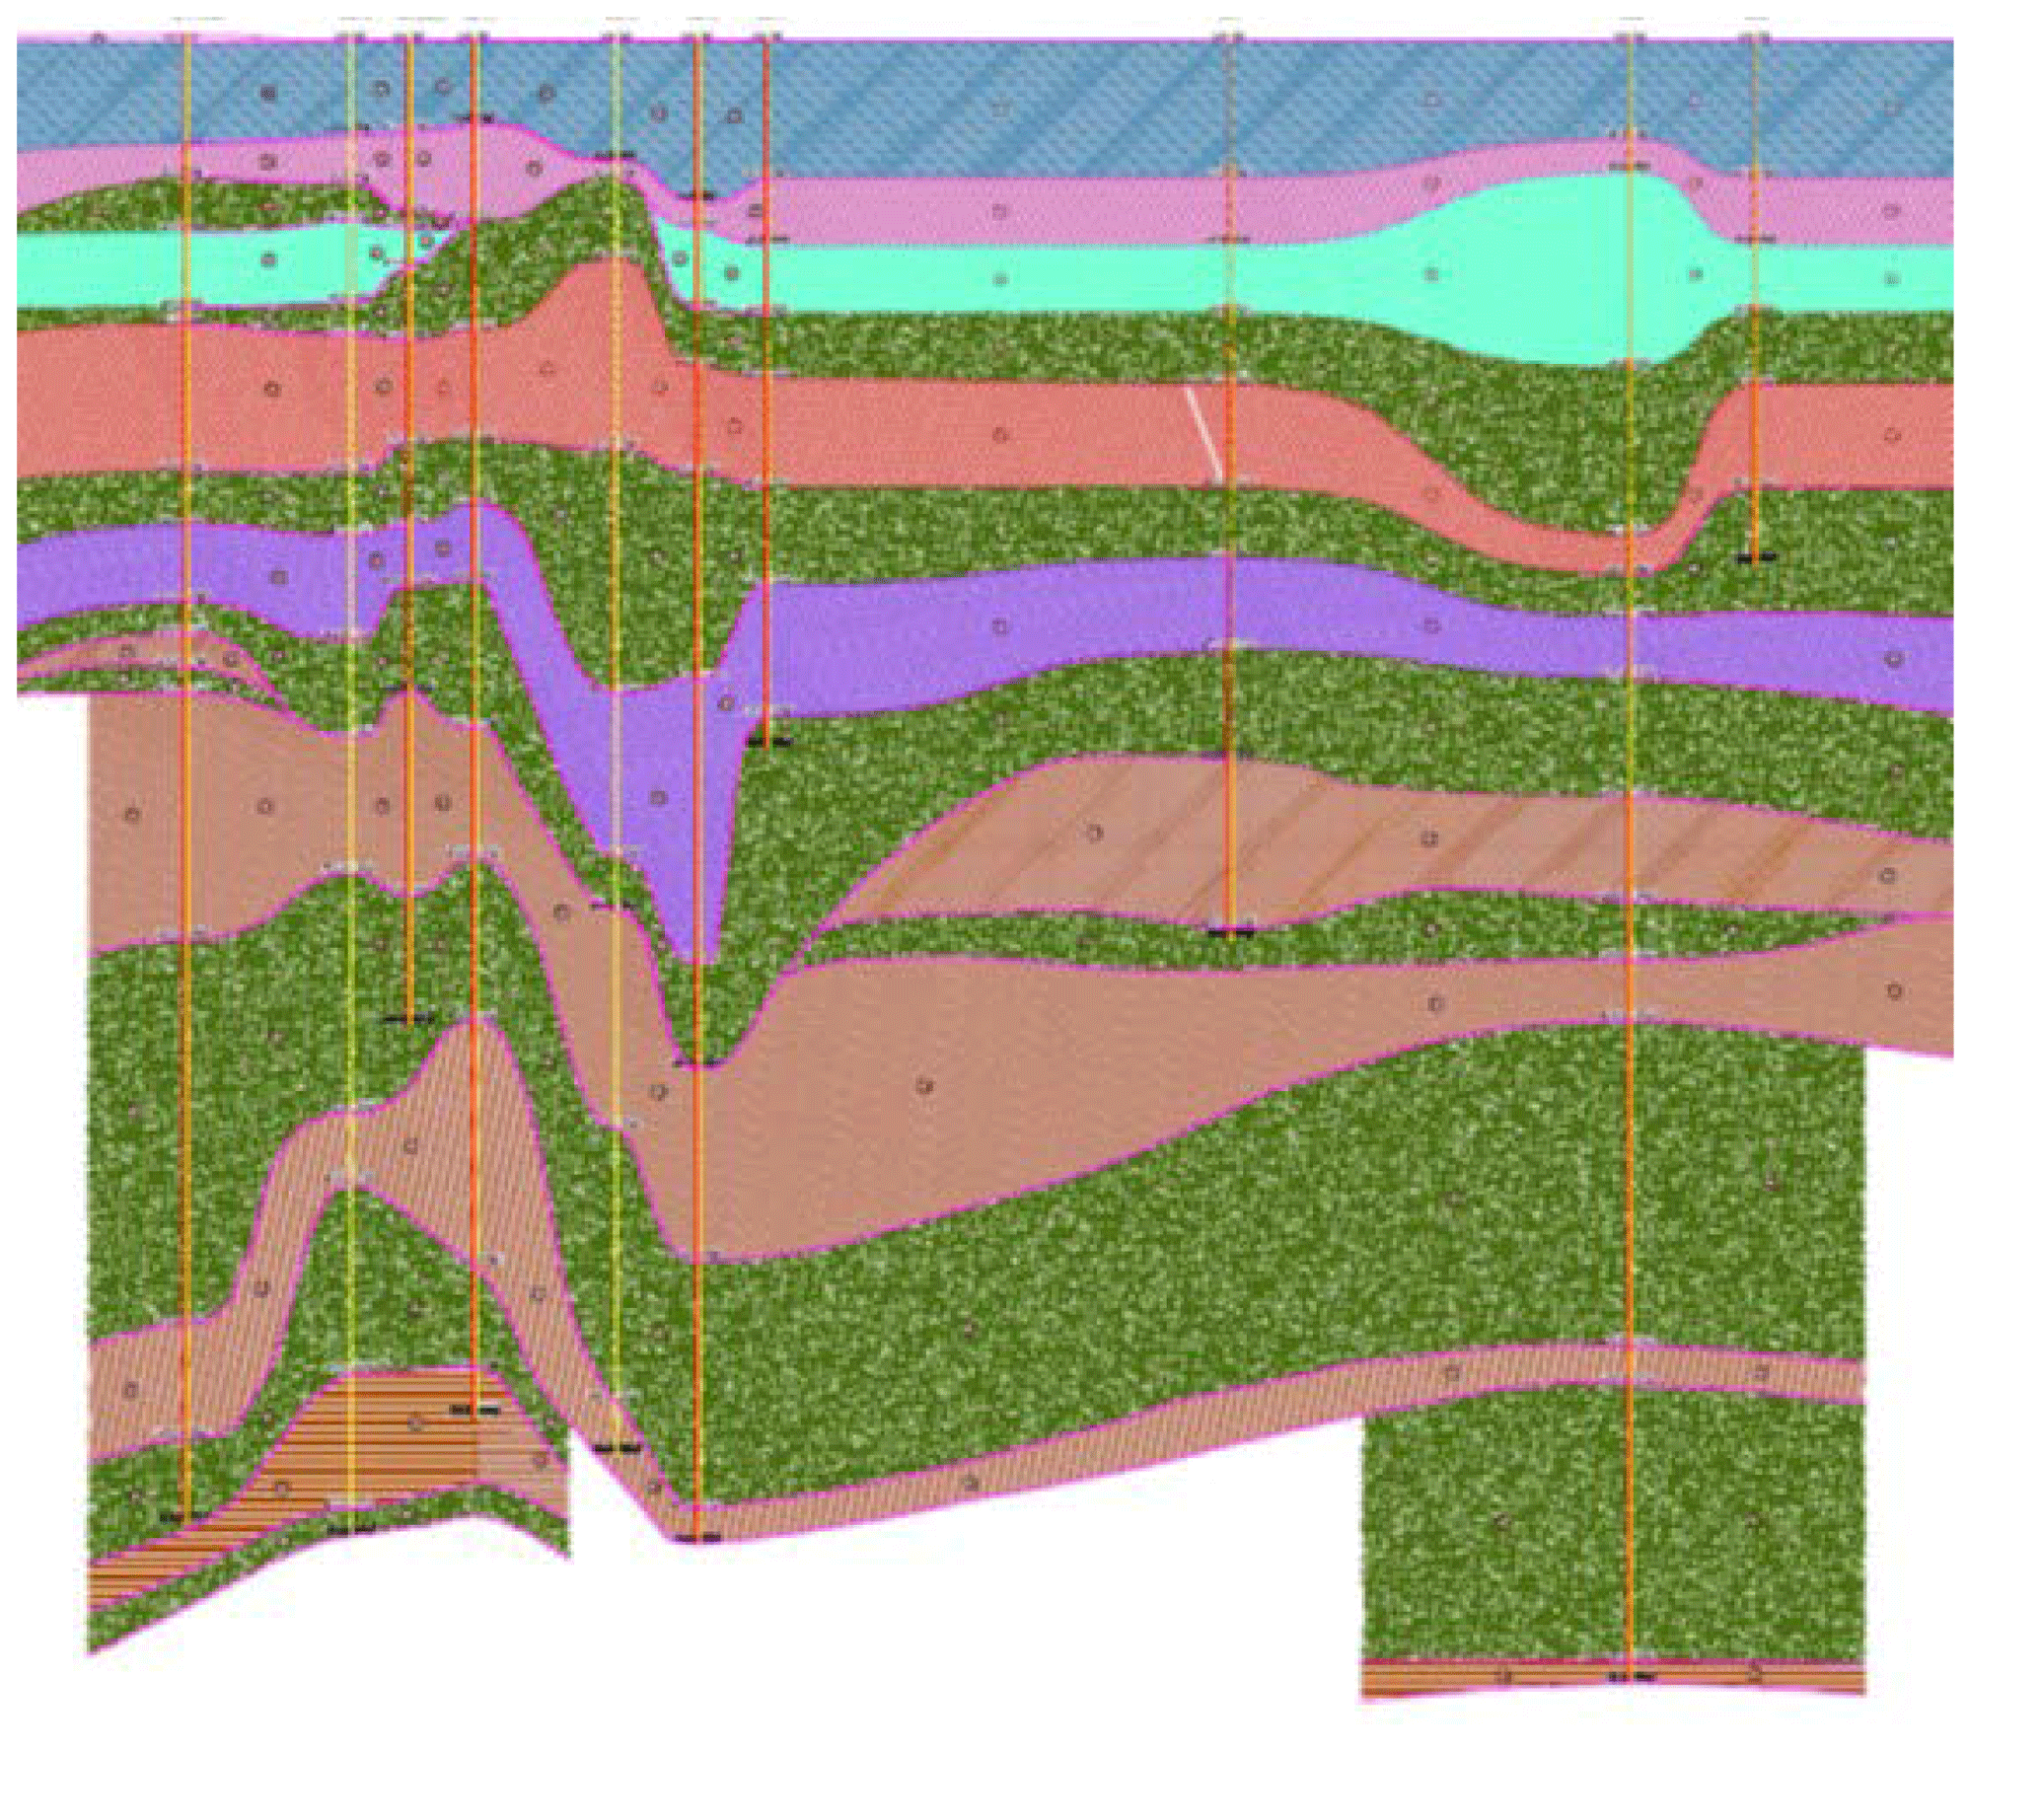
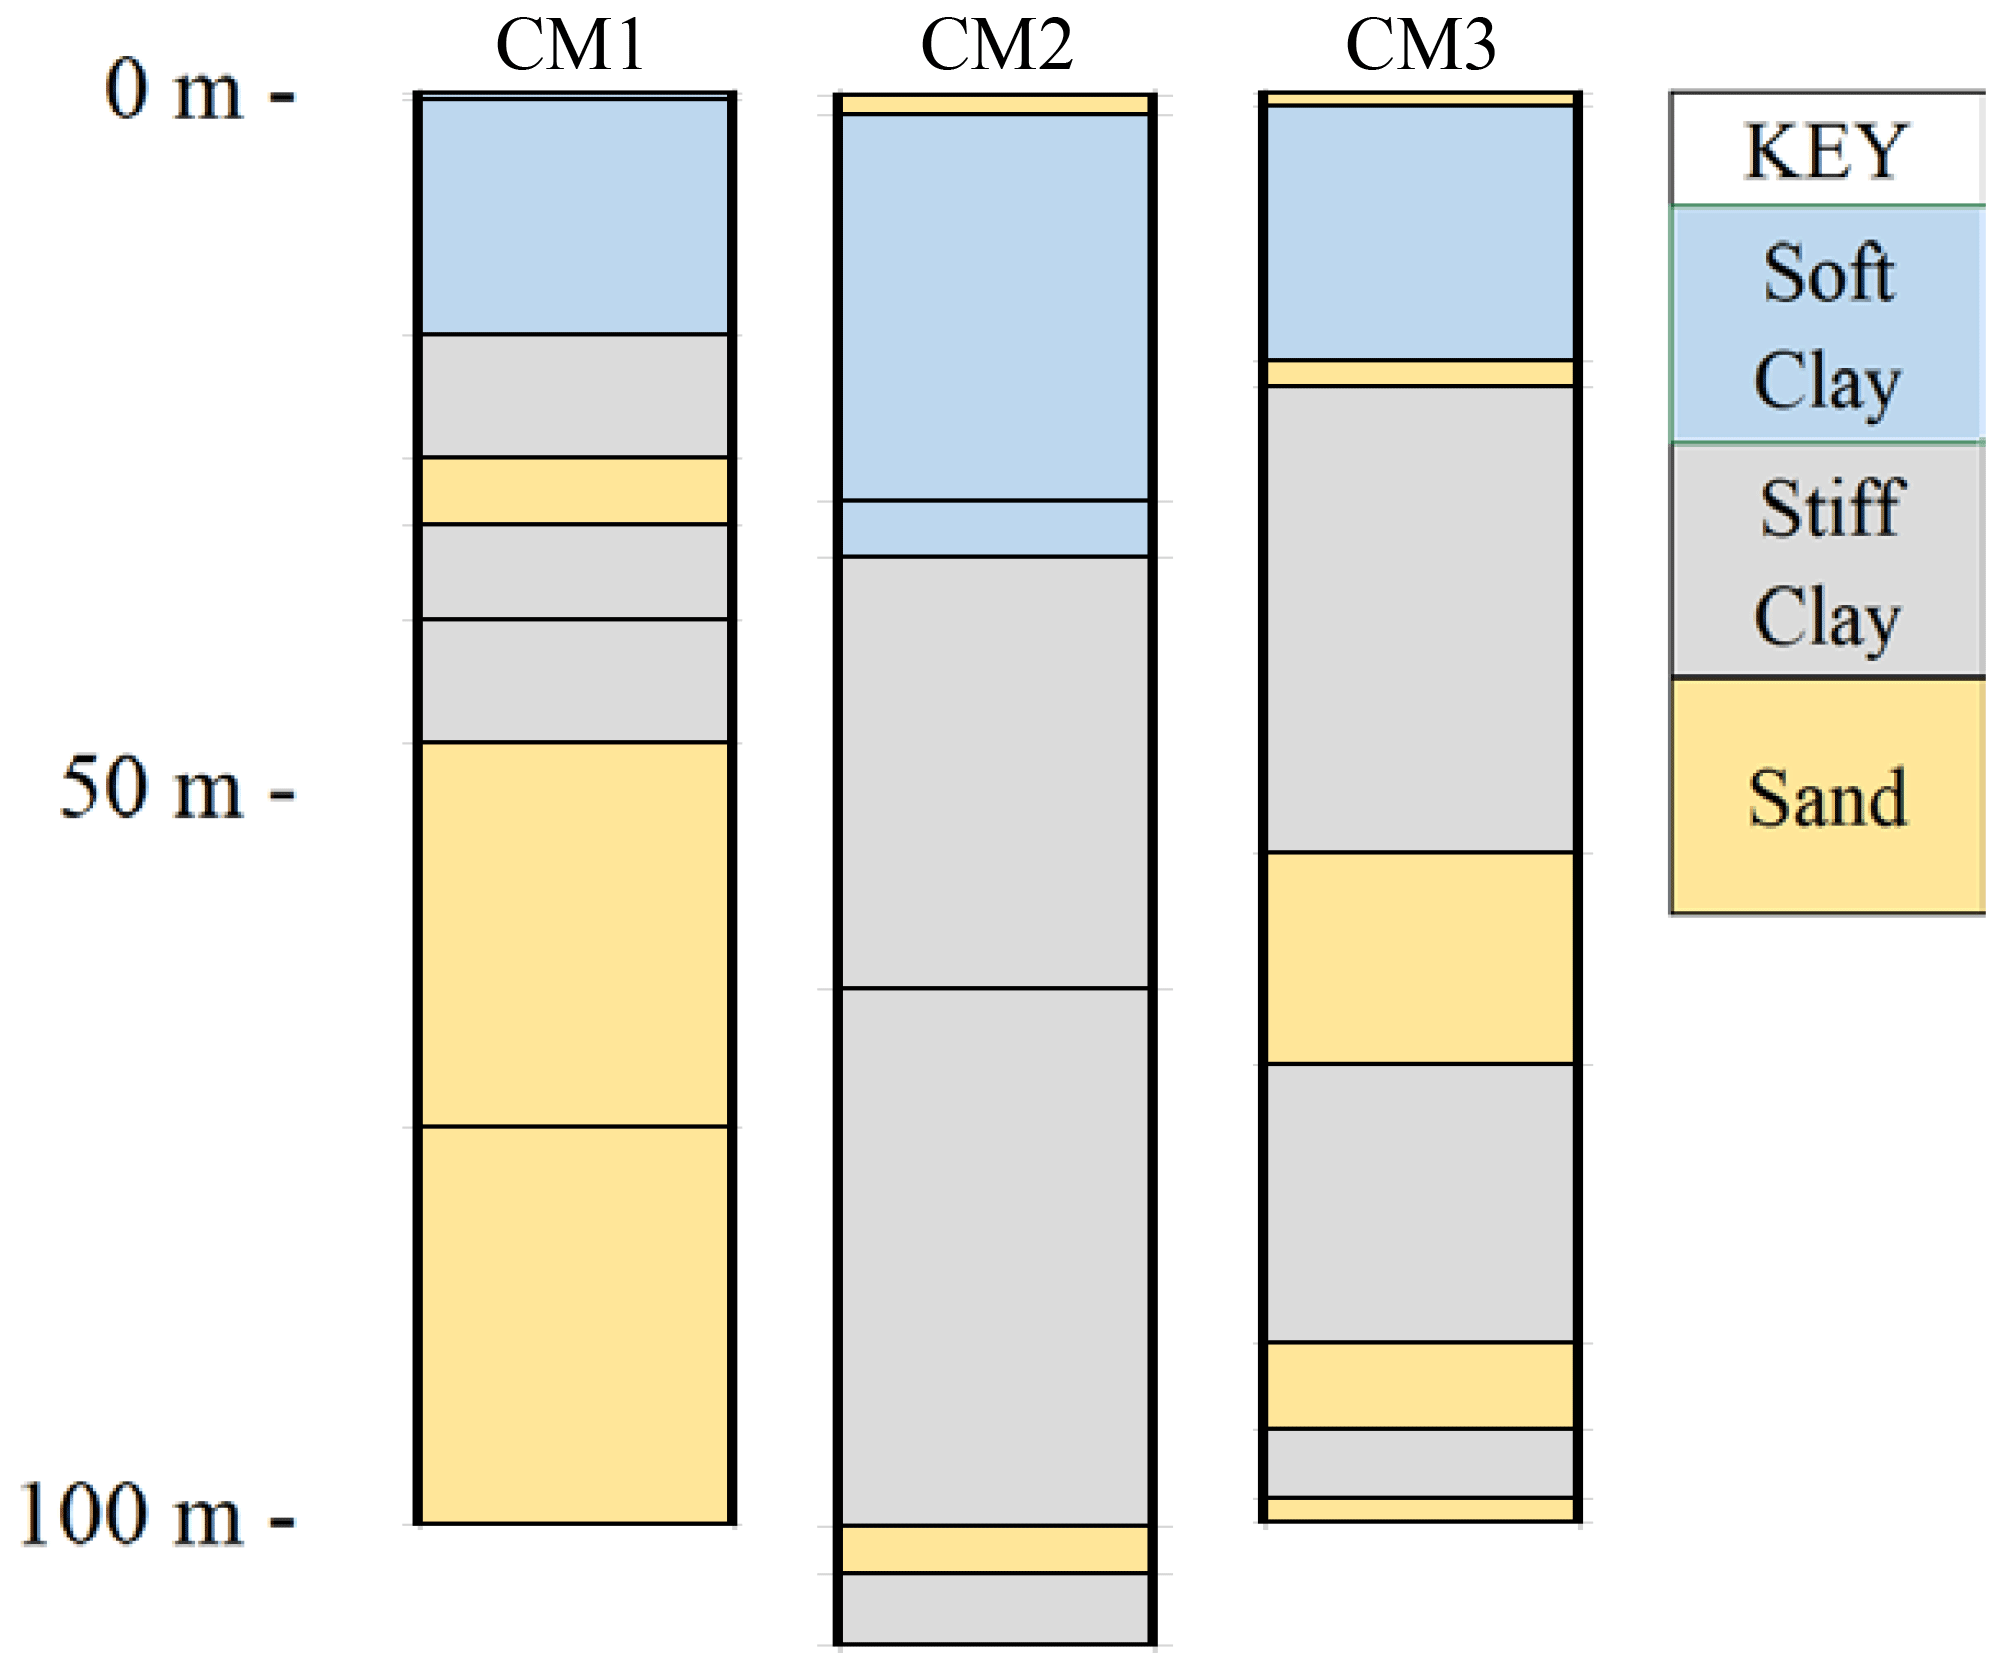
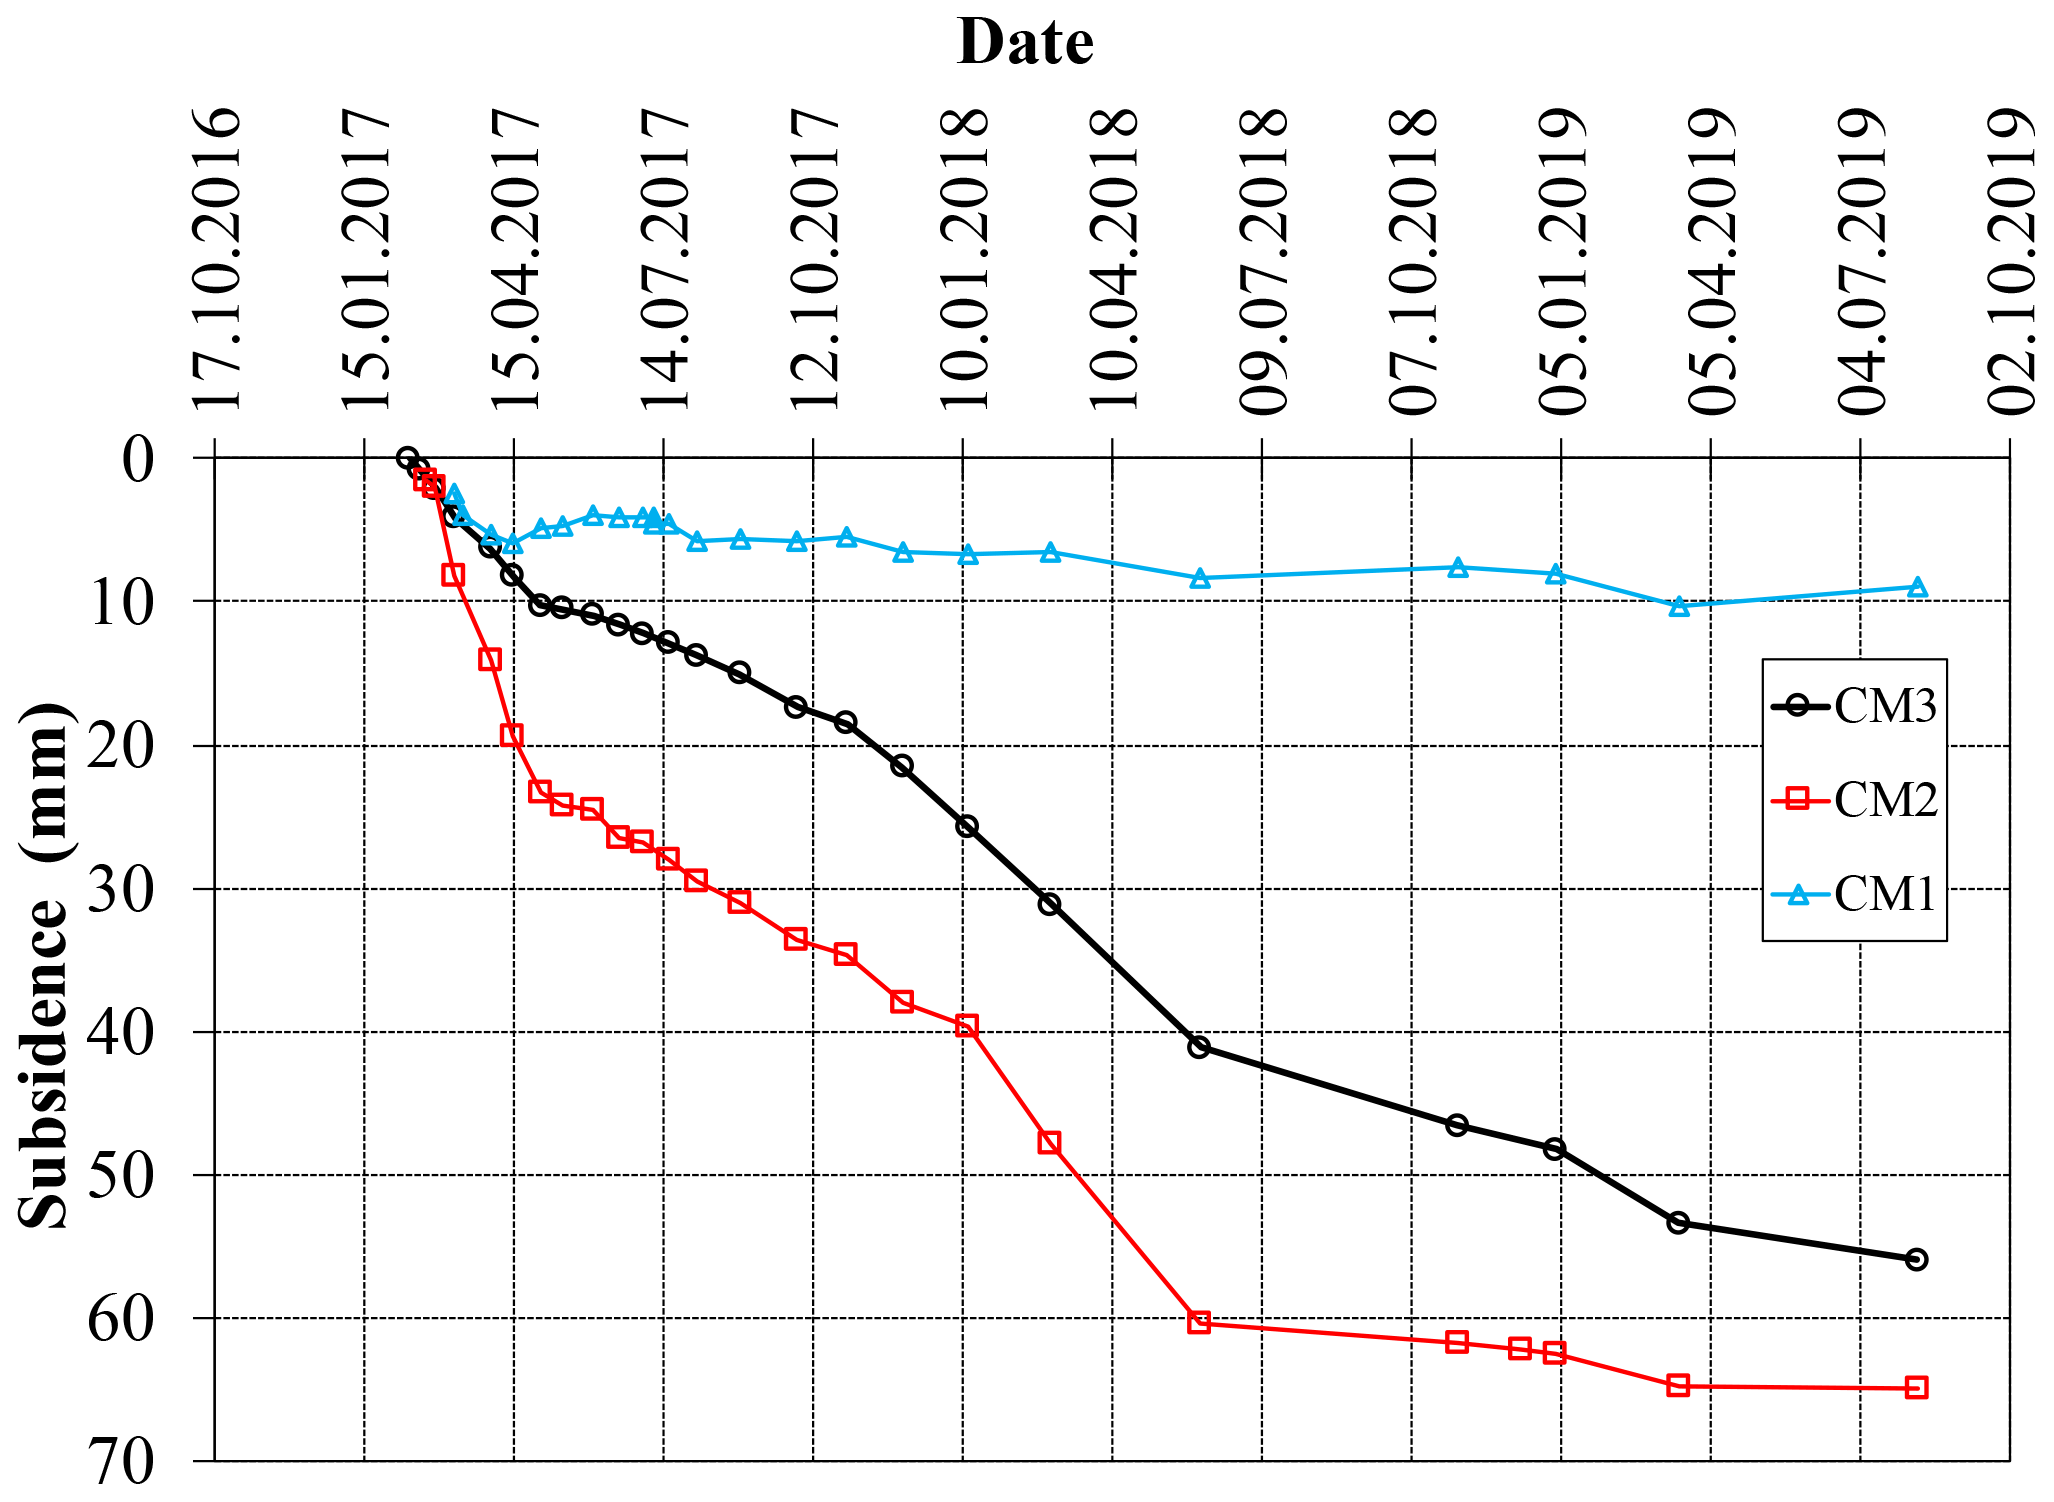
In 2017, for the first time, a physical system for subsidence monitoring was installed at three selected locations in the Ca Mau province. At each location a deep benchmark to a depth of 100 m was installed, each with 3 piezometers at depths ranging from 15 to 60 m. An InSAR corner reflector was also installed at each site.

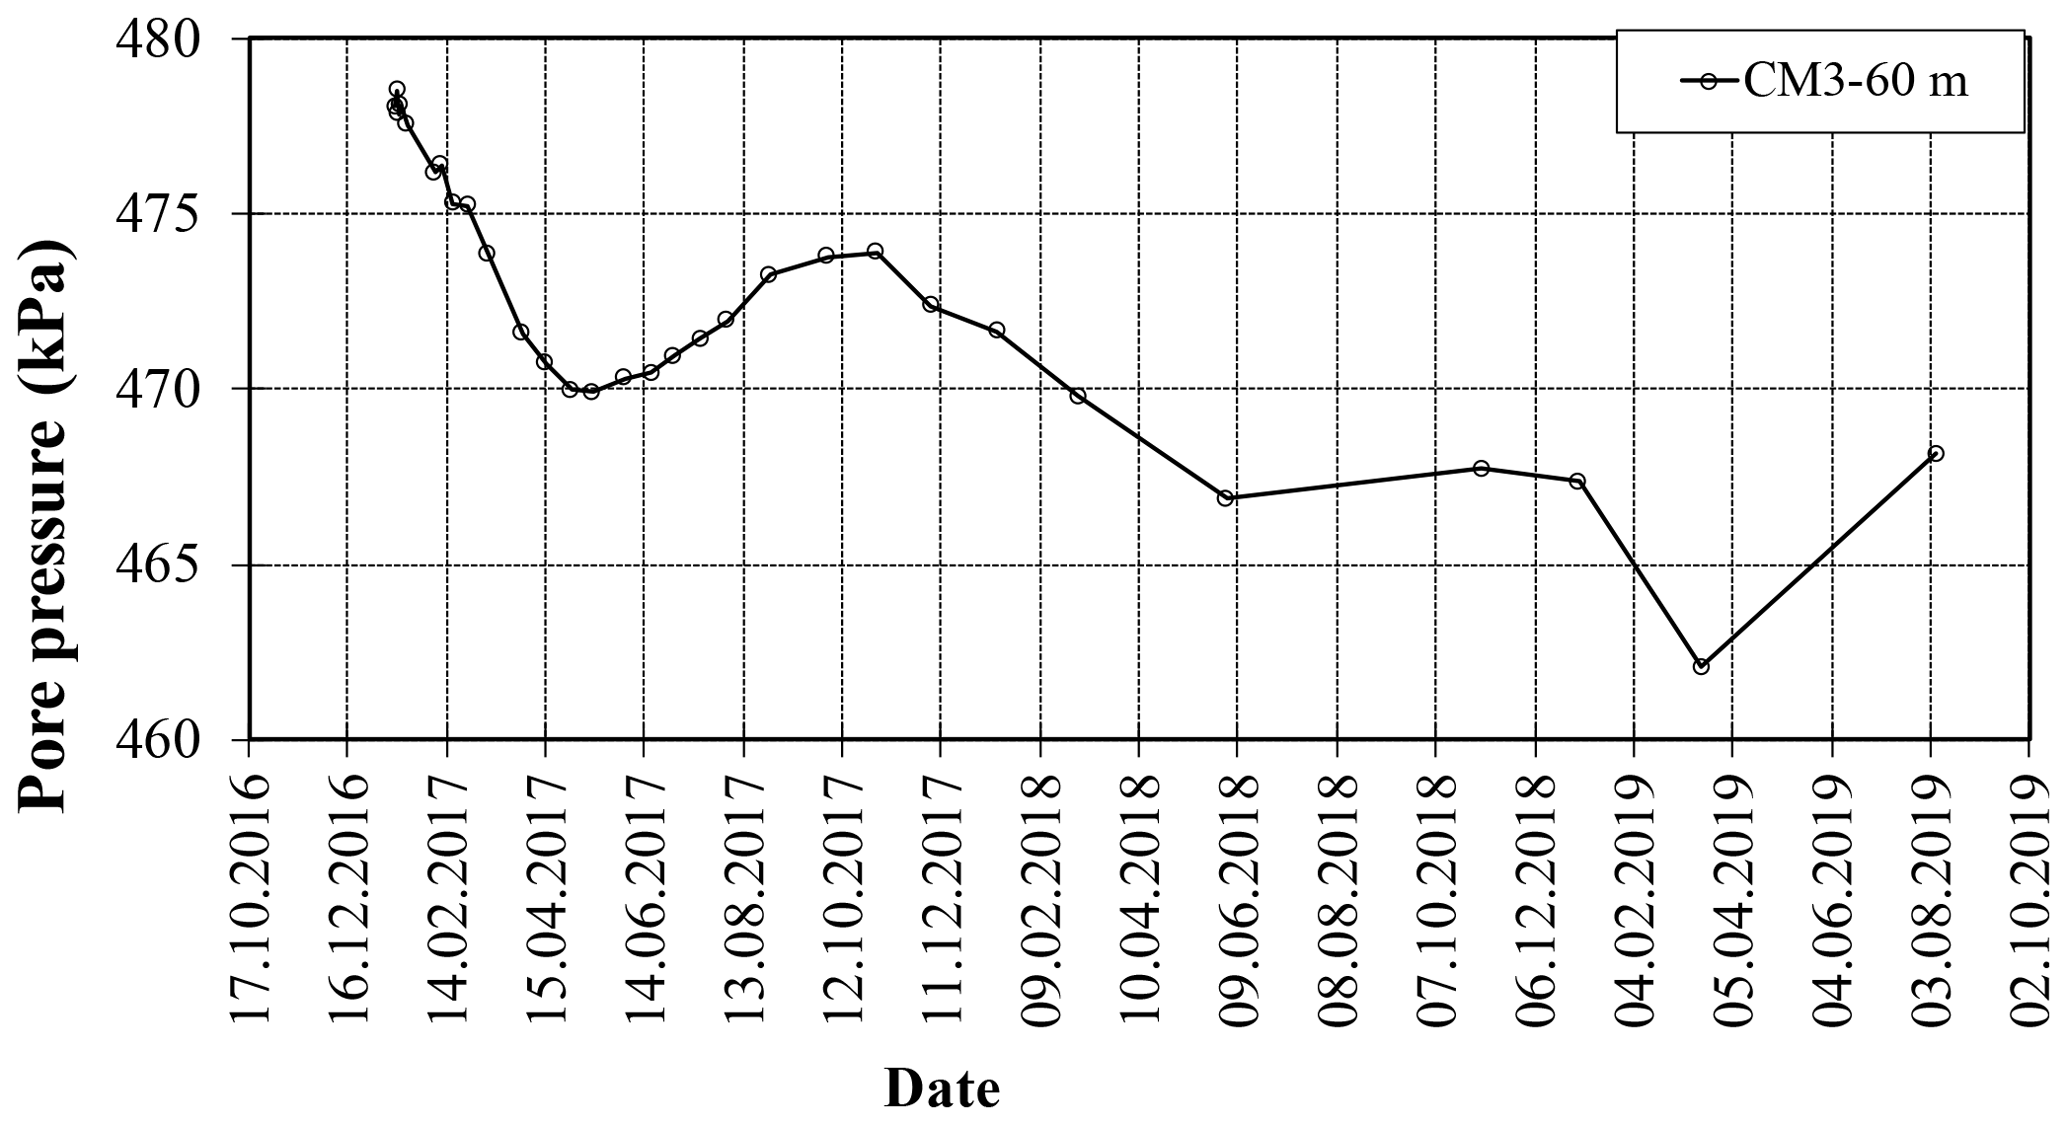
The paper presents data collected from these new monitoring stations up until the middle 2019. When including estimated subsidence stemming from the soil levels deeper than 100 m, the total present rate of subsidence at the three new monitoring stations range from 17 to 44 mm yr−1. New and previous data show an almost linear decrease in water level within the aquifers from which groundwater is pumped. The data show some seasonal variations in subsidence rates, which is also reflected in variations in pore pressures in the sediments. Such variations are probably related to seasonal variations in levels of groundwater pumping. It is feared that many of the other provinces south of Ho Chi Minh city, face similar subsidence problems. The monitoring program should be extended to verify that. Measures to reduce groundwater and subsidence are urgently needed.

1 Introduction

Through the Norwegian Ministry of Foreign Affairs (MFA) in Oslo, the Norwegian Geotechnical Institute (NGI) was in 2012 requested to assist the Ministry of Agriculture and Rural Development (MARD) in Vietnam to assess apparent “land-loss” problems observed along the coastline of the Ca Mau province located at the SW tip of Vietnam (Fig. 1).

https://www.proc-iahs.net/382/111/2020/piahs-382-111-2020-f01

Figure 1Location of Ca Mau province (a) and the three new subsidence monitoring stations (b).

It was indicated to NGI that the apparent “land-loss” was associated with a combination of enhanced coastal erosion and retreat of the shoreline, a possible general subsidence (sinking) of the ground surface relative to the sea-level, or possibly also a rising sea-level induced by climate changes. The enhanced shoreline erosion caused loss of Mangrove forest which contributes to protect the coastline against erosion. Increasing saltwater intrusion into canals and rivers in the region would be a consequence and part of the “land-loss” problem, and had already some impact on agricultural farming (rice production) as well as shrimp and fish farming in the province.

The 2012–2013 study (NGI, 2012; Karlsrud et al., 2017a) concluded that the significant ongoing groundwater pumping in the Ca Mau province was the main reason for the land loss. It is well documented that this already had caused a drawdown m the water level in observation wells by up to about 20 m in the sandy aquifers below a depth of about 100 m from which pumping took place. Theoretical settlement analyses suggested that large parts of Ca Mau could undergo subsidence of the order 2–4 cm yr−1 as a consequence of the groundwater pumping, and that the total subsidence could already have reached 40 cm or more since the depletion of the groundwater level started around 1995. As large parts of Ca Mau only lies 0.5 to 1.5 m a.s.l. (above sea level), the consequences would rapidly become dramatic for the livelihood of people in Ca Mau. It was also feared that many of the other provinces in South Vietnam (south of HCM city) could experience similar subsidence, meaning that the livelihood of about 24 million people is at stake.

The InSAR (Interferometric Synthetic Aperture Radar) technology has already been used to study, monitor, and map land subsidence at a large spatial scale in the region (Murakami et al., 2012; Minderhoud et al., 2017). Other researchers have used groundwater flow modelling for impact assessment of lowering groundwater levels on land subsidence (Erban et al., 2014; Minderhoud et al., 2015, 2017). Both methods provided indirect measurements of land subsidence that broadly agreed with the past study by NGI (2012).

For updating National Climate Adaptation and Mitigation action strategy for Vietnam, it was considered urgently needed to verify the ground water pumping driven subsidence, by establishing an accurate and continuous physical monitoring of land subsidence in the area. A Phase 2 – Pilot Monitoring project was therefore, initiated in 2016 to get some direct measurements of ongoing rates of subsidence. This project involved:

  • Installation of settlement anchors (benchmarks) to a depth of 100 m at three selected locations CM1 to CM3 shown in Fig. 1. The settlement of a concrete platting, cast just below the upper organic top soil layer, is measured relative to the benchmark installed to 100 m by means of an automated Linear Variance Displacement Transducer (LVDT). The main principle of these installations is a massive inner 12 mm fiberglass rod connected at the end to a 5 m long rebar grouted into the bottom of the drilled hole at 100 m depth. An outer telescoping 32 mm plastic casing protects the inner rod from any impact of ground settlements. The space between this plastic casing and the steel-cased drill hole was grouted with a bentonite/cement grout trying to match the stiffness of the surrounding soil.

  • Installation of piezometers to monitor pore pressures at three different levels (typically depths of 20, 40 and 60 m) at all three benchmark locations.

  • Carry out soil sampling and cone penetration testing (CPTU type) to identify soil stratification and main soil characteristics at the benchmark locations, with focus on the upper soft clay layer.

  • Based on past geologic mapping and borings, establish an overall picture of the geology and soil stratification within the Ca Mau province.

The installation work and some initial data were fully documented in a report by Karlsrud et al. (2017b) issued by NGI, but with major input from Vietnamese Institute of Geologic and Mineral Resources (VIGMR, 2017) who carried out most of the field work and geologic mapping. This paper gives a brief summary of the main findings, based on data monitored through the period February 2017 through July 2019.

2 Geology and ongoing groundwater pumping

The Ca Mau province covers an area of about 5210 km2 (Fig. 1). The sediment pack, up to at least 380 m thick, consist mainly of intermittent layers or zones of sandy river sediments and marine clays. The top soil layer is a recent very soft normally consolidated (NC) plastic clay layer, with thickness ranging from about 3 to 41 m (about 20 m average). Below the soft clay layer, there are alternating layers of Holocene deposits of medium to stiff silty sands and silty clays, each with average thickness ranging from about 15 to 42 m. Figure 2 shows an example of the stratification, based on data synthesised by VIGMR (2017), using available borehole data. Figure 3 gives a simplified presentation of the soil stratification found at the three new benchmarks based on data presented in the report by Karlsrud et al. (2017b).

https://www.proc-iahs.net/382/111/2020/piahs-382-111-2020-f02

Figure 2Local extract of geologic section over length of about 13 km with deepest borehole to 302 m. The reddish or brownish colours are for silty Clays, and the greenish colours are Sands (from VIGMR, 2017).

Download

https://www.proc-iahs.net/382/111/2020/piahs-382-111-2020-f03

Figure 3Soil stratification at benchmark locations.

Download

The reported total amount of groundwater pumping (GWP) in the Ca Mau province was 373 332 m3 d−1 in 2009 (DWRPIS, 2009). The monitored water levels in observation wells have shown a steady decline from start of measurements in 1995 to present, see example in Fig. 4.

https://www.proc-iahs.net/382/111/2020/piahs-382-111-2020-f04

Figure 4Example of drawdown in GW level with time in observation wells (based on data from DWRPIS, 2014).

Download

Figure 5 shows the total drawdown of the water level in different observation wells installed across the Ca Mau province, and the yearly rate of drawdown. Herein are also included data from the newly installed piezometers at the three benchmark locations. The data shows that the largest drawdown (up to 25 m) and drawdown rate (up to 3 m yr−1) occurs in the depth range 100 to 250 m, where the largest amount of GWP probably takes place. The new piezometer data show a drawdown of 6 to 15 m at a depth of 60 m. The drawdown at shallow depths within the upper NC clay layer is so far limited to about 1 to 3 m.

https://www.proc-iahs.net/382/111/2020/piahs-382-111-2020-f05

Figure 5Measured drawdown (a) and rate of drawdown (b) in observation wells, and new piezometers installed at CM1–CM3.

Download

3 Monitored subsidence

Figure 6 presents the measured subsidence at the three new benchmark locations. It is important to recognize that the data in Fig. 6 give settlements only stemming from the upper 100 m of the sediment pack. The average subsidence or settlements rates correspond to about 4, 24 and 31 mm yr−1 at locations CM1, CM2 and CM3 respectively. Based on the rate of drawdown versus depth in Fig. 5b, Karlsrud et al. (2017b) estimated an additional typical yearly rate of settlement of 13 mm yr−1 stemming from soil levels below a depth of 100 m. This means that the total average rate of ground level subsidence would be respectively 17, 37 and 44 mm yr−1 at the three locations.

https://www.proc-iahs.net/382/111/2020/piahs-382-111-2020-f06

Figure 6Measured ground surface subsidence relative to benchmarks at 100 m depth.

Download

Figure 6 suggests that the measured subsidence rates are largest between months of February and April at all three locations. The monitored pore pressures at the three monitoring stations, especially at the deepest level, also generally show similar seasonal variations. Figure 7 presents as an example, variations in pore pressure for the piezometer at 60 m depth at the CM3 location. Here the seasonal variation, compared to a steady rate of decline, is of the order ±2–3 m. These seasonal variations are, most likely related to a variation in groundwater pumping, resulting from variations in land use during the different seasons, which in turn leads to a varying subsidence rate.

https://www.proc-iahs.net/382/111/2020/piahs-382-111-2020-f07

Figure 7Example of change in pore pressure with time for piezometer at 60 m depth, CM3 location.

Download

Figure 6 could also suggest that there is a tendency for reduction in rates of subsidence from the first to the second year of observations. It is however, considered too early to conclude on that. It is therefore, important that the monitoring continues over a longer time span to conclude on such trends.

That the rate of subsidence apparently is much smaller at CM1 than at the other two locations is surprising. Especially when considering that the drawdown at the new piezometer at 60 m here is the largest (Fig. 5). A tentative explanation may be that that down to a depth of 100 m, the total thickness of sand layers corresponds to about 60 % of the total, whereas it is only 3.3 % at CM2 and 23 % at CM3 (Fig. 3). It is also a possibility that for unknown reasons the installation at CM1 has not completely succeeded in eliminating down-drag forces on the inner fiberglass rod.

4 Summary and conclusions

The main conclusions drawn from these new subsidence measurements are as follows:

  • When including estimated subsidence stemming from the soil levels deeper than 100 m, the total rate of subsidence at the three new monitoring stations in Ca Mau range from 17 to 44 mm yr−1. This agrees very closely with what has been predicted based on theoretical consolidation analyses (Karlsrud et al., 2017a), and groundwater modelling and InSAR radar data interpretations presented by Minderhoud et al. (2017).

  • It is predicted that the subsidence will continue at a similar rate for decades ahead if the groundwater pumping in the region continues at present level. Because the natural ground level in Ca Mau was mostly at level +0.5 to +1.5 m a.s.l., and has already subsided by many decimetres, this continued subsidence will within a few decades, have catastrophic consequences for the livelihood of people in the region. The recent InSAR data and analyses presented by Minderhoud et al. (2017), confirms subsidence rates in Ca Mau of the same order as suggested by the new benchmarks. Their data and analyses data also suggest that several of the other provinces in the region from HCM city and southwards experience similar subsidence. Thus, unless strong restrictions are set on groundwater pumping in these regions, the total social and economic impact on Vietnam will be dramatic.

  • The Vietnamese government is therefore, recommended to take immediate actions to strongly reduce groundwater pumping in these regions. Further analyses are required to address to what level groundwater pumping must be reduced to completely stop the subsidence. To keep control of the situation and impact of mitigating measures, it is also recommended to install more observation wells, subsidence benchmarks, and InSAR radar reflectors covering all of Vietnam south of HCM city.

Data availability

The data are not made generally accessible, because these are preliminary results of the ongoing project. According to the regulation of our institution, data are not made generally accessible before the end of the project.

Author contributions

All authors are responsible for developing the ideas. KK and LT designed the monitoring system. NQK and NQD implemented and monitored the system, processed the data. LT contributes for supervision of the installation of the system. KK and NQD mainly contribute to the writing parts.

Competing interests

The authors declare that they have no conflict of interest.

Special issue statement

This article is part of the special issue “TISOLS: the Tenth International Symposium On Land Subsidence – living with subsidence”. It is a result of the Tenth International Symposium on Land Subsidence, Delft, the Netherlands, 17–21 May 2021.

Acknowledgements

The work presented herein was partly financed by the Norwegian Ministry of Foreign Affairs through funding to the Asian Disaster Preparedness Center (ADPC). ADPC and the Ministry of Agriculture and Rural Development in Vietnam helped with coordinating the work and arranging workshops. The Vietnamese Institute of Geosciences and Mineral Resources (VIGMR) was contracted to undertake the fieldwork, and also self-financed some of their work. The support from all these parties to the work presented herein is greatly appreciated.

Financial support

This research has been supported by the Norwegian Ministry of Foreign Affairs.

References

DWRPIS – Division for Water Resources Planning and Investigation for the South of Vietnam: Report on survey of abstraction and use of groundwater, quality assessment and remedial measures for groundwater pollution in Cà Mau Province), Ho Chi Minh City, 2009. 

DWRPIS – Division for Water Resources Planning and Investigation for the South of Vietnam: Report on assessment of the impacts of groundwater abstraction and climate change on groundwater resources in Mekong Delta, Vietnam, Ho Chi Minh City, 2014. 

Erban, L. E., Gorelick, S. M., and Zebker, H. A.: Groundwater extraction, land subsidence and sea-level rise in the Mekong Delta, Vietnam, Environ. Res. Lett., 9, 084010, https://doi.org/10.1088/1748-9326/9/8/084010, 2014. 

Karlsrud, K., Vangelsten, B. V., and Frauenfelder, R.: Subsidence and shoreline retreat in the Ca Mau Province – Vietnam. Causes, consequences and mitigation options, Geotechnical Journal of the SEAGS & AGSSEA, 48, ISSN 0046-5828, 2017a. 

Karlsrud, K., Tunbridge, L., Dinh, N. G., and Khahn, N. Q.: Land subsidence in Ca Mau Province, Vietnam. Results from Phase 2 – Pilot Monitoring Project, NGI report 20120075-02-R dated 2017-09-04, Norwegian Geotechnical Institute, Oslo, 2017b. 

Minderhoud, P. S. J., Erkens, G., Pham, V. H., Bui, V. T., Erban, L., Kooi, H., and Stouthamer, E. : Assessing the potential of the multi-aquifer subsurface of the Mekong Delta (Vietnam) for land subsidence due to groundwater extraction, Proc. IAHS, 372, 73–76, 2015. 

Minderhoud, P. S. J., Erkens, G., Pham, V. H., Bui, V. T., Erban, L., Kooi, H., and Stouthamer, E.: Impacts of 25 years of groundwater extraction on subsidence in the Mekong Delta, Vietnam, Environ. Res. Lett., 12, 064006, https://doi.org/10.1088/1748-9326/aa7146, 2017. 

Murakami, S., Kawase, M., and Komine, H.: Land subsidence in Mekong Delta by using InSAR and future development for vulnerability assessment in consideration of global climate change, in: International Workshop-HUE GEO-ENGINEERING 2012, 17–18 December 2012, Hue City, Vietnam, 2012. 

NGI: Assessment of apparent land loss in the province of Ca Mau, Vietnam, Phase 1 report, Report 20120075-01R dated 31.12.2012, Norwegian Geotechnical Institute, Oslo, 2012. 

VIGMR – Vietnamese Institute of Geosciences and Mineral Resources: Report on the installation of 3 land subsidence monitoring benchmarks in Ca Mau province, Hanoi, August 2017.