the Creative Commons Attribution 4.0 License.
the Creative Commons Attribution 4.0 License.
 | 22 Apr 2020
A multiscale approach for detection and mapping differential subsidence using multi-platform InSAR products
Dario E. Solano-Rojas
Shimon Wdowinski
Enrique Cabral-Cano
Batuhan Osmanoglu
Emre Havazli
Jesus Pacheco-Martínez
Detecting and mapping subsidence is currently supported by interferometric synthetic aperture radar (InSAR) products. However, several factors, such as band-dependent processing, noise presence, and strong subsidence limit the use of InSAR for assessing differential subsidence, which can lead to ground instability and damage to infrastructure. In this work, we propose an approach for measuring and mapping differential subsidence using InSAR products. We consider synthetic aperture radar (SAR) data availability, data coverage over time and space, and the region's subsidence rates to evaluate the need of post-processing, and only then we interpret the results. We illustrate our approach with two case-examples in Central Mexico, where we process SAR data from the Japanese ALOS (L-band), the German TerraSAR-X (X-band), the Italian COSMO-SkyMed (X-band) and the European Sentinel-1 (C-band) satellites. We find good agreement between our results on differential subsidence and field data of existing faulting and find potential to map yet-to-develop faults.


Several locations around the world experience land subsidence due to groundwater extraction (e.g. Gambolati and Teatini, 2015; Semple et al., 2017). Central Mexico alone, has more than twenty urban areas reported as subsiding (Brunori et al., 2015; Cabral-Cano et al., 2008; Chaussard et al., 2017; Pacheco-Martínez et al., 2015). More importantly, spatial variation of subsidence in several of such locations has led to differential subsidence and, consequently, to ground faulting and infrastructure damage (Avila-Olivera and Garduño-Monroy, 2008; Pacheco-Martínez et al., 2013).
City-scale subsidence patterns and rates have been characterized since the 1940's using multiple geodetic techniques. In recent decades, InSAR measurements have allowed the mapping of large subsiding areas at the scale of entire cities and with frequent observations (e.g. Amelung et al., 1999; Hoffmann et al., 2001). However, several factors limit the application and interpretation of InSAR results for differential subsidence mapping, such as data availability, processing particularities, data integration, and signal interpretation in the presence of strong subsidence.
In this work, we illustrate an approach focused specifically on detecting and mapping differential subsidence based on SAR data from different platforms, elevation data and basic field information. We illustrate our approach with two case studies in Central Mexico, which have different subsidence characteristics and different data availability. The ultimate goal of our approach is to share the expertise we have acquired after studying several cases of differential subsidence for expanding its application to other areas with data availability constrains.
We propose using SAR data, a digital elevation model (DEM) from the Shuttle Radar Topography Mission (SRTM) mission, and surface field data when available.
We rely on four SAR datasets, of which two cover Aguascalientes and two Mexico City. The two datasets covering Aguascalientes consist on 34 ALOS PALSAR scenes acquired form August 2007 to March 2011 and six TerraSAR-X acquired from December 2009 and September 2012. The two datasets covering Mexico City consist of 144 Sentinel-1 scenes acquired from 2014 to 2017 and 21 COSMO-SkyMED scenes acquired from December 2011 to June 2012. We process the SAR using InSAR techniques, which relies on the existence of at least two satellite acquisitions to perform pixel-wise phase differences to generate a map of interferometric phase differences, so-called interferogram (Fig. 1).
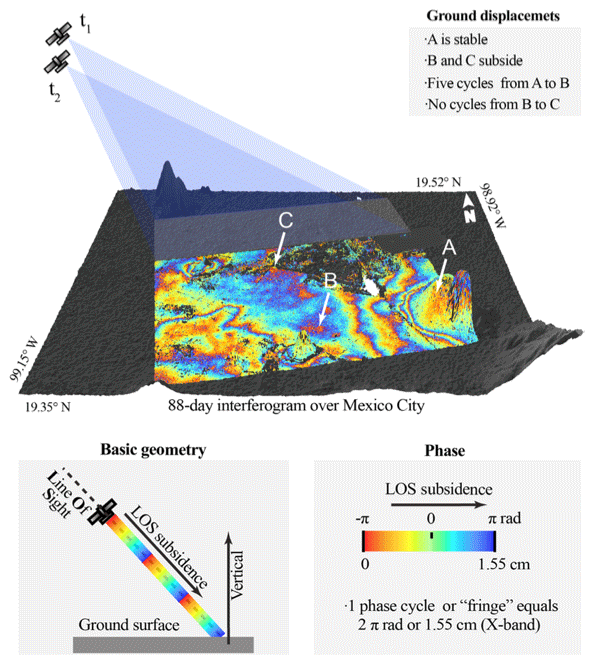
Figure 1Schematic illustration describing the concept of repeat-pass InSAR. The interferogram was calculated from a COSMO-SkyMed SAR pair acquired on 3 April and 30 June 2012 over Mexico City. Point A is a stable area known as Chimalhuache hill. Point B is located close to Peñón de los Baños. Point C is located over Benito Juárez International Airport. Shaded relief from SRTM data.
We perform single-interferogram processing using the Delft object-oriented radar interferometric software (Doris) (Kampes et al., 2004) and time series processing using either the Stanford Method for Persistent Scatterers (StaMPS) (Hooper et al., 2007) or the Miami InSAR time-series software in Python (MintPy) (Yunjun et al., 2019). Additionally, we perform post-processing of the InSAR velocity maps results using subsidence gradient (Cabral-Cano et al., 2008) or band pass filtering (Solano-Rojas, 2018).
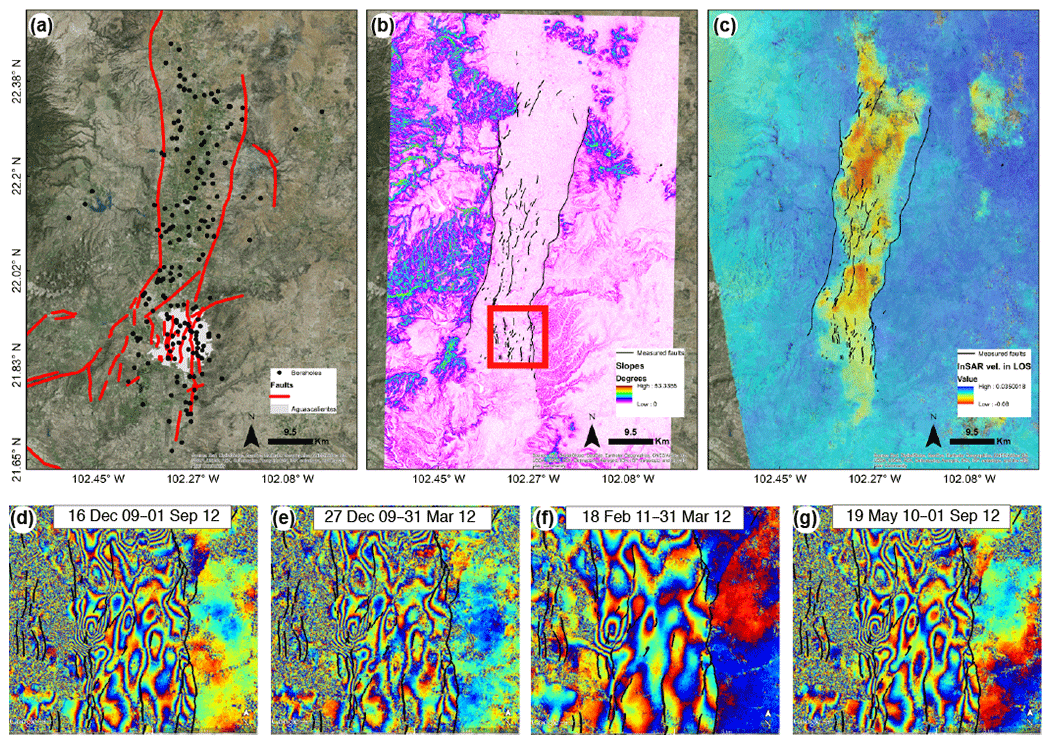
Figure 2Case example of differential subsidence analysis over Aguascalientes Valley. (a) Satellite image (source: © Esri, Digital Globe, GeoEye, Earthstar Geographics, CNES Airbus, USDA, USGS, ADX, Getmapping, Aerogrid, IGN, swisstopo, and the GIS community) overlaid by locations of groundwater-extraction wells in the area. Red lines represent faults mapped in the city. (b) Slopes map from SRTM topographic data. Red square shows the limits of (d)–(g). (c) Velocity map from 34 ALOS PALSAR scenes acquired form August 2007 to March 2011. (d)–(g) High resolution interferograms of Aguascalientes' urban area from TerraSAR-X data. Each fringe corresponds to 1.55 cm of subsidence.
3.1 Aguascalientes
The valley of Aguascalientes experiences subsidence rates of up to 100 [mm yr−1] due to overexploitation of its aquifer system (Chaussard et al., 2014). The city is located within a tectonic graben (Fig. 2a). The topographic slopes map of the area shows flat topography in the middle of the graben, which forms the valley (Fig. 2b). Mapped surface faults in the region show that the graben-delimiting faults are orientation roughly NE–SW, in agreement with the topographic slopes. The InSAR velocity map from ALOS data (Fig. 2c) shows a clear subsidence pattern within the graben, in agreement with previous observations (Pacheco-Martínez et al., 2015). However, the graben limits do not exactly coincide with the transition between subsiding and stable areas (see northern portion of the eastern main fault). There seems to be, instead, a better agreement between the topographic slope map and the faults location.
High-resolution single interferograms produced with pairs of TerraSAR-X (TSX) images (Fig. 2d–g) reveal a-few-fringes patterns in the easternmost portion of the study area, as opposed to the many-fringes pattern observed in the centre of the interferograms. Evidently, interferograms comprising a longer time span shows a more complex interferometric pattern, due to the accumulation of subsidence (compare Fig. 2d vs Fig. 2f, for instance). The discontinuities in the phase coincide well with the presence of the field-surveyed surface faulting. As a matter of fact, the interferometric pattern shows additional phase discontinuities that may correspond to not-yet mapped or not-yet-developed surface faults. We interpret that these phase discontinuities.
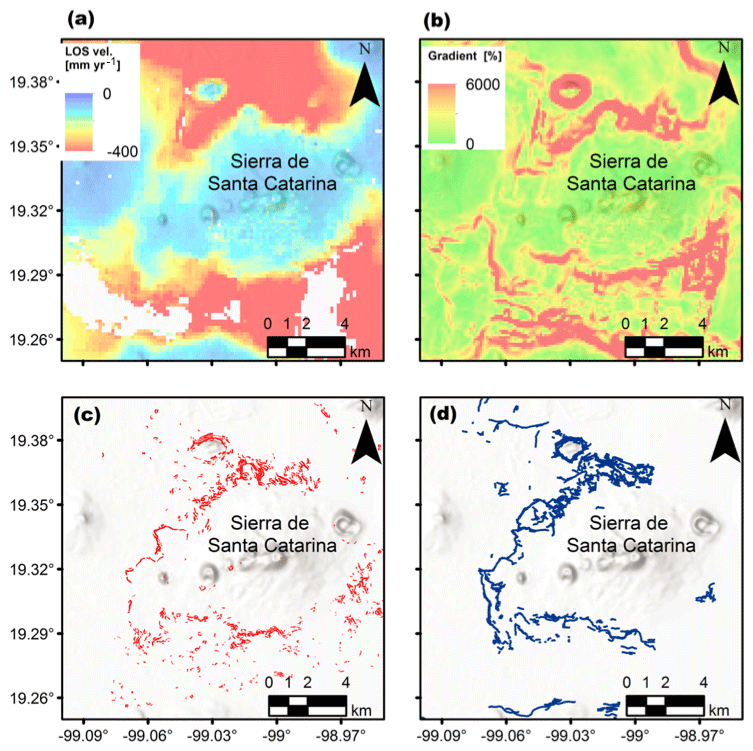
Figure 3Case example of differential subsidence analysis over South Mexico City. (a) Velocity map from 144 Sentinel-1satellites acquired from 2014 to 2017. (b) Horizontal gradient calculated from (a). (c) Areas of differential subsidence calculated from high-resolution COSMO-SkyMED data. (d) 10-year worth of subsidence-related shallow faults mapped by the city's government (CENAPRED, 2017). Shaded relief from SRTM data.
3.2 Mexico City
Mexico City is one of the largest and most populated urban areas in the world. The city was built on a highly compressible lacustrine sediment sequence, which has been subjected to fast land subsidence with rates exceeding 350 mm yr−1, in response to aggressive groundwater extraction,
Our Sentinel-1 InSAR velocity map from 2014 to 2017 (Fig. 3a) shows that Sierra de Santa Catarina is stable, while its surroundings subside rapidly (400 mm yr−1). We calculate a gradient velocity map, which shows the highest values around Sierra de Santa Catarina (Fig. 3b). Additionally, we calculate a velocity map from the COSMO-SkyMed constellation data and obtain the boundaries of sharp transition between highly-subsiding and highly-uplifting (Fig. 3c). The areas of pronounced differential displacements agree well with the location of pre-existing, subsidence-related faults identified during 10 years of field surveys (CENAPRED, 2017).
The proposed approach shows the capability of multiplatform, multiresolution InSAR for detecting and mapping differential subsidence and surface faulting. The strategic advantage of this approach is its reliance on mostly available products (i.e. SAR data, SRTM DEM, basic field surveys). Medium-resolution results from ALOS and Sentinel-1 satellites depict well the larger-scale subsidence patterns. Detailed faulting cartography in the urban area coincide with phase discontinuities in this interferograms produced with higher-resolution data from TerraSAr-X, with potential for mapping of not-reported faults and improved understanding of the subsurface.
Additionally, post-processing techniques from both low resolution (such as subsidence gradient) and high resolution (such as band-pass filtering) datasets provide a tool for improving the understanding of differential subsidence, as shown in the Mexico City study case. Differential subsidence shows to be particularly large in areas of sharp geotechnical transitions denoted by topographic slope changes.
The SAR data that support the findings of this study are available from e-GEOS (http://www.e-geos.it) (Italian Space Agency, 2020), the German Space Agency (DLR: http://www.dlr.de) (German Aeroespace Center, 2020), the European Space Agency (ESA: https://www.esa.int) (European Space Agency, 2020) and the Japan Aerospace Exploration Agency (JAXA: http://www.global.jaxa.jp) but restrictions apply to the availability of these data, which were used under license for the current study (Japan Aerospace Exploration Agency, 2020). The topographic data used for shaded relief maps and topographic correction of InSAR results are available in the USGS repository (https://earthexplorer.usgs.gov/) (Farr et al., 2007). The InSAR results are available from the corresponding author upon reasonable request.
DS and SW conceptualized the research and developed the methodology, DS processed the X-band and ALOS data and EH processed the Sentinel data. DS conducted the investigation under the supervision of SW. JP provided all the field data over Aguascalientes. The SAR data was obtained by EC and BO. DS and SW wrote the manuscript and all authors revised it.
The authors declare that they have no conflict of interest.
This article is part of the special issue “TISOLS: the Tenth International Symposium On Land Subsidence – living with subsidence”. It is a result of the Tenth International Symposium on Land Subsidence, Delft, the Netherlands, 17–21 May 2021.
Dario E. Solano-Rojas acknowledges funding from CONACyT and Fulbright-García Robles for his doctoral studies. Shimon Wdowisnki acknowledges funding from NASA project NNX12AQ08G and Enrique https://www.proc-iahs.net/382/173/2020/piahs-382-173-2020-f01.pngCabral-Cano acknowledges support from UNAM-PAPIIT projects IN104213, IN109315-3 and IV100215 and CONACyT projects 256012, and 253760 and supplemental support from UNAM-Instituto de Geofísica.
This research has been supported by the NASA (grant no. NNX12AQ08G), the UNAM-PAPIIT (grant nos. IN104213, IN109315-3, and IV100215), and the CONACyT (grant nos. 256012 and 253760).
Amelung, F., Galloway, D. L., Bell, J. W., Zebker, H. A., and Laczniak, R. J.: Sensing the ups and downs of Las Vegas: InSAR reveals structural control of land subsidence and aquifer-system deformation, Geology, 27, 483–486, 1999.
Avila-Olivera, J. A. and Garduño-Monroy, V. H.: A GPR study of subsidence-creep-fault processes in Morelia, Michoacán, Mexico, Eng. Geol., 100, 69–81, https://doi.org/10.1016/j.enggeo.2008.03.003, 2008.
Brunori, C. A., Bignami, C., Albano, M., Zucca, F., Samsonov, S., Groppelli, G., Norini, G., Saroli, M. and Stramondo, S.: Land subsidence, ground fissures and buried faults: InSAR monitoring of Ciudad Guzmán (Jalisco, Mexico), Remote Sens., 7, 8610–8630, https://doi.org/10.3390/rs70708610, 2015.
Cabral-Cano, E., Dixon, T. H., Miralles-Wilhelm, F., Díaz-Molina, O., Sánchez-Zamora, O., and Carande, R. E.: Space geodetic imaging of rapid ground subsidence in Mexico City, Bull. Geol. Soc. Am., 120, 1556–1566, https://doi.org/10.1130/B26001.1, 2008.
Centro Nacional de Prevención de Desastres (CENAPRED): Fracturas en la Ciudad de Mexico, Atlas Nac. Riesgos, available at: http://www.atlasnacionalderiesgos.gob.mx/archivo/visor-capas.html (last access: 20 August 2005), 2017.
Chaussard, E., Wdowinski, S., Cabral-Cano, E., and Amelung, F.: Land subsidence in central Mexico detected by ALOS InSAR time-series, Remote Sens. Environ., 140, 94–106, https://doi.org/10.1016/j.rse.2013.08.038, 2014.
Chaussard, E., Milillo, P., Bürgmann, R., Perissin, D., Fielding, E. J., and Baker, B.: Remote Sensing of Ground Deformation for Monitoring Groundwater Management Practices: Application to the Santa Clara Valley During the 2012–2015 California Drought, J. Geophys. Res.-Sol. Ea., 122, 8566–8582, https://doi.org/10.1002/2017JB014676, 2017.
European Space Agency: Sentinel-1 data archieve, available at: https://scihub.copernicus.eu/dhus/#/home (last access: 20 August 2002), 2020.
Farr, T. G., Rosen, P. A., Caro, E., Crippen, R., Duren, R., Hensley, S., Kobrick, M., Paller, M., Rodriguez, E., Roth, L., Seal, D., Shaffer, S., Shimada, J., Umland, J., Werner, M., Oskin, M., Burbank, D., and Alsdorf, D. E.: The shuttle radar topography mission, Rev. Geophys., 45, 1–43, https://doi.org/10.1029/2005RG000183, 2007.
Gambolati, G. and Teatini, P.: Geomechanics of subsurface water withdrawal and injection, Water Resour. Res., 51, 3922–3955, https://doi.org/10.1002/2014WR016841, 2015.
German Aeroespace Center: TerraSAR-X data archieve, available at: https://terrasar-x-archive.terrasar.com/ (last access: 20 April 2002), 2020.
Hoffmann, J., Zebker, H. A., Galloway, D. L., and Amelung, F.: Seasonal subsidence and rebound in Las Vegas Valley, Nevada, observed by synthetic aperture radar interferometry, Water Resour. Res., 37, 1551–1566, https://doi.org/10.1029/2000WR900404, 2001.
Hooper, A., Segall, P., and Zebker, H.: Persistent scatterer interferometric synthetic aperture radar for crustal deformation analysis, with application to Volcan Alcedo, Galapagos, J. Geophys. Res.-Sol. Ea., 112, 1–21, https://doi.org/10.1029/2006JB004763, 2007.
Italian Space Agency: COSMO-SkyMed data archieve, available at: http://catalog.e-geos.it/ (last access: 20 March 2009), 2020.
Japan Aerospace Exploration Agency: ALOS PALSAR data archieve (through Vertex), 2020.
Kampes, B. M., Hanssen, R. F., and Perski, Z.: Radar interferometry with public domain tools, Eur. Sp. Agency, Special Publ. ESA SP, 550, 59–68, 2004.
Pacheco-Martínez, J., Cabral-Cano, E., Wdowinski, S., Hernández-Marín, M., Ortiz-Lozano, J. Á., and Zermeño-de-León, M. E.: Application of InSAR and Gravimetry for Land Subsidence Hazard Zoning in Aguascalientes, Mexico, Remote Sens., 7, 17035–17050, https://doi.org/10.3390/rs71215868, 2015.
Semple, A. G., Pritchard, M. E., and Lohman, R. B.: An incomplete inventory of suspected human-induced surface deformation in North America detected by satellite interferometric synthetic-aperture radar, Remote Sens., 9, 1–26, https://doi.org/10.3390/rs9121296, 2017.
Solano-Rojas, D.: Geological Hazard Assessments for Mexico City and its Surroundings Based on Synthetic Aperture Radar Interferometry (InSAR) Observations, University of Miami, available at: https://scholarlyrepository.miami.edu/oa_dissertations/2157 (last access: 22 March 2020), 2018.
Yunjun, Z., Fattahi, H., and Amelung, F.: Small baseline InSAR time series analysis: unwrapping error correction and noise reduction, 133, 104331, https://doi.org/10.1016/j.cageo.2019.104331, 2019.