the Creative Commons Attribution 4.0 License.
the Creative Commons Attribution 4.0 License.
 | 22 Apr 2020
Assessment of subsidence and consolidation of dredger fill area based on SBAS-InSAR and laboratory tests
Qing-bo Yu
Qing Wang
Xue-xin Yan
Tian-liang Yang
Jian-ping Chen
Meng Yao
Kai Zhou
Xin-lei Huang
With the development of economy, land reclamation by dredger fill has become an effective measure to alleviate the shortage of land resources. However, the accompanying subsidence has always been a challenge to the safe use of soil in dredger fill area. In this study, Chongming East Shoal, China, where dredger filling activities are going on in recent years was selected as the study area. SBAS-InSAR was applied to monitor the variation of land subsidence and deformation in the recent two years. Furthermore, a total of 25 undisturbed soil samples including dredger fill and underlying soil were collected from 5 boreholes (maximum depth 55 m), and the land at each borehole had different a formation time. The physical properties and compressibility were tested by laboratory tests. Results show that for the current state, fast to slow subsidence velocity was observed in the reclamation area close to the coastline, which is controlled by building load and geological features of soil layers. The building load is the main factor affecting the land subsidence and special attention should be paid. It is the poor drainage condition of the soil layer in the offshore area resulting in slow subsidence. Consolidation degree and final settlement of soil can be obtained from monitoring data of land subsidence. Based on the settlement-time curve obtained by SBAS-InSAR, the estimated final settlement of typical settlement area is −27.03 to −38.96 mm, and the corresponding consolidation degree is 58.95 % on average. It still takes a long time to achieve stability. In conclusion, land subsidence is essentially the macro-accumulation of drainage consolidation of all the soil layers, so it is controlled by soil structure and engineering geological properties of both dredger fill and underlying soil layer. The research combined with field investigation, laboratory testing can provide a mechanism explanation for monitoring results. Future research will focus on longer monitoring time and a higher sampling frequency to enrich and improve the research.


Shanghai is surrounded by many deep-water waterways. A large amount of dredged waste soils combined with tense land resources makes that land reclamation became the best choice to treat waste soil and expand land. However, dredger fill is characterized by a high porosity ratio, high compressibility, high water content, low permeability and low bearing capacity (Yuan et al., 2018). The dredger fills not only have a large amount of subsidence after land formation, but also can produce land subsidence, which is considered a series of geological hazards (Haas and Ban, 2014) causing great economic losses (Galloway et al., 2000; Sarychikhina et al., 2011). Therefore, it is crucial to monitor land subsidence in reclaimed areas to facilitate an understanding of the evolutionary processes. The Small Baseline Subset (SBAS) was proposed in the early 20th century (Berardino et al., 2002; Casu et al., 2006; Lanari et al., 2004). It is widely used in large-scale and long-time series surface deformation monitoring (Bing et al., 2016; Hu et al., 2014). Previous research on subsidence monitoring focused on the data processing algorithm for SAR data, rather than on the genetic mechanism in relation to reclamation activities and geological features (Fan et al., 2011). In this study, it is proposed to monitor Shanghai's ground deformation based on SBAS-InSAR. At the same time, combined with field investigation and laboratory testing, the mechanism of deformation is reconstructed from the perspective of consolidation. Finally, based on InSAR data, the consolidation degree and final settlement are estimated to provide reference for the prevention and control of land subsidence in the study area.
2.1 Study area
Shanghai is located at the estuary of the Yangtze River (Fig. 1a). Chongming Island is located in the northeast corner of Shanghai. The easternmost end of Chongming Island is Chongming East Shoal (CES) (Fig. 1b). The tidal flat on the outer edge is still advancing eastward (Fig. 1c). Combined with the large-scale reclamation activities, various thickness of dredger fill layer has been formed. The main land use type is agricultural land (Fig. 1d). However, the area to be built is under planning (Fig. 1e). In addition, the first batch of metro stations will be located in CES (Fig. 1b), which will further promote the development. However, little attention was paid to the ground deformation here before. Therefore, in this study, CES was selected as the study area.
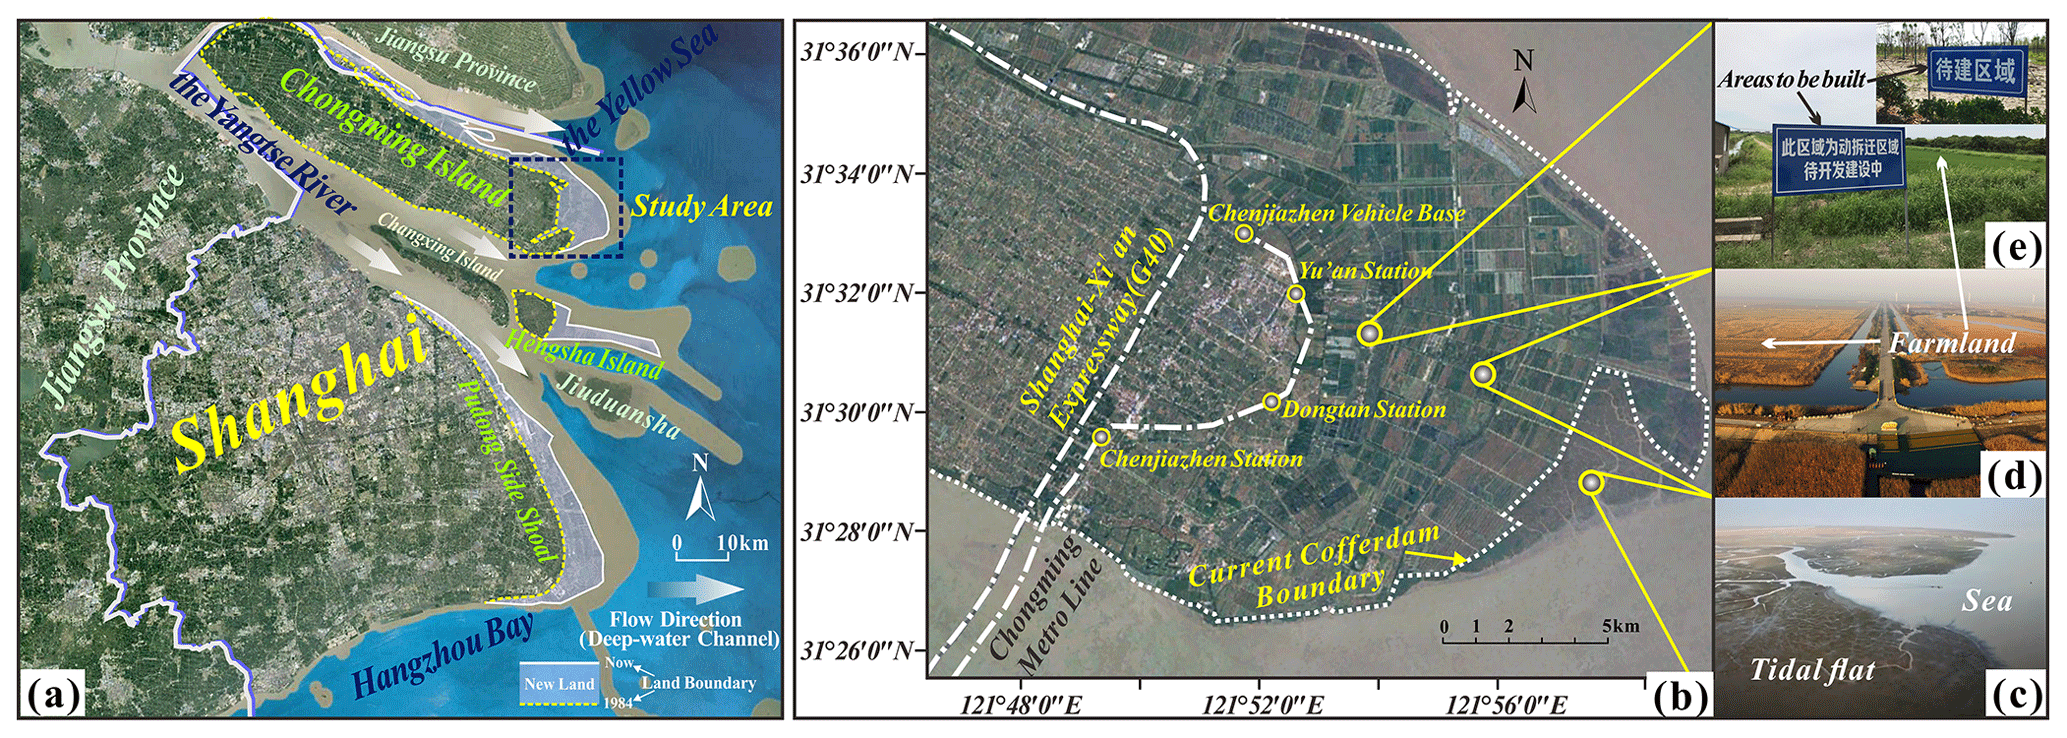
Figure 1© Google earth image based study area: (a) geographical location of Chongming East Shoal in Shanghai, China; (b) ground characteristics of Chongming East Shoal and the projects to be built; (c) growing tidal-flat areas; (d) major land type and (e) construction land in planning.
2.2 SBAS-InSAR processing
The SAR data and precise orbital data used in this study are from Sentinel-1A (Torres et al., 2012). For this study 22 scenes of Sentinel-1A single-look complex (SLC) SAR data were collected from 22 January 2017 to 20 October 2018, with an average interval of 30 d. The Interferometric Wide Swath (IW) mode is chosen. The main image is SAR data on 18 November 2017.
2.3 Field investigation and laboratory testing
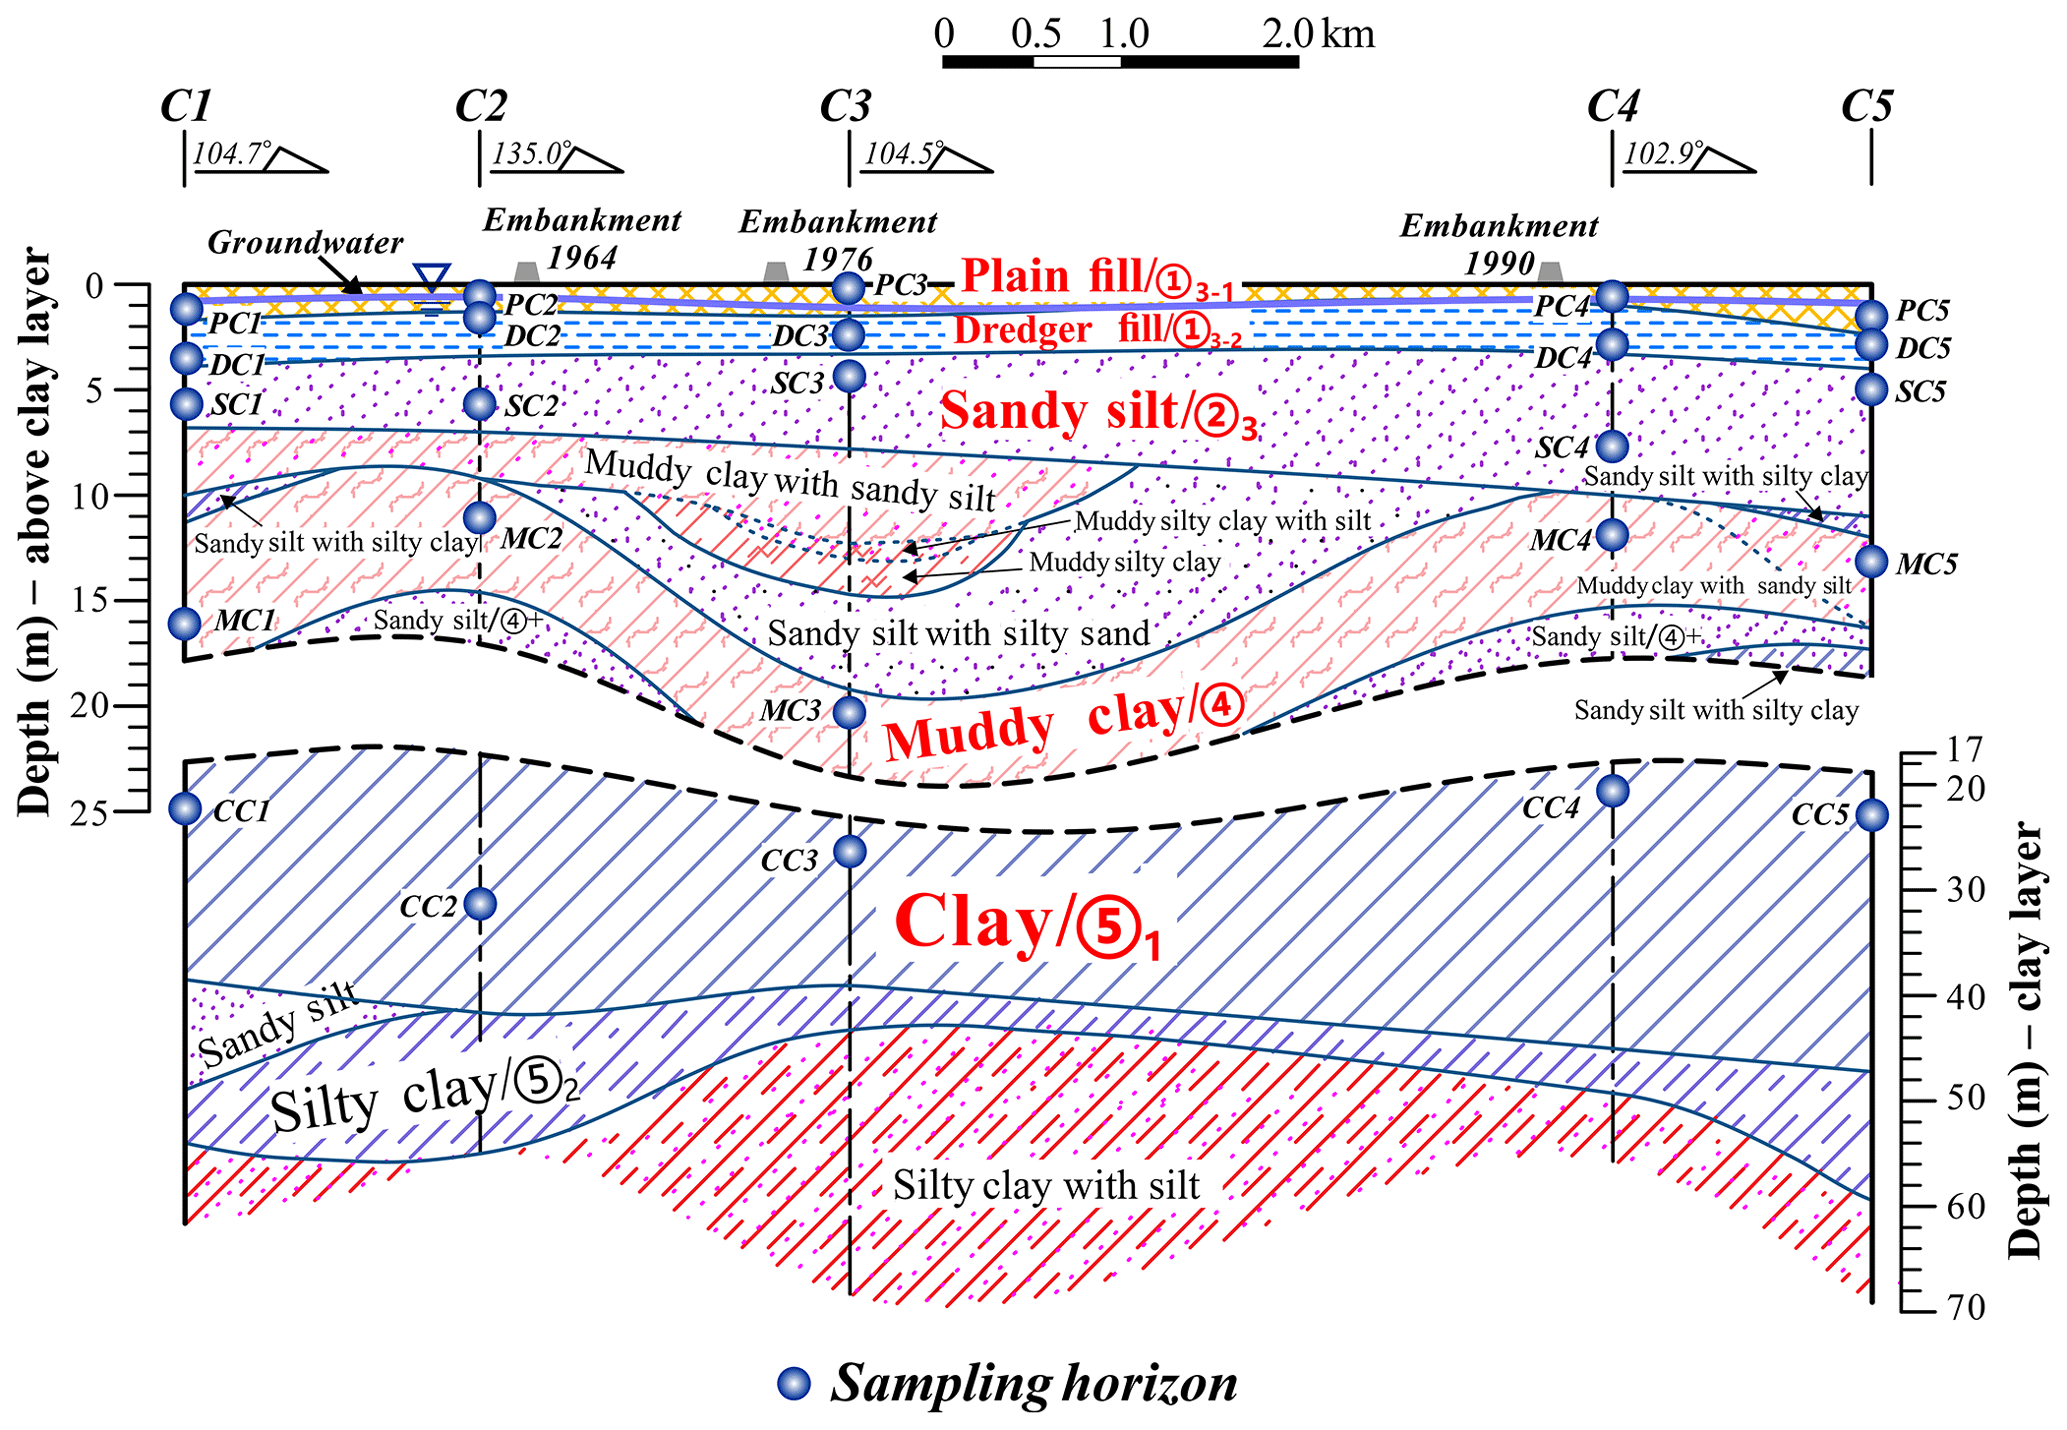
The CES, expanding from west to east (Fig. 2a), is built on multi-phases of reclamation projects with four cofferdams named by the year they were built: 1964, 1976, 1990 and 1998, respectively. The dredger filling area can be further divided into Stage 1 and Stage 2 stages with cofferdam 1976 as a boundary. Five boreholes from C1 to C5 were arranged from west to east (Fig. 2b) to investigate the stratum structure by drilling. As shown in Fig. 3, the main soil layers in can be divided from top to bottom into plain fill, dredger fill, sandy silt, muddy clay and clay. Twenty-five undisturbed soil samples are taken and marked in the form of Acronym of soil type-Drill number, such as plain filling in borehole C1 as PC1. The following geotechnical tests were carried out on the soil samples:
-
measuring natural water content by drying method;
-
measuring natural density and calculating dry bulk density by weighing method;
-
measuring cation exchange capacity by EDTA ammonium salt method;
-
rapid consolidation test: the instrument is KTG-GY fully automatic consolidation instrument. The loading grade is 0.0125, 0.025, 0.05, 0.1, 0.2, 0.4, 0.8, 1.6 and 3.2 Mpa.
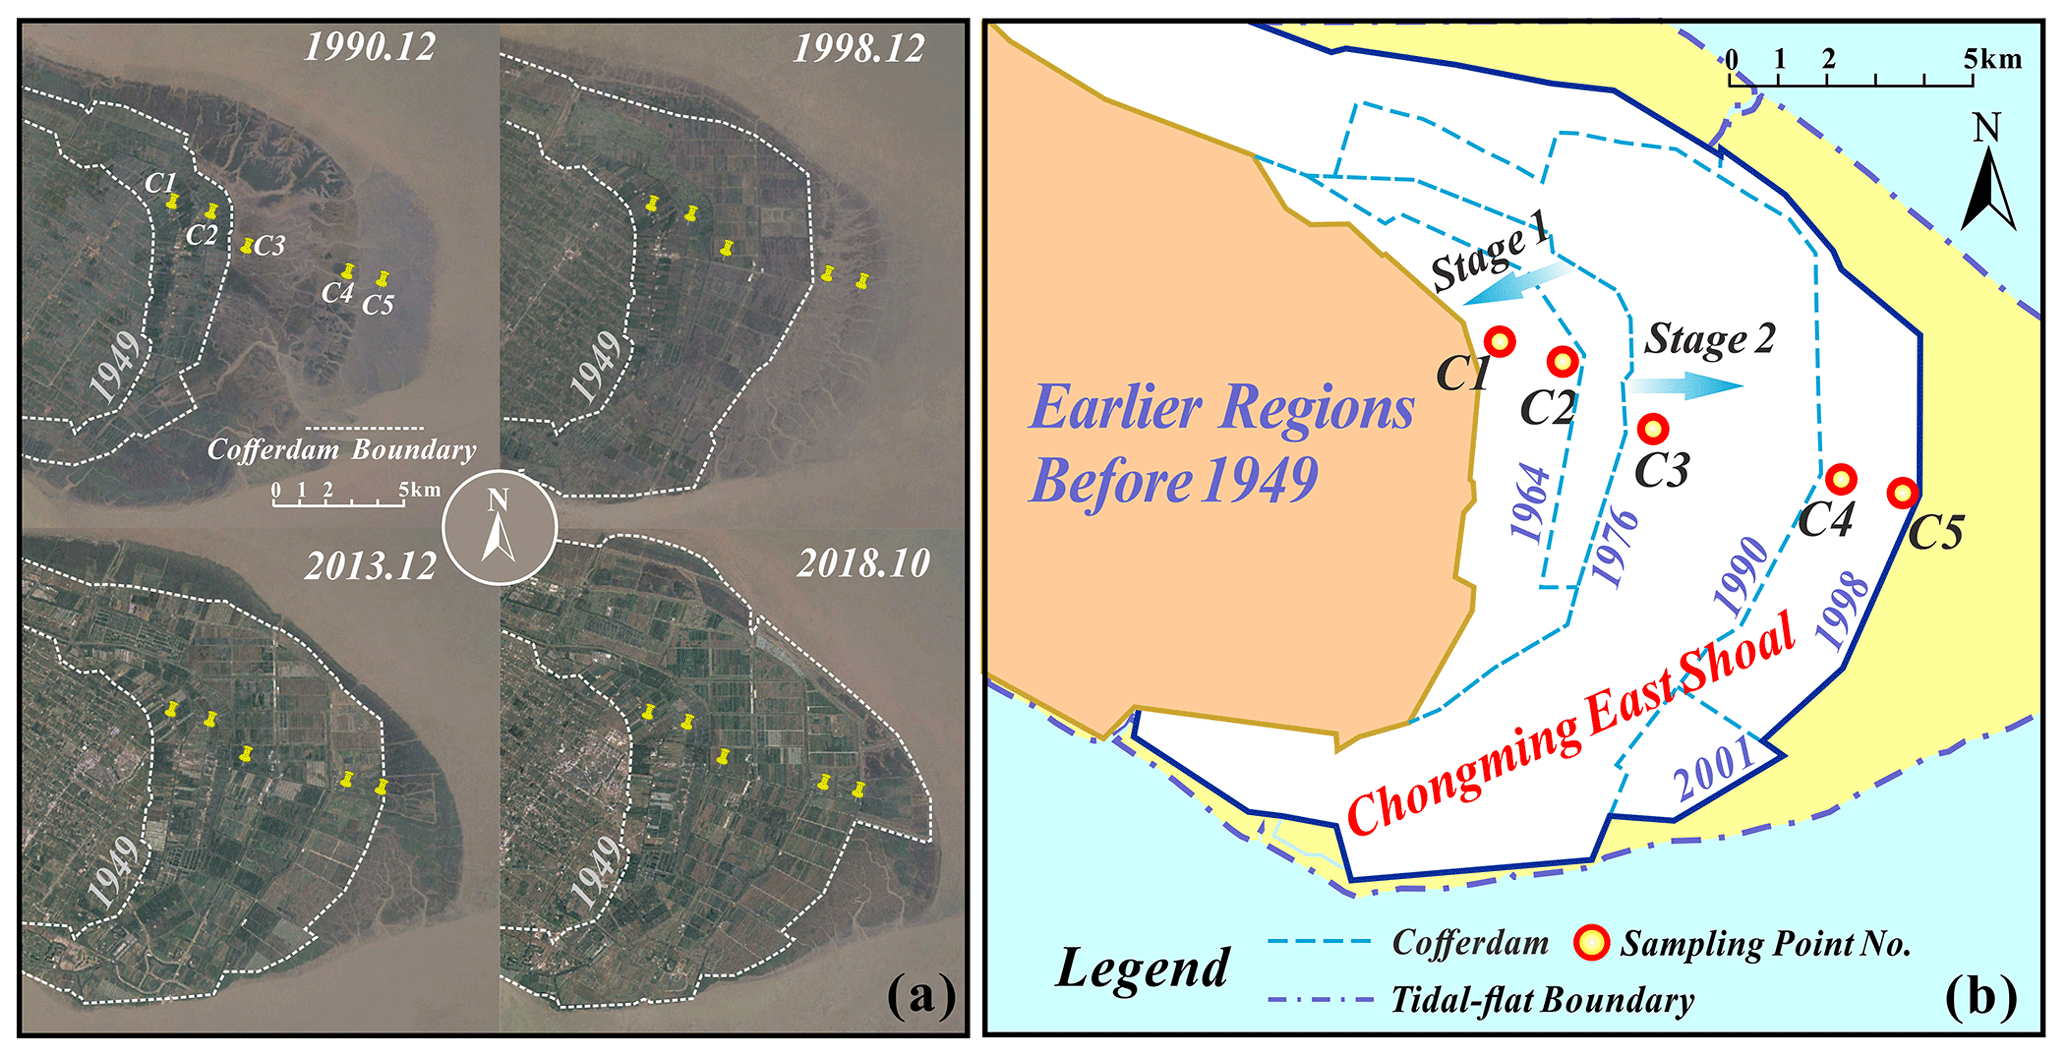
Figure 2(a) Land evolution of CES since 1990s according to historical © Google earth images; (b) drilling survey points (C1–C5).
3.1 Ground deformation characteristics
Using the SBAS-InSAR method, we obtained the maps of mean deformation velocity in the period 22 January 2017–20 October 2018 (Fig. 4). The study area can be roughly divided into three areas: A–C. The overall deformation velocity of Zone A is slow (−5 to 5 mm a−1). While the deformation velocity in Zone B is generally faster, and the fastest is −26.4 mm a−1. Zone C is located at the easternmost end, which seems to have been uplifted rather than subsided. In the process of analysis, the datum points were evenly selected in the central part of the island, which is indeed the area with the smallest overall deformation fluctuation. In the data process, SAR images cover the whole Chongming Island, so Fig. 4 only shows the location of datum points. Even so, in fact, the datum point is not stable due to deformation. Therefore, only when the settlement rate of a certain area is faster than the base point, the settlement will appear in the rate map. If the subsidence rate is slow, it may show uplift. The deformation trend is that the later the land-forming time is, the lower the settlement rate is.
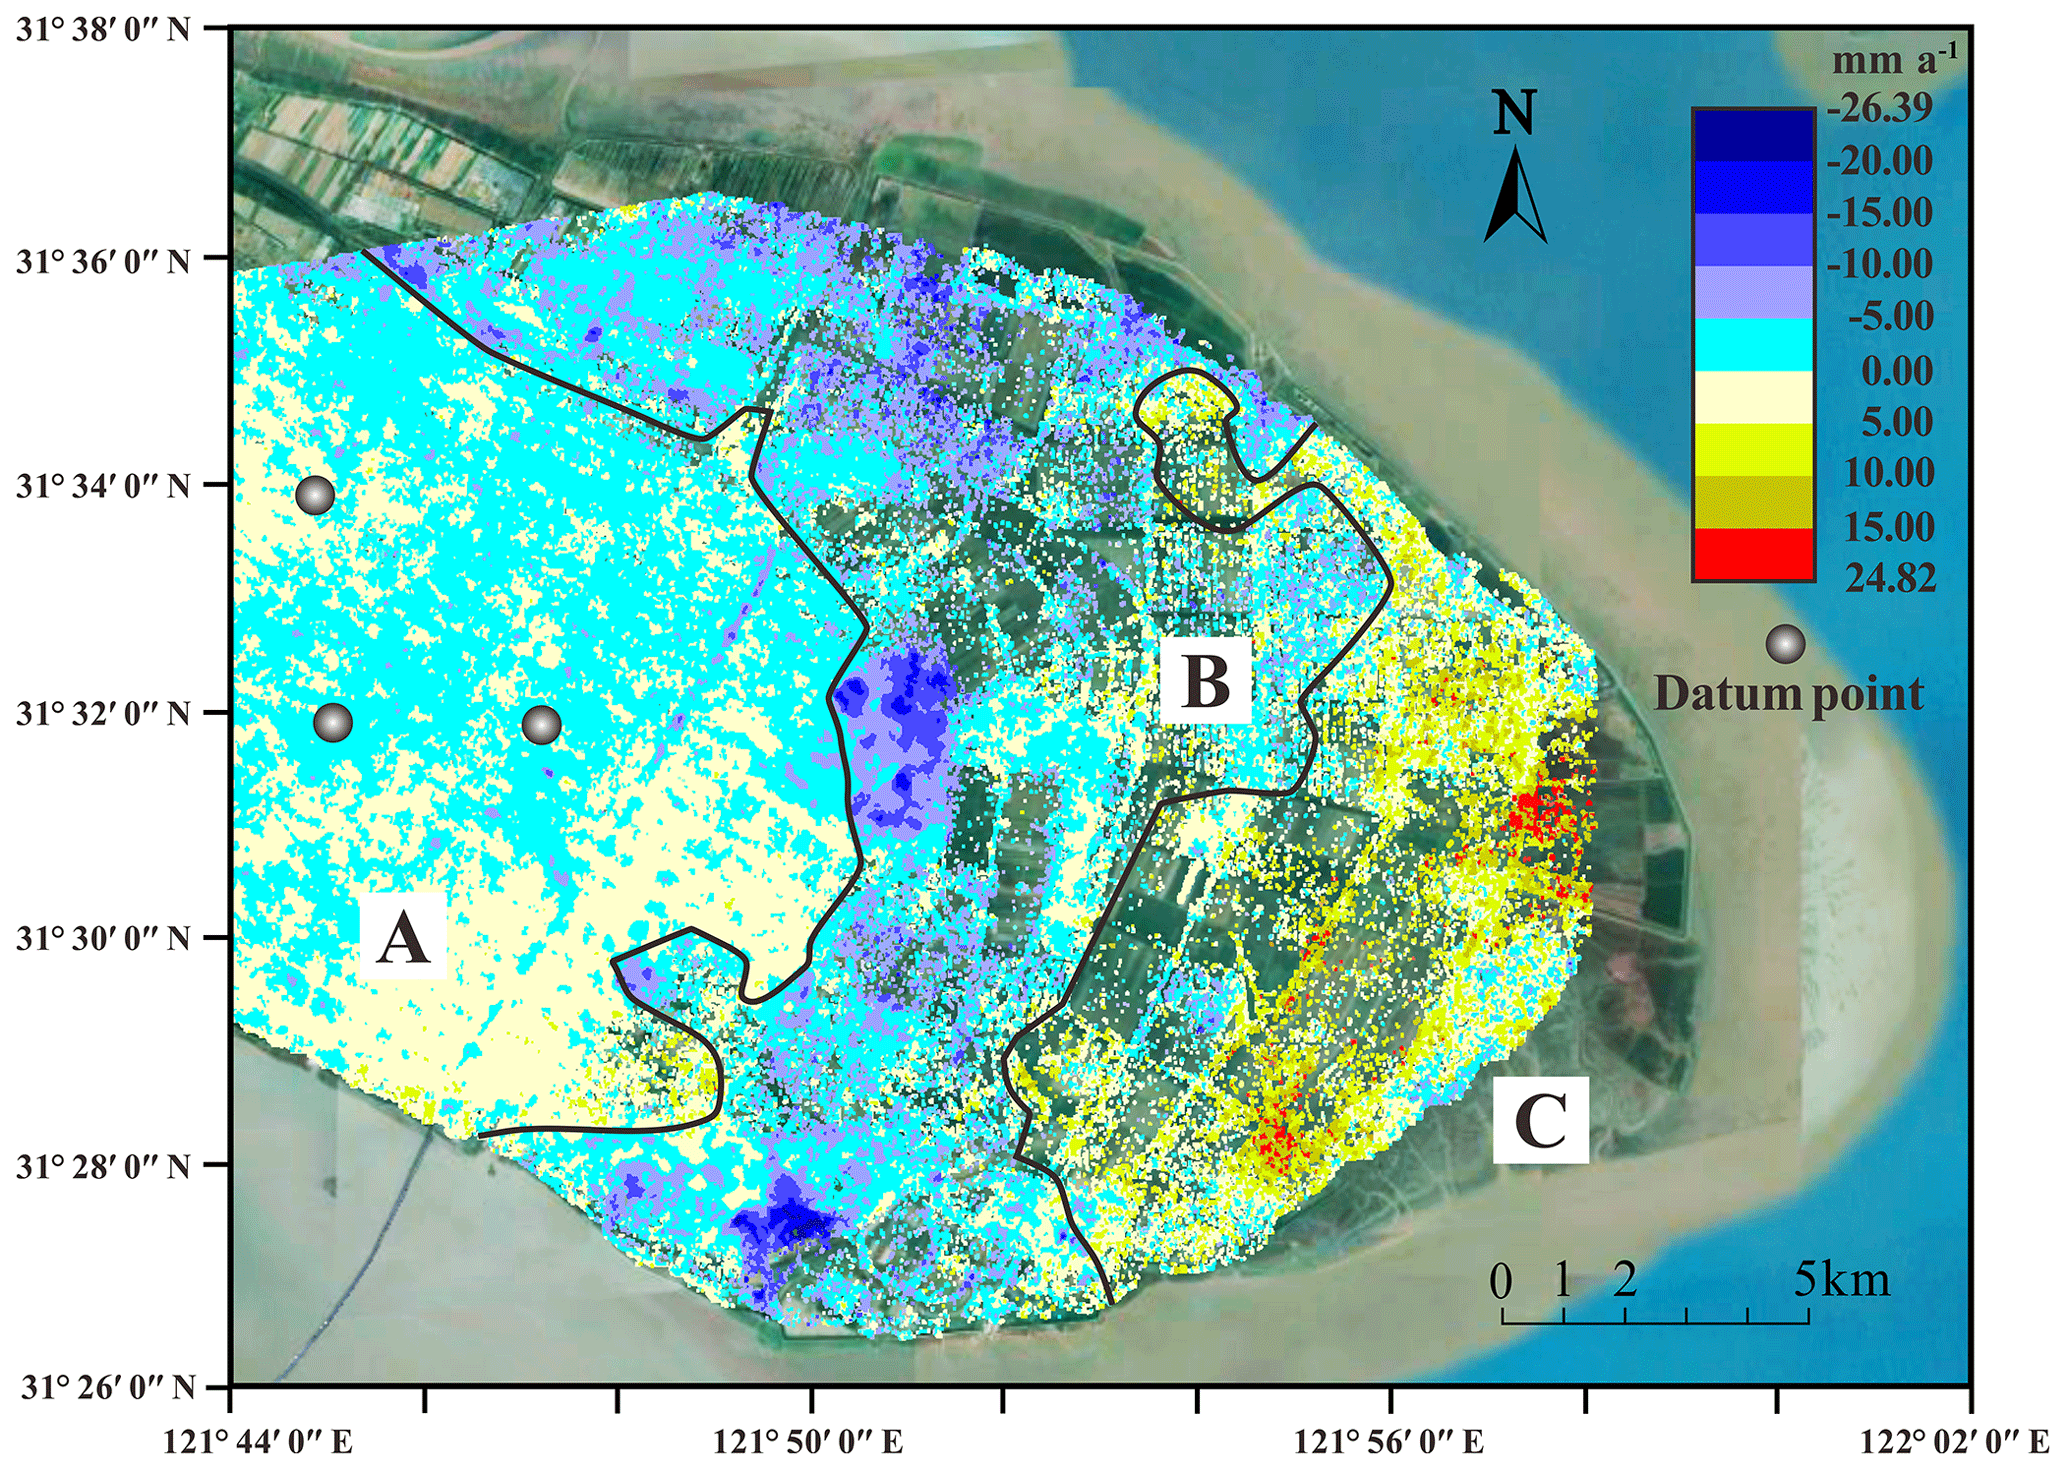
Figure 4Mean deformation velocity map superimposed on the © Google Earth image.
3.2 Geological features and mechanism
3.2.1 Basic physical properties
In this study, soils are all saturated. As shown in Fig. 5a, plain fill within stage 1 has a low water content of 30 %–35 %. But the water content of plain fills in stage 2 is suddenly increased. The surface soil of the newly formed land still has a large amount of water, which is not conducive to the drainage of underlying soil layer. The water content of dredger fill and sandy silt is the lowest (25 %–35 %), because they are both silty soil and non-cohesive soil. Under the action of pressure, water can be discharged quickly. The water content of PC1–PC3 is high and stable (40 %–45 %), while the water content is significantly reduced (30 %) for PC4 and PC5. In contrast, the clay layer is the main compression layer, its water content is the highest (42 %–54 %) and the water content continues to rise from west to east.
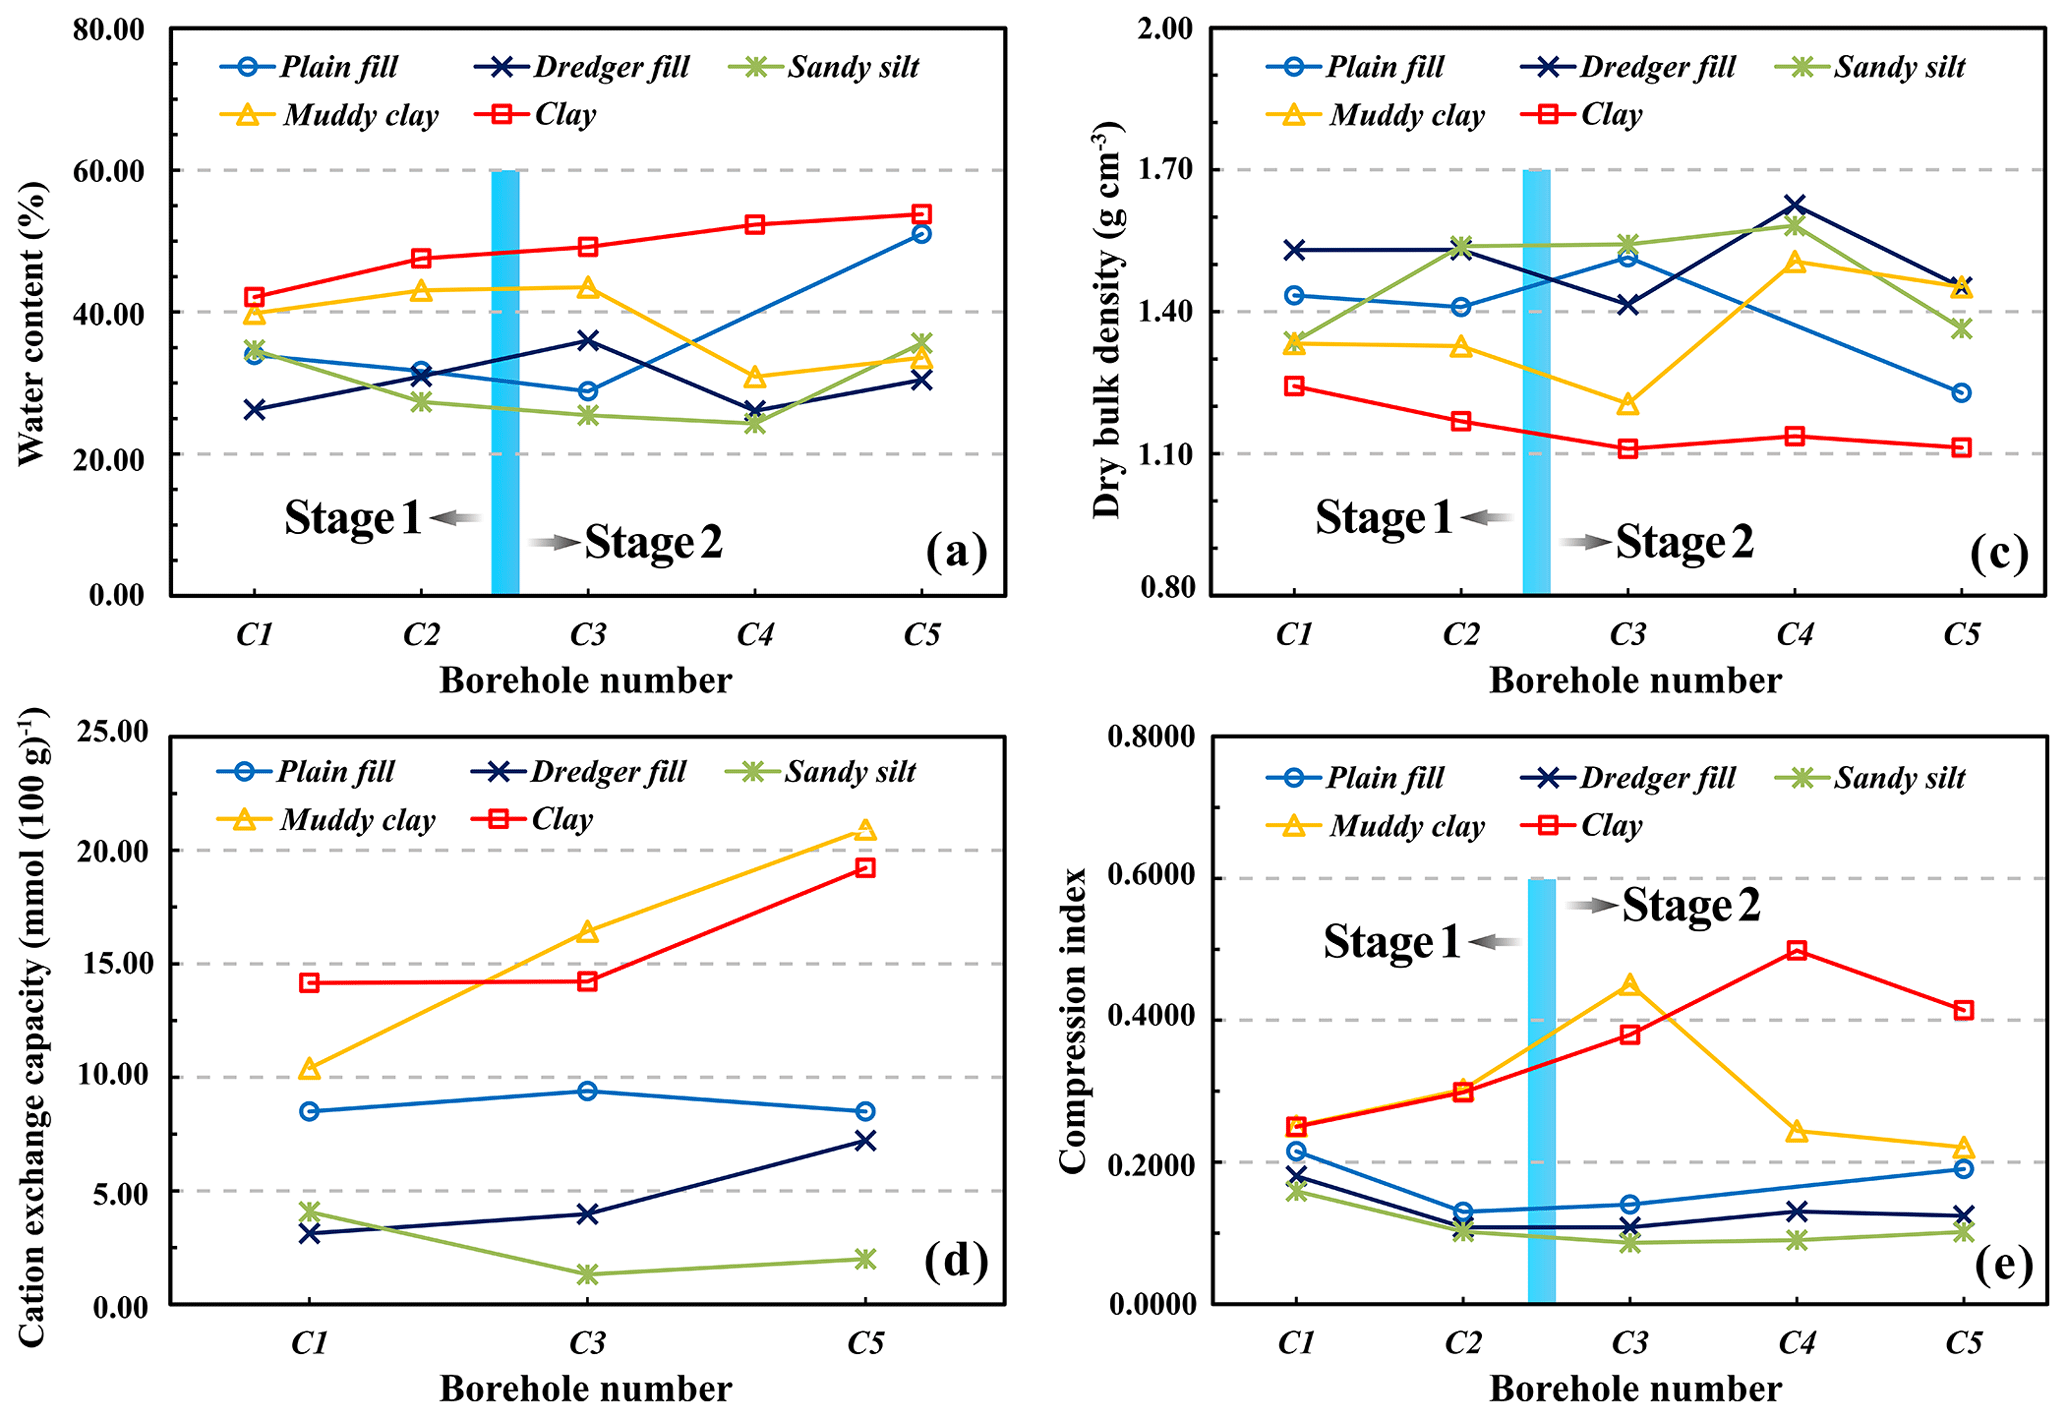
Figure 5Variation of geological features of soil in dredger fill area in different phases from west to east.
The dry bulk density indirectly reflects the structural conditions and compactness of the soil (Dexter, 1988). As shown in Fig. 5b, the dry bulk density of clay decreases continuously from west to east, indicating that the soil particles in the newly formed dredger fill area have not been fully compacted. The change of dry bulk density of dredger fill and sandy silt at different boreholes is still not large, and the arrangement is relatively dense due to coarser soil particles (>1.30 g cm−3). The dry bulk density of MC4 and MC5 is significantly higher than that of MC1–MC3. The muddy clay itself has a poor water permeability, associated with the compact arrangement of soil particles, which is not conducive to water penetration.
At the same time, comparing the curve characteristics of stage 1 and stage 2, it can be found that the curves of stage 1 are evenly distributed within the variation interval, and the curves of stage 2 are gradually dispersed, indicating that the difference in basic physical properties among the soil layers has increased. In areas where the land-forming time is shorter, the drainage is less smooth.
3.2.2 Cation exchange capacity
The C1, C3 and C5 boreholes were selected to measure the cation exchange capacity (CEC) (Fig. 5c). The CEC of plain fills is 8.50–9.39 mmol/100 g with little difference among boreholes. Although the CEC of dredger fill and sandy silt is the lowest, the CEC of dredger fills increases gradually. The CEC of muddy clay and clay increased significantly. In summary, clay and muddy clay are less likely to be compacted and consolidated in areas where land formation is started more recently, and shallow dredger fill, which is also not easy to consolidate, hinders the consolidation and compaction of underlying soil layers to a certain extent.
3.2.3 Compressibility
As shown in Fig. 5d, the compression index (CC) of each soil layer at C1 is close (0.1591–0.2509), and the gap between the compressive indices of the eastward soil layers gradually appears. The compressibility index of plain fill, dredger fill and sandy silt is generally low, but the compressibility of plain fill is increasing gradually, especially for PC5 pores. The compressibility of muddy clay increases first and then decreased, reaching the peak for MC3 of 0.4507, and the lowest for MC4 and MC5 (average 0.2326), which is consistent with the description of basic physical properties. The compressibility of the clay layer increases obviously, especially for the offshore clay layer, which has the highest compressibility and has not been effectively consolidated.
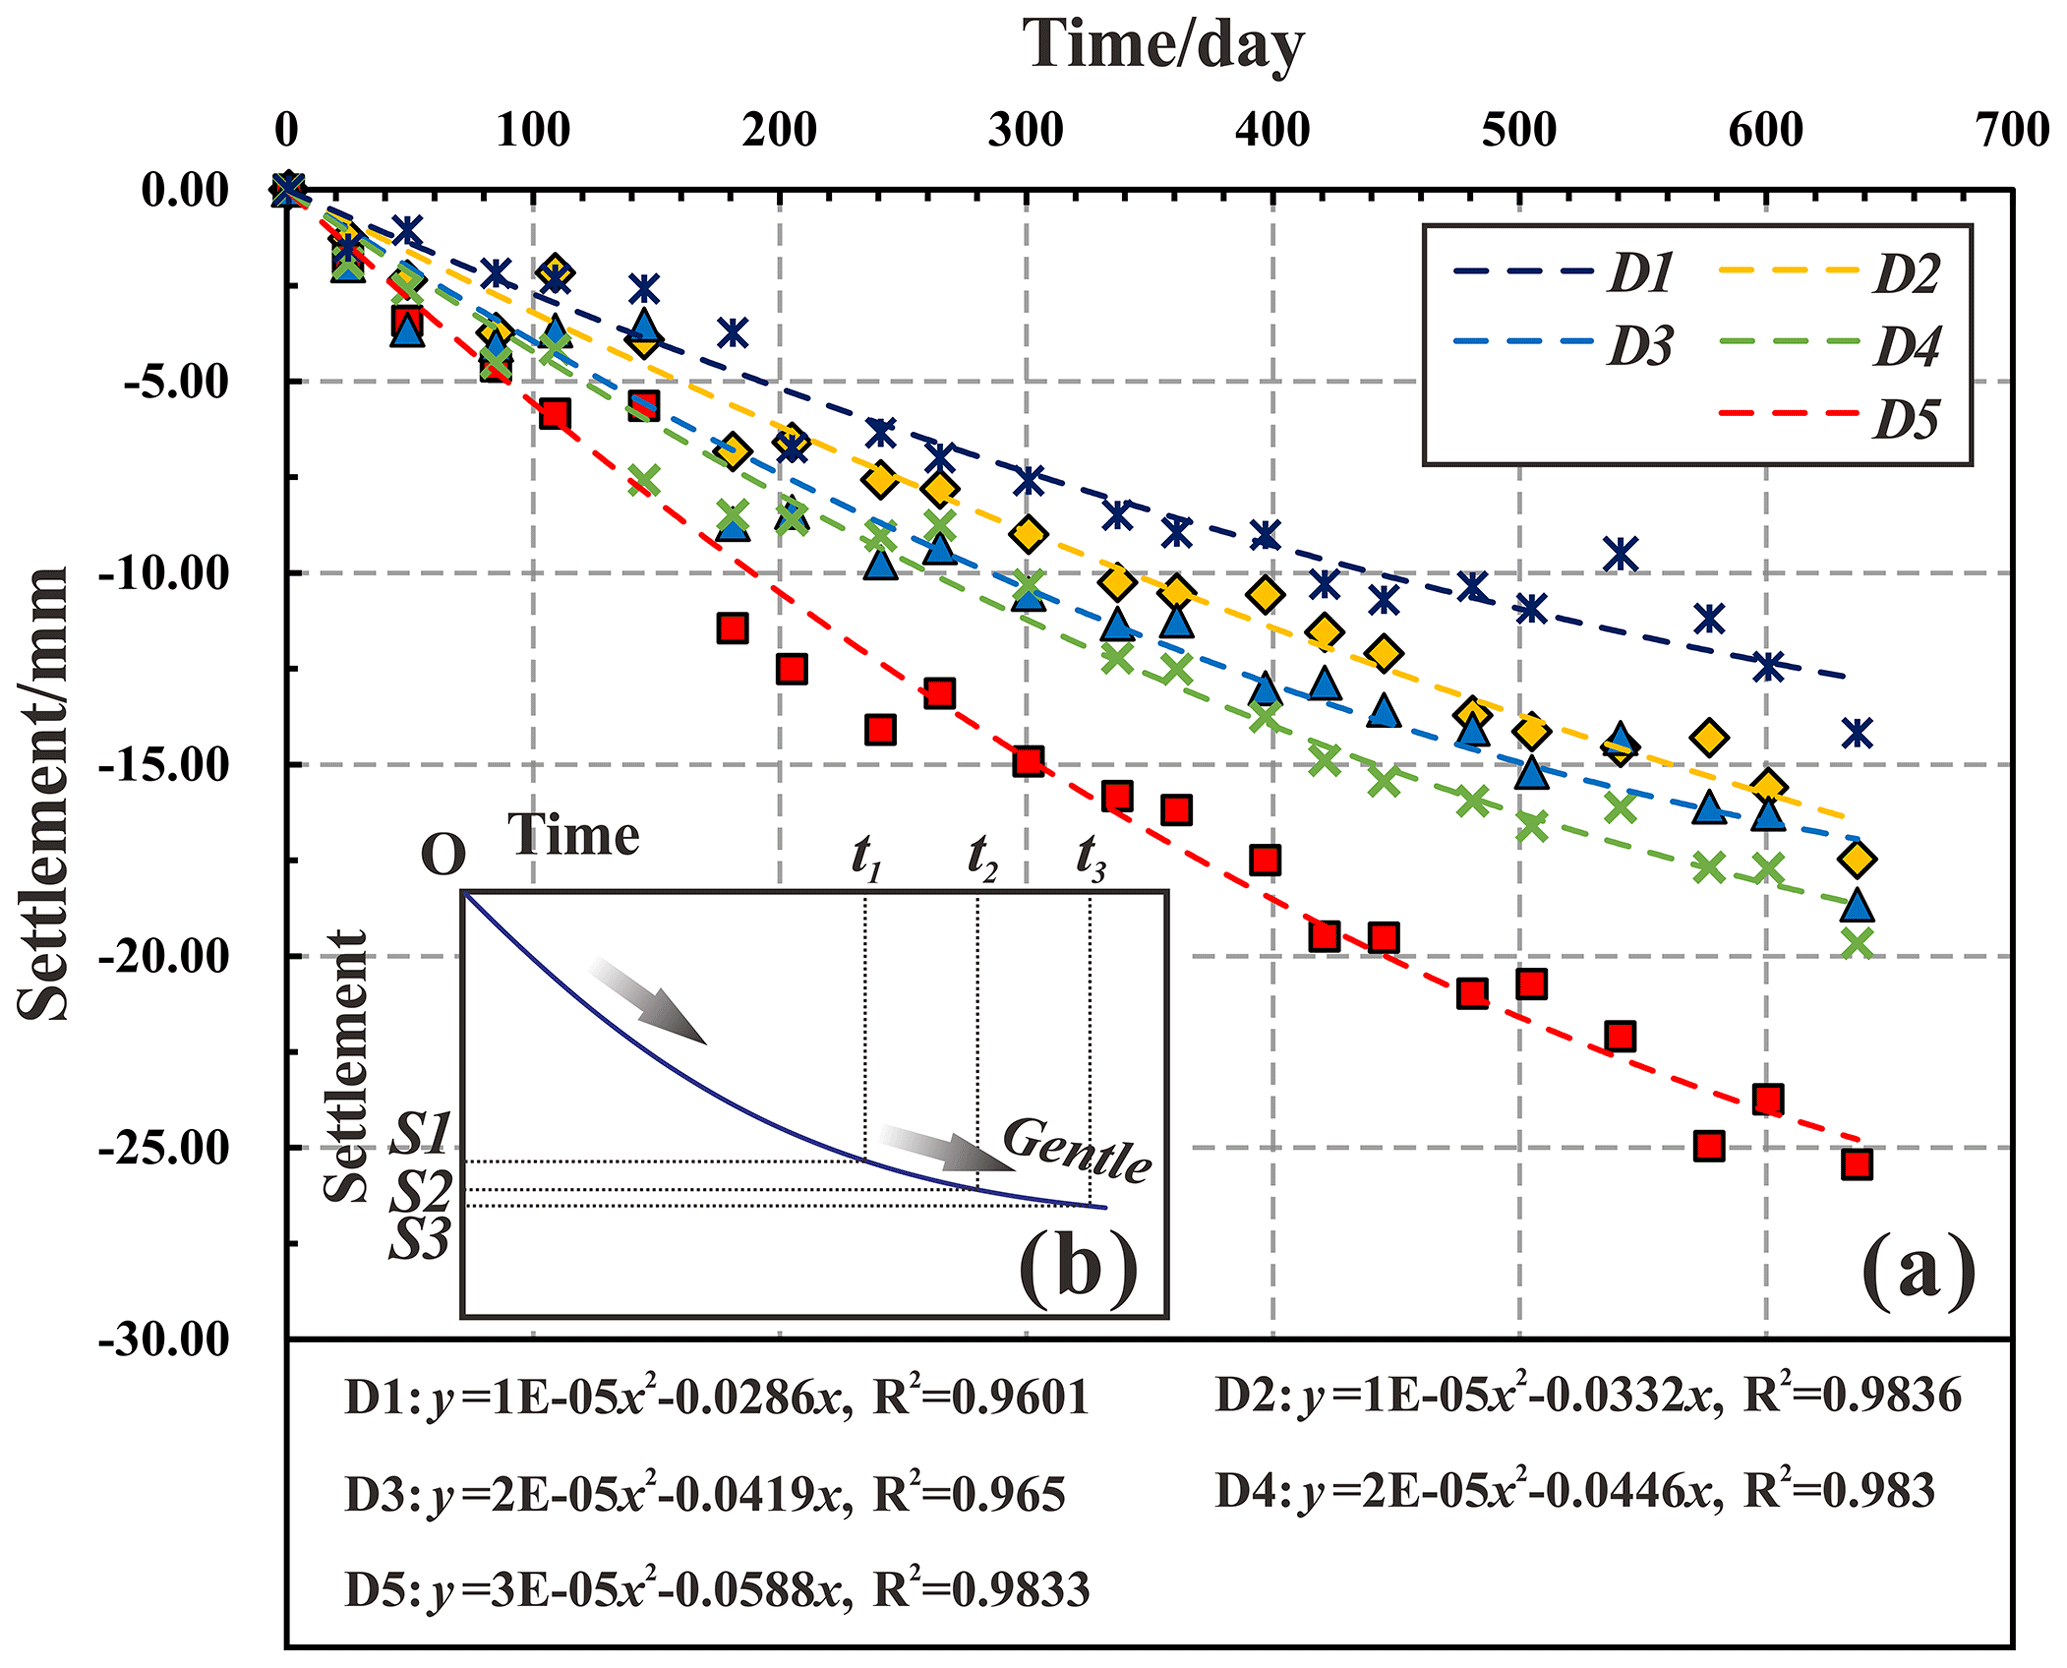
Figure 6(a) Vertical displacement time-series of the ground, as measured from February 2011 to October 2018. (b) Diagram of the Selection of (Si, ti) on Settlement-Time Curve.
3.3 Estimation of consolidation degree
At the same time, there are two areas in the study area with the fastest settlement rate (Fig. 4). The first one is Chenjia Town. The second one is a real estate development zone. The common feature is the dense buildings. In addition, there is no large amount of groundwater exploited in the study area. Therefore, the most important factor causing land subsidence is the building load. The buildings and people in Chenjia town are dense. In addition, Chenjia town is an important transportation hub of Chongming Island. Therefore, Chenjia town was selected as a representative settlement area. Five groups of representative data points were selected to obtain the time series of the deformation at selected points (Fig. 6). The soil in this area is regarded as a whole and the final settlement is calculated by using the method of exponential curve fitting (Gong, 2008). The specific process is as follows: three points (Si, ti) on the settlement–time curve, as far as possible from the settlement stabilization stage, and such that the required time interval of t2−t1 equals t3−t2 are adopted. The final settlement can be obtained as follows:
The consolidation degree can be determined as follows:
where Ui is the relative degree of consolidation; St is the measured settlement at time t; and Si∞ is the predicted final settlement. In this study, t1=460, t2=540, t3=620, t=637 d, respectively. The final settlement is −27.03 to 38.96 mm, with an average of −32.05 mm. The corresponding degree of consolidation is 42.33 %–72.19 %, with an average value of 58.95 %. Throughout the development history of Chenjia Town, since 1987, the consolidation of soil under the load of structures has only been less than 60 %, and the rate of maturity has slowed down significantly. It will take a longer time to consolidate and stabilize in the future.
In this paper, the Small Baseline Subset (SBAS) technique is used to interpret and process Sentinel-1A SAR data covering 22 scenes of Chongming East Shoal (CES), Shanghai. Combined with field investigation and laboratory testing, the main conclusions are as follows:
-
The typical feature of ground deformation in CES is differential settlement, that is, uneven spatial-temporal distribution of deformation velocity/cumulative settlement. Generally speaking, the shorter the land-forming time, the slower the subsidence velocity and the smaller the cumulative settlement.
-
Building load is an important factor causing land subsidence in the study area, and the velocity of consolidation subsidence is closely related to the engineering geological properties of the stratum itself. There are few buildings in the late land-forming area, so the external load is low, and affected by the engineering geological properties of the stratum, the water cannot be effectively discharged, so the settlement velocity is slow. Therefore, the ground deformation of CES is jointly controlled by both the building load and the stratum structure.
-
The main settlement area represented by Chenjia Town has a mean consolidation degree of only 58.95 %, and the mean final settlement is 32.05 mm. The development of land subsidence in CES is a long process. With the development and construction in the future, more and more buildings will rise on the land of CES. More attention should be paid to the prevention and research of land subsidence caused by building loads.
In this study, the following open access data sets were used: Sentinel-1A data provided by European Space Agency (ESA) through the Copernicus Open Access Hub (https://scihub.copernicus.eu/dhus/#/home, last access: 21 February 2020) with search criteria set as follows: Platform name: Sentinel-1; Filename: S1A_*; Product type: SLC; Polarization mode: VV; Sensor operational mode: IW; Relative orbit number: 171 (Copernicus Open Access Hub, Sentinel-1 user products); Precise orbital data of AUX_POEORB collected through the Sentinel-1 Quality (https://qc.sentinel1.eo.esa.int/aux_poeorb/?sentinel1__mission=S1A; last access: 21 February 2020) (Payload Data Ground Segment (PDGS), Sentinel-1 Qualit).
QY and QW contributed to the conception of the study. QY performed the data analyses and wrote the manuscript. XY, TY and XH provided significant support for project administration. MY contributed to field investigation and laboratory tests. KZ helped perform the analysis with constructive discussions. JC contributed significantly to manuscript revision.
The authors declare that they have no conflict of interest.
This article is part of the special issue “TISOLS: the Tenth International Symposium On Land Subsidence – living with subsidence”. It is a result of the Tenth International Symposium on Land Subsidence, Delft, the Netherlands, 17–21 May 2021.
We are very grateful for the data support from European Space Agency (ESA) and Sentinel-1 Quality Control. Meanwhile, we sincerely thank the editors and all anonymous reviewers for their constructive and excellent reviews that helped to improve the manuscript.
This research has been supported by the the Key Laboratory of Land Subsidence Monitoring and Prevention, Ministry of Land and Resources (grant nos. KLLSMP201801 and 2019(D)-004(F)-01) and the National Nature Science Foundation of China (grant nos. 41820104001, 41430642 and 41627801).
Berardino, P., Fornaro, G., Lanari, R., and Sansosti, E.: A new algorithm for surface deformation monitoring based on small baseline differential SAR interferograms, IEEE T. Geosci. Remote, 40, 2375–2383, https://doi.org/10.1109/TGRS.2002.803792, 2002.
Bing, X., Feng, G., Li, Z., Wang, Q., Wang, C., and Xie, R.: Coastal Subsidence Monitoring Associated with Land Reclamation Using the Point Target Based SBAS-InSAR Method: A Case Study of Shenzhen, China, Remote Sens., 8, 652, https://doi.org/10.3390/rs8080652, 2016.
Casu, F., Manzo, M., and Lanari, R.: A quantitative assessment of the SBAS algorithm performance for surface deformation retrieval from DInSAR data, Remote Sens. Environ., 102(3), 195–210, https://doi.org/10.1016/j.rse.2006.01.023, 2006.
Dexter, A. R.: Advances in characterization of soil structure, Soil Till. Res., 11, 199–238, https://doi.org/10.1016/0167-1987(88)90002-5, 1988.
Fan, H., Deng, K., Ju, C., Zhu, C., and Xue, J.: Land subsidence monitoring by D-InSAR technique, Min. Sci. Technol., 21, 869–872, 2011.
Galloway, D., Jones, D. R., and Ingebritsen, S. E.: Land subsidence in the United States, US Geological Survey Circular 1182, US Geological Survey, USA, 1–175, 2000.
Gong, X.: Handbook of Foundation Treatment, China Building Industry Press, Beijing, 2008.
Haas, J. and Ban, Y.: Urban growth and environmental impacts in Jing-Jin-Ji, the Yangtze, River Delta and the Pearl River Delta, Int. J. Appl. Earth Obs. Geoinf., 30, 42–55, https://doi.org/10.1016/j.jag.2013.12.012, 2014.
Hu, B., Wang, H.-S., Sun, Y.-L., Hou, J.-G., and Liang, J.: Long-term land subsidence monitoring of Beijing (China) using the small baseline subset (SBAS) technique, Remote Sens., 6, 3648–3661, https://doi.org/10.3390/rs6053648, 2014.
Lanari, R., Mora, O., Manunta, M., Mallorqui, J. J., Berardino, P., and Sansosti, E.: A small-baseline approach for investigating deformations on full-resolution differential SAR interferograms, IEEE T. Geosci. Remote, 42, 1377–1386, https://doi.org/10.1109/TGRS.2004.828196, 2004.
Sarychikhina, O., Glowacka, E., Mellors, R., and Vidal, F. S.: Land subsidence in the Cerro Prieto Geothermal Field, Baja California, Mexico, from 1994 to 2005. An integrated analysis of DInSAR, leveling and geological data, J. Volcanol. Geoth. Res., 204, 76–90, https://doi.org/10.1016/j.jvolgeores.2011.03.004, 2011.
Torres, R., Snoeij, P., Geudtner, D., Bibby, D., Davidson, M., Attema, E., Potin, P., Rommen, B., Floury, N., Brown, M., Traver, I. N., Deghaye, P., Duesmann, B., Rosich, B., Miranda, N., Bruno C., L'Abbate, M., Croci, R., Pietropaolo, A., Huchler, M., and Rostan, F.: GMES Sentinel-1 mission, Remote Sens. Environ., 120, 9–24, 2012.
Yuan, X.-Q., Wang, Q., Lu, W.-X., Zhang, W., Chen, H.-E., and Zhang, Y.: Indoor simulation test of step vacuum preloading for high-clay content dredger fill, Mar. Georesour. Geotechnol., 36, 83–90, https://doi.org/10.1080/1064119X.2017.1285381, 2018.