Articles | Volume 382
https://doi.org/10.5194/piahs-382-387-2020
Pre-conference publication
 | 
22 Apr 2020
Pre-conference publication |  | 22 Apr 2020

Experimental study on mechanism for pumping-induced land subsidence

Yun Zhang, Guofeng He, Jichun Wu, Zhiduo Zhu, Xuexin Yan, and Tianliang Yang
Abstract

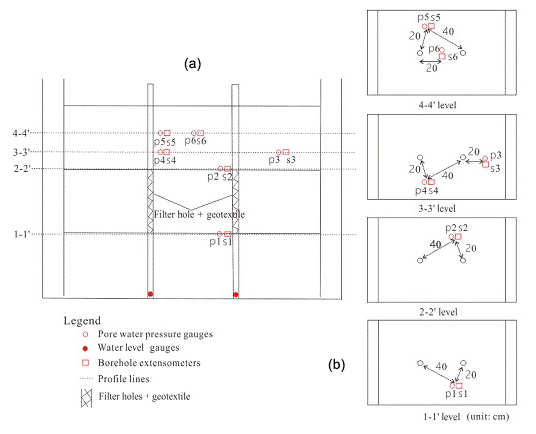
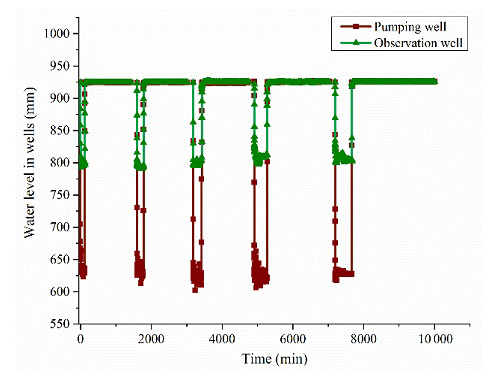
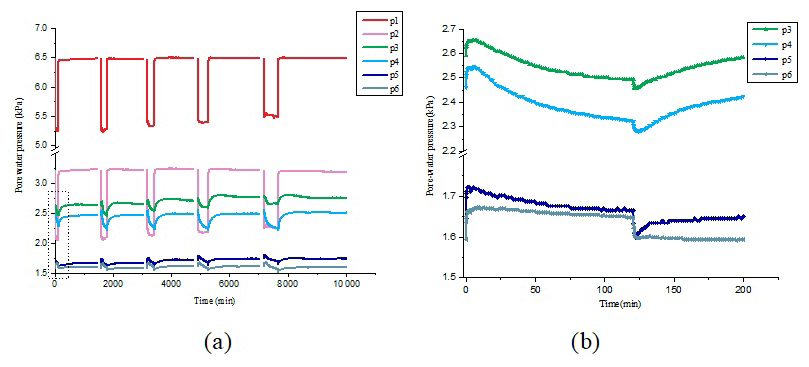
Groundwater pumping can cause severe land subsidence, yet the mechanisms have not been completely clear. A laboratory physical model test was done to investigate the mechanism for pumping-induced land subsidence. In the model test, a model well was installed and pumpage through the well was taken. During and after pumping, the soil displacement and the pore water pressure were documented. The pore water pressure within the pumped sand layer decreased immediately after pumping and recovered immediately after stopping pumping, while the pore water pressure in the neighboring silty clay layers first increased and then decreased with pumping, and first decreased and then increased after pumping was stopped and groundwater level in the sand layer recovered. The duration within which the pore water pressure in the silty clay increased when pumping was increasingly great with the distance from the pumped sand layer. The compaction of the neighboring silty clay first occurred near the interface between the silty and sand layers, and the silty clay expanded vertically within some zones. The test results indicate that the mechanism for land subsidence is complex. Due to their low permeability, aquitard units may expand in a period when groundwater is withdrawn from the neighboring aquifer units, and they may compact when groundwater is recharged into the neighboring aquifer units. This is one of the reasons for the lagging compaction of aquitard units.

1 Introduction

Severe land subsidence due to excessive groundwater withdrawal has occurred worldwide (Galloway and Burbey, 2011), resulting in loss of ground elevation and damage to infrastructures and buildings. However, the mechanism of land subsidence has not yet been comprehensively understood. Laboratory model tests were often used to do researches on the mechanisms, in which groundwater withdrawal was represented by such equivalent methods as lowering and raising the water level in sand layers (Murayama, 1969; Li et al., 2014; Lv et al., 2011; Wang et al., 2018). These methods were different from the real pumping. In order to better investigate the mechanisms of land subsidence due to pumping, a laboratory physical model test with pumping wells was constructed in this paper to really mimic groundwater pumpage.

https://www.proc-iahs.net/382/387/2020/piahs-382-387-2020-f01

Figure 1Front view of the model sketch map.

Download

https://www.proc-iahs.net/382/387/2020/piahs-382-387-2020-f02

Figure 2Model profile and embedded sensor schematic diagram (a is a cross-section through the model, and b is a plane view at different levels).

Download

2 Physical model test

2.1 Experimental set-up and materials

The model layout is presented in Fig. 1. The model box was 140 cm (long) × 100 cm (wide) × 120 cm (high). The front and rear faces of the model box were plexiglass plates, and the left and right faces and the bottom was made of steel plates. The outer frame of the box was made of steel beams. Near the left and right sides, two steel net plates were vertically installed in the box, paralleling with the sides and 10 cm from the sides, respectively. A steel wire net with a layer of geotextile on it was used to separate the water storage and the soil, preventing soil particles from going into the storage. Two vertical PVC pipes were fixed on the box bottom, and there were holes on the pipe wall within an interval. The inner diameter of the pipe was 4.5 cm. The left pipe was denoted as 1#, and the right was denoted as 2#. The two pipes were 40 cm apart. The distance of pipe 1# from the left steel net plate and pipe 2# from the right steel net plate were both 40 cm.

Soils used for the model test were fine sand and silty clay. The uniformity coefficient was 2.5 and the coefficient of curvature was 0.9 for fine sand, thus the sand was uniform. The plastic index of silty clay was 11.4. The average permeability coefficient of silty clay was 5.22×10⁻⁷ cm s−1. The permeability coefficient of the fine sand in aquifer was 1.41×10⁻³ cm s−1 according to the pumping test.

2.2 Experimental procedure

Soils were filled in the test box in layers. There were three soil layers: the bottom layer was silty clay, the middle was fine sand, and the top was silty clay. Each layer was 30 cm thick. First, the silty clay was filled, during which water was added after each 10 cm filling. After 24 h, the next layer was filled. The water level in the storages was kept constant during the testing. The pore water pressure sensors were buried together with the soil when filling. The interval with filter holes in the PVC pipes were corresponding to the sand layer. Six pore-water-pressure sensors (named p1, p2, p3, p4, p5 and p6, respectively) and six displacement transducers (named s1, s2, s3, s4, s5 and s6, respectively) were set at different depth. The pore-water-pressure sensors were paired with the displacement monitoring points, and their specific layout is shown in Fig. 2. P1 and s1 were located at the bottom of the sand layer, p2 and s2 were at the top of the sand layer, and the rest (p3–p6, s3–s6) were all located within the upper silty clay layer.

Water was first pumped from a pipe (1#) for 120 min, then the pumping was stopped and the water level in the pipe and the observation well (2#) recovered and gradually reached a stable level. In the meantime, pore water pressure and vertical displacement changed and finally reached stable values. This procedure was then repeated. The pumpage was approximately 1850 mL min−1 in order that the change of water level in the pipe was clear but the water level was higher than the top surface of the sand layer. The interval between two times of pumping was at least 24 h. The pumping time for the second to the fifth cycles were 180, 240, 360, and 480 min, respectively.

https://www.proc-iahs.net/382/387/2020/piahs-382-387-2020-f03

Figure 3Diagram of water level in wells during intermittent pumping test.

Download

https://www.proc-iahs.net/382/387/2020/piahs-382-387-2020-f04

Figure 4Pore water pressure of intermittent pumping. (a) Change of the pore water pressure. (b) Change of the pore water pressure in the first 20 min.

Download

3 Experimental results and analyses

Figure 3 shows the water level in the pumped and the observation wells. When pumping time increases from 120 to 240 min, the lowest water level in pumping well and observation well declines, but when the pumping is 360 or 480 min, the lowest water level is almost the same as that for 240 min pumping time. Additionally, water level in the pumping and observation wells can fully recover within the non-pumping interval. Figure 4 indicates the change of the pore water pressure at p1 to p6. Figure 4b is the enlargement of the first 20 min in Fig. 4a for the points of p3–p6. The figures clearly show that the pore water pressure at various points changes differently. At points p1 and p2, the pore water pressure decreases immediately when pumping, and increases rapidly and recovers to the initial value in a very short time when pumping stops. At points p3–p6, however, the pore water pressure does not decrease but increases in the early stages of pumping, and then gradually decreases after 7–13 min. In the early stages of non-pumping, it does not increase but decreases, but this is followed by an increase towards a stable pressure level which is slightly higher than the initial pressure level.

https://www.proc-iahs.net/382/387/2020/piahs-382-387-2020-f05

Figure 5Cumulative vertical displacement of intermittent pumping.

Download

Figure 5 shows the history of the vertical displacement at the points s1–s6. The vertical displacement at points s1–s6 changes periodically corresponding to the intermittent pumping, and it is the smallest at s1 and the greatest at s4. The vertical displacement of s1 represents the compaction of the lower silty clay layer at it. It increases and almost has no rebound, indicating that the clay layer at the bottom of the sand layer has only plastic deformation. The vertical displacement of s2 is greater than that of s1 when pumping, while the final vertical displacement of s1 and s2 is almost the same after pumping is stopped. The vertical displacement of s3–s6 in the clay layer is greater than that of s1 and s2. From Fig. 5, it is found that the vertical displacement of s4 is greater than that of s5, meaning that the interval between s4 and s5 expands. The vertical displacement of s3 is smaller than that of s4 because s3 is far from the pumped well. On the other hand, the upper clay layer is mainly plastic deformation, and most of the rebound is from the sand layer. The compaction of the neighboring silty clay first occurred near the interface between the silty and sand layers, and the silty clay expanded vertically within some zones.

4 Conclusions
  1. Under the condition of intermittent pumping, the vertical displacement of the sand layer is smaller than that of the clay layer. The sand layer mainly exhibits elastic deformation with only a little plastic deformation, while the clay layer has mainly plastic deformation.

  2. In the sand layer, the pore water pressure decreases when pumping and increases after pumping is stopped. In the clay layer, pore water pressure first increases rapidly and then decreases when pumping, and it decreases rapidly and then increases after pumping is stopped.

  3. The upper clay layer close to the pumped sand layer has a larger vertical displacement and that far from the pumped sand layer has a smaller one, thus expansion occurs in the upper clay layer.

Data availability

The experimental data have been directly been indicated in the figures in this paper and can be assessed from the them.

Author contributions

YZ set up the experimental equipment, analyzed the test results and prepared the manuscript. GH supported the experimental set-up and conducted the test. JW provided a guidance to the experimental set-up. ZZ provided a guidance to the experimental procedure. XY and TY supported the experimental materials and provided a guidance to the experiment.

Competing interests

The authors declare that they have no conflict of interest.

Special issue statement

This article is part of the special issue “TISOLS: the Tenth International Symposium On Land Subsidence – living with subsidence”. It is a result of the Tenth International Symposium on Land Subsidence, Delft, the Netherlands, 17–21 May 2021.

Acknowledgements

The authors gratefully appreciate the constructive comments of the reviewers, which are very helpful to the improvement of this manuscript.

Financial support

This research has been supported by the National Natural Science Funds of China (grant no. 41572250) and the Key Laboratory of Land Subsidence Monitoring and Prevention, Ministry of Land and Resources (grant no. KLLSMP201802).

References

Galloway, D. L. and Burbey, T. J.: Review: regional land subsidence accompanying groundwater extraction, Hydrogeol. J., 19, 1459–1486, https://doi.org/10.1007/s10040-011-0775-5, 2011. 

Li, Y., Hu, Z., Weng, T., Fonseca, J., and Zhang, X.: Experimental study on the vertical deformation of sand caused by cyclic withdrawal and recharging of groundwater, Eng. Geol., 183, 247–253, https://doi.org/10.1016/j.enggeo.2014.08.020, 2014. 

Lv, W. H., Miao, L. C., and Li, C. L.: Physical model test of land subsidence caused by groundwater withdrawal, in: Geo-Frontiers 2011: Advances in Geotechnical Engineering, edited by: Han, J. and Alzamora, D. E., American Society of Civil Engineers (ASCE), Texas, USA, 1623–1630, https://doi.org/10.1061/41165(397)166, 2011. 

Murayama, S.: Model experiments on land subsidence, in: Land Subsidence: Proceedings of the Tokyo Symposium, edited by: IASH, International Association of Scientific Hydrology Publications 88–89, Vol. 2, Tokyo, Japan, 431–439, 1969. 

Wang, J. X., Deng, Y. S., Ma, R. Q., Liu, X. T., Guo, Q. F., Liu, S. T., Shao, Y. L., Wu, L. B., Zhou, J., Yang, T. L., Wang, H. M., and Huang, X. L.: Model test on partial expansion in stratified subsidence during foundation pit dewatering, J. Hydrol., 557, 489–508, https://doi.org/10.1016/j.jhydrol.2017.12.046, 2018. 

Download
Short summary
Groundwater pumping can cause severe land subsidence and decrease ground surface level. A physical model test were conducted to mimic this process. An interesting phenomenon is that, due to their low permeability, aquitard units may expand in a period when groundwater is withdrawn from the neighboring aquifer units, and they may compact when groundwater is recharged into the neighbor aquifer units.