the Creative Commons Attribution 4.0 License.
the Creative Commons Attribution 4.0 License.
 | 22 Apr 2020
Spatial variation of three-dimensional deformation: a case study in the north-eastern Beijing plain, China
Jiahui Zhou
Huili Gong
Huijun Li
Liping Zheng
Rui Cheng
Hanrui Sun
Land subsidence is a serious geo-hazard in Beijing Plain, which has threatened the safety of the operation of the metropolis. This study focuses on the land subsidence in the Chaobai River alluvial fan, where is the main groundwater supply region. The vertical and the East-West deformation from June 2015 to December 2017 was derived based on the SAR imaging geometry deduction. Then, the spatial variation characteristics of the deformation were analysed and the relations with the impact factors were carried out. Results show that the nugget effect (i.e., random to total spatial variance ratio) values of the vertical and the East-West deformation at regional scale were 13 % and 49 %, respectively. This indicates that the distribution of the vertical deformation is dominated by regional influencing factors, while both regional and local-scale impact factors are important for the distribution of the East–West deformation. In the southern part of the study area, the extraction of groundwater is the dominant factor affecting the spatial distribution of the vertical displacement, while the dominant factor of East-West deformation is not obvious. This study can enrich the understanding of land subsidence distribution and will help us better understand the causes of land subsidence.


Groundwater is an important source of urban water supply for Beijing, which had a population of 21.71 million in 2017. With the development of urbanization, the demand for water resources become larger. Long-term of over-exploitation groundwater induced significant subsidence since 1950s.
For the land subsidence geohazard in Beijing, many researchers have studied the formation mechanism over the last few years and qualitative description of the spatial distribution characteristics of land subsidence (Gong et al., 2009; Ng et al., 2012; Zhu et al., 2015; Chen et al., 2016, 2017). Researches have shown that groundwater level, the geology background including the thickness of the compressible layer and aquifer structure have a strong relationship with the land subsidence. Guo et al. (2019) worked on the temporal mutation of land subsidence through the Mann–Kendall method, which is a nonparametric statistical method to evaluate the trend changes of time series. She found that about 50 % of the grids mutated in 2015, the main reason is the implement of the “South-to-North Water Transfer Middle Line” project, which diverted 703 million cubic meters of water to Beijing from 2014 to 2015. Currently, the spatial distribution of land subsidence is described from the qualitative perspective. There is less study on quantitative description of land subsidence distribution, which is the base for land subsidence control and early warning.
The paper aims to quantitatively describe the spatial variation characteristics of the deformation in vertical and horizontal directions by geographical semi-variogram analysis and explore the correlations between land subsidence and its impact factors including the thickness of compressible layers and the change of the groundwater level in confined aquifers using statistical methods. The upper and middle of Chaobai alluvial fan, where the location of the first large emergency groundwater resource region (EGRR) for Beijing Municipal, is taken as a case study. This study can enrich the understanding of land subsidence distribution and can provide scientific evidence for land subsidence prevention and control.
The study area is the upper–middle part of Chaobai River alluvial fan in the north-eastern Beijing plain (40–40∘30′ N, 116∘30′–117∘ E), with a total area of 1350 km2 (Fig. 1). The mean elevation is about 35 m above the sea level, with an average slope equal to 2.1 %. The mean annual precipitation is 517 mm from 2000 to 2010 and 80 % of the total annual precipitation concentrated from June to September.
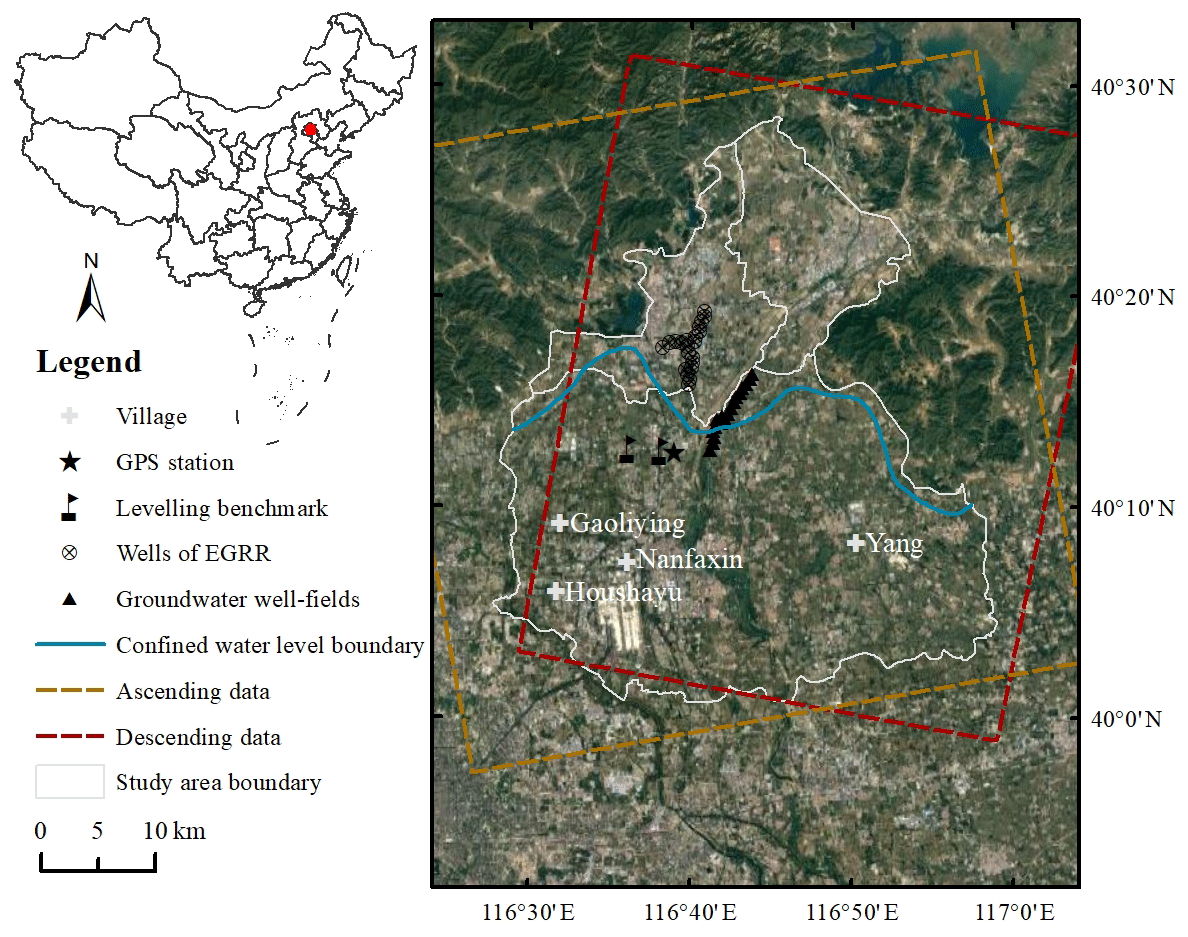
Figure 1Location of the study area. Background image of the optical remotely sensed image from © Google Earth.
3.1 Data Set
In this study, Sentinel-1 satellite data of different LOS (line of sight) directions were selected, including a total of 50 ascending data from December 2014 to December 2017, and a total of 22 descending data from June 2015 to January 2018. The incident angles of ascending and descending data are 33.6 and 33.9∘, and the orbit azimuth angles are 346.4 and 193.5∘, respectively.
The thickness of the compressible layers in the northern area is generally thinner than that in the southwestern area and the highest thickness of the compressible layers up to 220 m.
The piezometric change in the confined aquifers from 2015 to 2017 was obtained through groundwater contour lines in December 2014 and December 2017. In the southwest and southeast of the study area, groundwater extraction from confined aquifers is heavily and the groundwater level decreased with values ranging from 2 to 3 m and more than 3 m, respectively. In the middle part of the study area, the groundwater level has risen 0 to 4 m.
3.2 Deriving 3-D Deformation Components
PS-InSAR (Persistent Scatterer Interferometric Synthetic Aperture Radar) is a widely used technology to detect ground displacement by selecting phase-stabilized point targets, such as buildings and exposed rocks. The displacement information is obtained by removing other phase components in the interference phase. In this study, the LOS deformation is obtained by PS-InSAR. By the SAR imaging geometry and the relationship between the LOS deformation and the vertical, the North-South and the East-West deformation components, the InSAR LOS deformation can be expressed as (Polcari et al., 2016)
Where Dlos is the LOS deformation; Dv, Dn, De are the vertical, the North–South, the East–West deformation components respectively; θ is the radar incidence angle and φ is the orbit azimuth angle.
To obtain the 3-D deformation components, it is necessary to exploit at least three-track InSAR LOS measurements. The SAR satellites fly generally along the polar orbits, and the angle with the meridian is generally about 10∘, so the sensitivity to the North-South deformation component is the lowest and the accuracy of the derived North–South deformation is low. Therefore, this study assumes that there is no North–South deformation in the study area. The LOS deformation is considered to be synthesized by the vertical and East-West deformation vectors.
According to Eq. (2), the two-track InSAR measurements are used to obtain the vertical and East-West deformation through the least square method.
3.3 Geographical Semi-Variogram Analysis
The geographical semi-variogram model is a geostatistical analysis method and is the most common measure to reveal the spatial distribution, variation, and characteristics of a regionalized variable. It is used here to analyse the spatial variability of the deformation. The discrete deformation rates variation values are obtained by Eq. (3), and the discrete values are fitted by the fitting model (Júnior et al., 2006). Commonly used fitting models include exponential, spherical, gaussian, and the linear model. Then the largest Coefficient of Determination (R2) and the smallest Residual Sum of Squares (RSS) are used to determine the best model.
where Z(X) is the regionalized variable; h is the spatial separation distance between the two samples; Z(Xi) and Z(Xi+h) are the values of Z at the locations of Xi and Xi+h, respectively; N(h) is the number of pair points separated by a distance h.
Three major parameters, nugget, partial sill, and sill are used to quantify the spatial variability. The nugget parameter (C0) represents the random spatial variance of the deformation. The partial sill parameter (C) represents the structural spatial variance of the deformation and the sill parameter (C0+C) represents the total degree of spatial variation. The nugget effect (the ratio of C0 to C0+C) indicates whether regional or local-scale factors are more important for land subsidence distribution. The value of the nugget effect ranges from 0 % to 100 %. According to the properties of the geographical semi-variogram model, If the nugget effect value is less than 25 %, regional-scale impact factors are more important for the land subsidence distribution. On the contrary, if the ratio is greater than 75 %, the local-scale impact factors are more important. If the ratio is between 25 % and 75 %, both regional and local-scale impact factors are important. However, the nugget effect cannot identify the sources affecting land subsidence distribution (Song et al., 2018).
3.4 Geographical Detector Model
The Geographical Detector model is a statistical analysis method to reveal the driving factors behind spatial stratified heterogeneity, which was first proposed by Wang et al. (2010). The core idea is based on the assumption that if an independent variable has an important influence on a dependent variable, the spatial distribution of the independent variable and the dependent variable should be similar. The advantage of the geographical detector model is that it can overcome the limitation of traditional statistical analysis methods in dealing with category variables.
The Factor detector belongs to geographical detector model, which can quantify the influences of the independent variable on the dependent variable, measured by q value. The q value is within the range between 0 and 1. The larger the value of q, the greater the influences of the independent variable on the dependent variable, and the weaker the opposite.
where is the category of the independent variable; Nh and N are the number of samples in category h and the total samples over the whole study region, respectively; and σ2 are the variance of the dependent variable of category h and the variance of the entire area respectively.
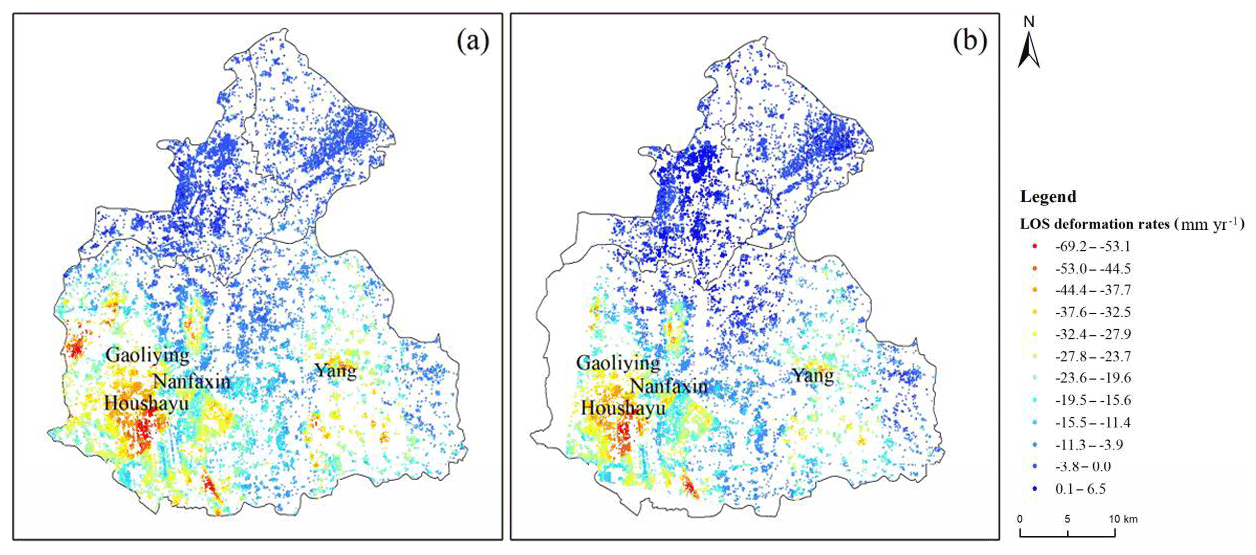
Figure 2Deformation rates along LOS derived from (a) ascending data (December 2014 to December 2017) and (b) descending data (June 2015 to January 2018).
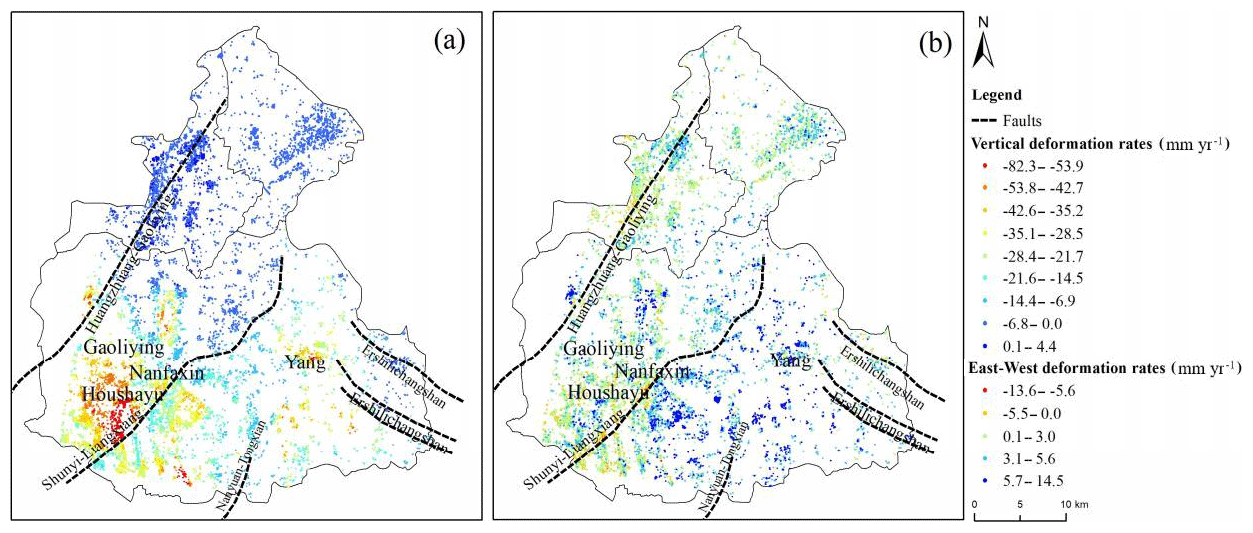
Figure 3(a) the vertical deformation rates and (b) the East-West deformation rates (June 2015 to December 2017).
4.1 InSAR-Derived 3-D Deformation and Validation
Figure 2a and b show the results of deformation along LOS for ascending and descending data, respectively. The land subsidence rate of the two-track covering the same period, which from June 2015 to December 2017, was selected to derive the vertical (Fig. 3a) and East-West (Fig. 3b) deformation.
The deformation rates along LOS of the two-track are almost the same, and the distribution is also consistent. The deformation rates in the study area show obvious heterogeneity, with values in the southern area larger than those in the northern. The vertical deformation rates are consistent with the distribution trend of the LOS direction and the largest deformation rate up to −82.3 mm yr−1. On the whole, The East–West deformation rate is small with values ranging from −13.6 to 14.5 mm yr−1.
To evaluate the quality of the InSAR derived land subsidence rate map, the vertical deformation rates, and the East–West deformation rates are compared with levelling benchmarks and GPS measurement, respectively. The average deformation rates of radar targets located at a distance less than 200 m from the monitor station were used to validate the SAR outcomes. The mean absolute difference (MD) and the root mean square (RMS) of the vertical deformation rates are 2.6 and 2.6 mm yr−1, respectively. For the East-West deformation rates, the difference between GPS measurement and InSAR results is 5.6 mm yr−1. Although based on the assumption that there is no North–South movement, the derived vertical and East–West deformation rates are in good agreement with the ground-based measurements. The North–South deformation is negligible.
4.2 Spatial Variability of Deformation
This study quantitatively analyses the spatial variability of displacement rates from the perspective of isotropic. The semi-variograms of the displacement rates are fitted by the exponential model and plotted in Fig. 4 and the details are shown in Table 1.
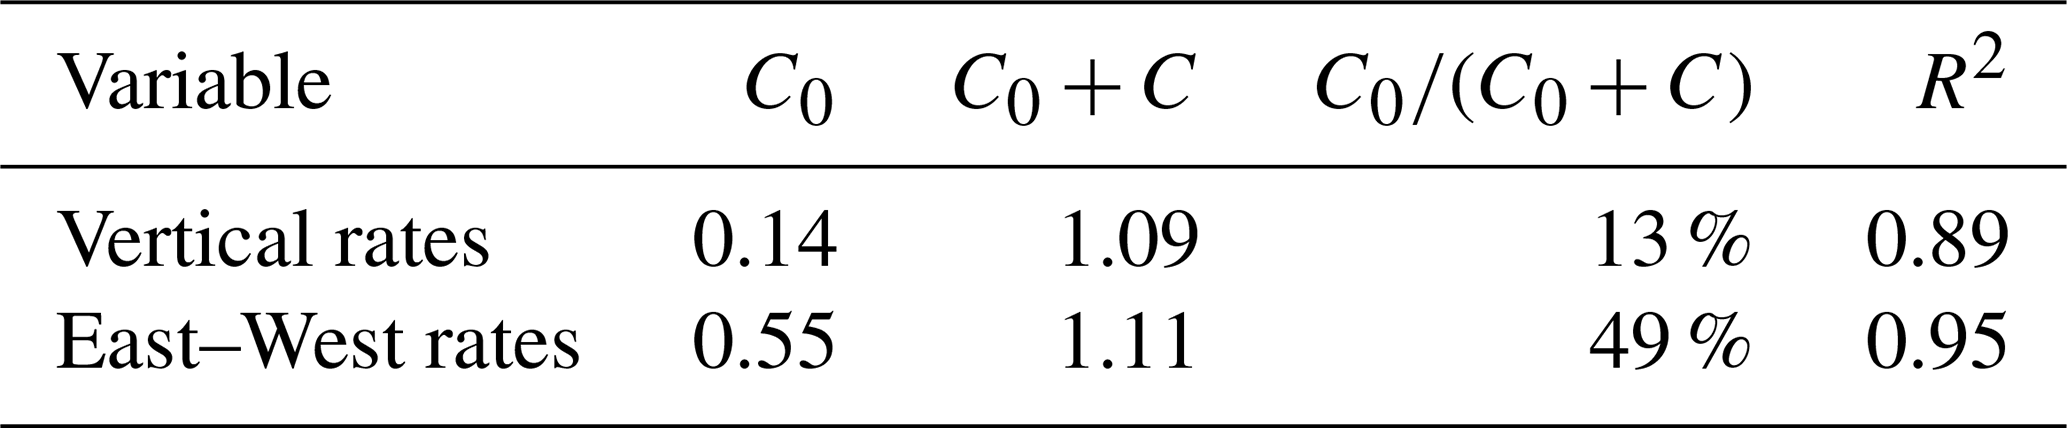
The nugget effect values of the vertical displacement rates and the East–West displacement rates are 13 % and 49 %, respectively. These results indicate that the spatial distribution of the vertical displacement rates was dominated by regional influencing factors, while both regional and local-scale impact factors are important for the distribution of the East-West deformation. This may be because the thickness of the compressible layers, groundwater extraction from confined aquifers or other factors has a strong control effect on the spatial distribution of the vertical displacement, while for the spatial distribution of the East–West displacement, in addition to the effects of crustal movement, the faults, and human activities, like groundwater extraction, may also have an important influence on horizontal movement.
4.3 Relationships Between Impact Factors and Land Subsidence
In this study, the thickness of the compressible layers and the change of the groundwater level in confined aquifers were selected to explore its influences on the vertical and the East–West deformation in the south of the study area. The q values are shown in Table 2.
The results indicate that the spatial distribution of the vertical displacement is dominated by the change of the groundwater level in confined aquifers. Severe land subsidence has taken place in the southwest and southeast of the study area, where the groundwater level decreased with values ranging from 2 to 3 m and more than 3 m, respectively. In the middle part of the study area, the groundwater level has risen 0 to 4 m and the extent and severity of land subsidence were considerably smaller. These results confirm that the change of the groundwater level has a strong influence on the spatial distribution of the vertical displacement. In contrast, the dominant factor of the East-West deformation is not obvious. It can be seen that the q value of the thickness of the compressible layers is close to 0, which indicates that the compressible layers have little effect on the East-West deformation. The q value of the groundwater extraction from confined aquifers is 0.12 and that's probably because exploit groundwater affects horizontal deformation. The East-West deformation around the Shunyi–Liangxiang fault is large and the highest deformation rate up to −13.6 mm yr−1, which indicates that the faults may also affect the horizontal deformation.
Table 2Degree of influence of the thickness of the compressible layers and groundwater level change in confined aquifers on the vertical and the East–West deformation.
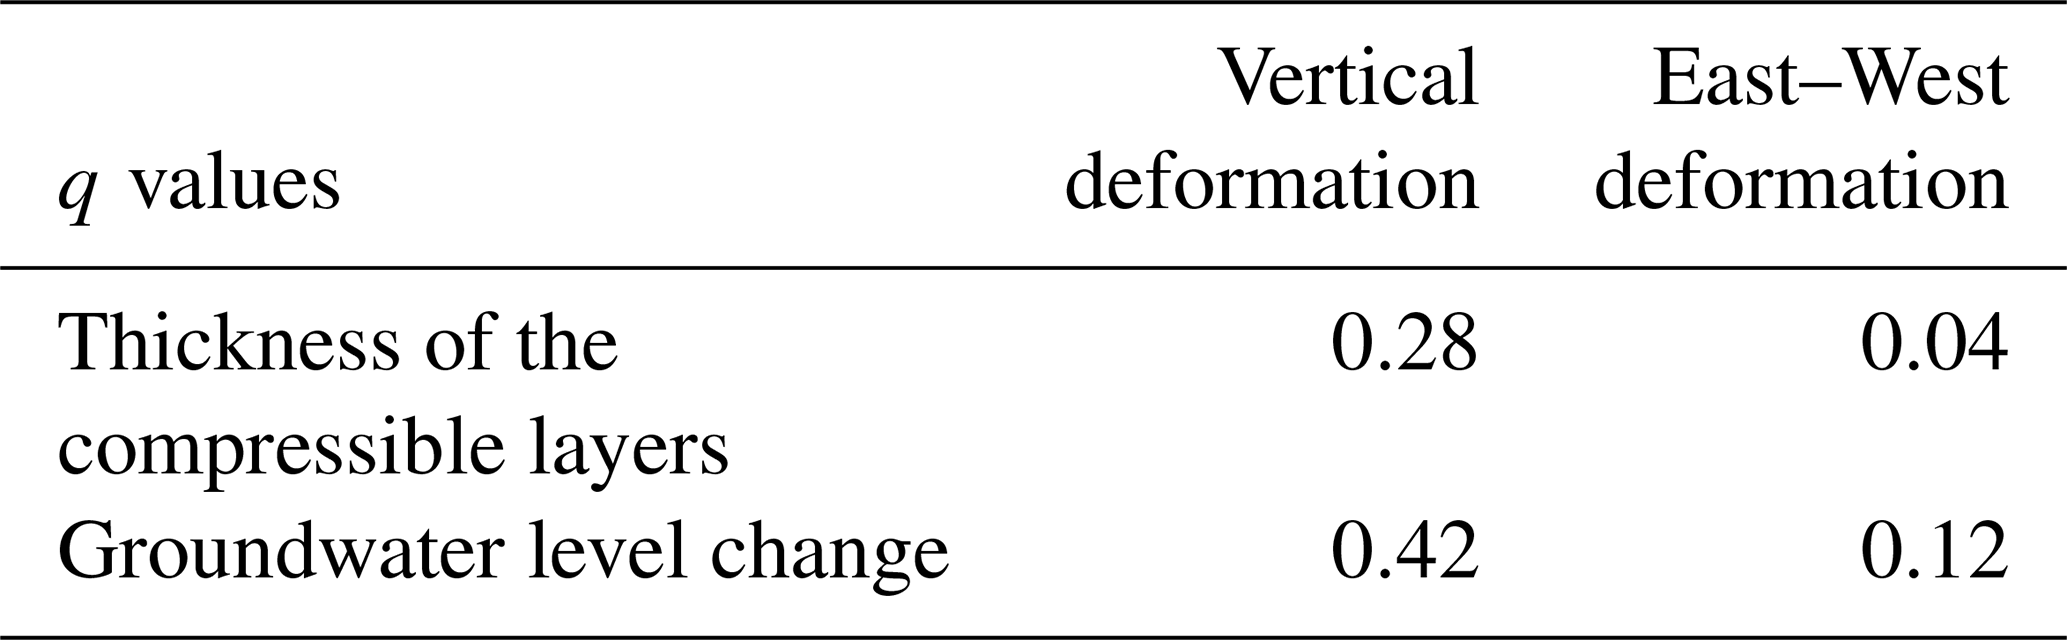
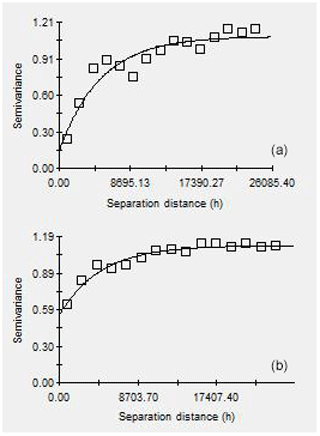
Figure 4A fitted curve of the semi-variogram of (a) the vertical displacement rates and (b) the East-West displacement rates.
Land subsidence in the Chaobai River alluvial fan was analysed based on multiple data acquired from 2015 to 2017. The vertical and the East-West deformation were derived based on the SAR imaging geometry and have been validated using ground-based measurements including levelling and GPS.
The spatial variation characteristics of the vertical and the East-West deformation are different at a regional scale. the spatial distribution of the vertical displacement rates was mainly affected by regional influencing factors. The change of the groundwater level in confined aquifers has a strong influence on the spatial distribution of the vertical displacement. While both regional and local-scale impact factors are important for the distribution of the East-West deformation. The dominant factor of East-West deformation is not obvious. The groundwater extraction from confined aquifers and the faults may affect the horizontal deformation. Moreover, we will try to quantify the influence factors of horizontal deformation in the following studies.
In conclusion, these results provide a better insight into the land subsidence distribution. It will help us better understand the causes of land subsidence and provide scientific evidence for prevention and control.
The data used in this study will be available from the corresponding author on reasonable request.
JZ analysed the data and wrote the paper. HG and LZ provided crucial guidance and support. HL and LZ made important suggestions throughout the research. RC and HS made a great contribution to writing this paper.
The authors declare that they have no conflict of interest.
This article is part of the special issue “TISOLS: the Tenth International Symposium On Land Subsidence – living with subsidence”. It is a result of the Tenth International Symposium on Land Subsidence, Delft, the Netherlands, 17–21 May 2021.
The authors would like to thank the European Space Agency (ESA) for providing the Sentinel-1 data. We also thank the National Aeronautics and Space Administration (NASA) for making the SRTM DEM data available.
This research has been supported by the Beijing National Natural Science Foundation (grant no. 8202008) and Young Yanjing Scholar Program, the Capacity Building for Sci-Tech Innovation- Fundamental Scientific Research Funds (grant no. 025195305000/191).
Chen, M., Tomás, R., and Li, Z. H.: Imaging Land Subsidence Induced by Groundwater Extraction in Beijing (China) Using Satellite Radar Interferometry, Remote Sens., 8, 468, https://doi.org/10.3390/rs8060468, 2016.
Chen, B. B., Gong, H. L., and Li, X. J.: Characterization and causes of land subsidence in Beijing, China, Int. J. Remote Sens., 38, 808–826, https://doi.org/10.1080/01431161.2016.1259674, 2017.
Gong, H. L., Zhang, Y. Q., and Li, X. J.: Land subsidence research in Beijing based on the Permanent Scatterers InSAR technology, Adv. Natural Sci., 19, 1261–1266, 2009 (in Chinese).
Guo, L., Gong, H. L., and Zhu, F.: Analysis of the Spatiotemporal Variation in Land Subsidence on the Beijing Plain, China, Remote Sens., 11, 1170, https://doi.org/10.3390/rs11101170, 2019.
Júnior, V. V., Carvalho, M. P., and Dafonte, J.: Spatial variability of soil water content and mechanical resistance of Brazilian ferralsol, Soil Till Res., 85, 166–177, https://doi.org/10.1016/j.still.2005.01.018, 2006.
Ng, H. M., Ge, L. L., and Li, X. J.: Monitoring ground deformation in Beijing, China with persistent scatterer SAR interferometry, J. Geod., 86, 375–392, https://doi.org/10.1007/s00190-011-0525-4, 2012.
Polcari, M., Palano, M., and Fernández, J.: 3D displacement field retrieved by integrating Sentinel-1 InSAR and GPS data: the 2014 South Napa earthquake, Eur. J. Remote Sens., 49, 1–13, https://doi.org/10.5721/EuJRS20164901, 2016.
Song, W. Z., Jia, H. F., and Li, Z. L.: Using geographical semi-variogram method to quantify the difference between NO2 and PM2.5 spatial distribution characteristics in urban areas, Sci. Total Environ., 631–632, 688–694, https://doi.org/10.1016/j.scitotenv.2018.03.040, 2018.
Wang, J. F., Zhang, T. L., and Fu, B. J.: A measure of spatial stratified heterogeneity, Ecol Indic., 67, 250–256, https://doi.org/10.1016/j.ecolind.2016.02.052, 2010.
Zhu, L., Gong, H. L., and Li, X. J.: Land subsidence due to groundwater withdrawal in the northern Beijing plain, China, Eng. Geol., 193, 243–255, https://doi.org/10.1016/j.enggeo.2015.04.020, 2015.