the Creative Commons Attribution 4.0 License.
the Creative Commons Attribution 4.0 License.
 | 22 Apr 2020
Understanding the dynamic behaviour for the Madrid aquifer (Spain): insights from the integration of A-DInSAR and 3-D groundwater flow and geomechanical models
Roberta Bonì
Claudia Meisina
Pietro Teatini
Francesco Zucca
Claudia Zoccarato
Andrea Franceschini
Pablo Ezquerro
Marta Béjar-Pizarro
José A. Fernández-Merodo
Carolina Guardiola-Albert
José L. Pastor
Roberto Tomás
Gerardo Herrera
Advanced Differential Interferometric Synthetic Aperture Radar (A-DInSAR) techniques and 3-D groundwater flow and geomechanical models are integrated to improve our knowledge about the Tertiary detritic aquifer of Madrid (TDAM). In particular, the attention is focused on the Manzanares-Jarama well field, located to the northwest of Madrid, which experienced five cycles of extensive groundwater withdrawal followed by natural recovery, to cope with the droughts occurred in summer 1995, 1999, 2002, 2006, and 2009. Piezometric records and A-DInSAR data acquired by ERS-1/2 and ENVISAT satellites during the periods 1992–2000 and 2002–2010, respectively, have been used to calibrate the groundwater flow and the geomechanical models. A time-lag of about one month between the hydraulic head changes and the displacements of the land surface has been detected by a joint wavelet analysis of A-DInSAR and piezometer head time series. Overall, the results show the effectiveness of the proposed integrated approach composed of A-DInSAR and 3-D geomechanical model to characterize the aquifer-system response during and after the groundwater withdrawal.
- Article
(10130 KB) - Full-text XML
- BibTeX
- EndNote


Groundwater numerical models provide a quantitative framework to understand the hydrogeological processes and represent a practical tool to comprehend how an aquifer system works (Anderson et al., 2015). Groundwater models integrate numerically the Partial differential equations governing the physical process of the water movement within a defined portion of a porous medium. Modelling design requires to set-up the model boundaries and geometry, provide the aquifer parameters and choose the code able to simulate the physical processes of interest (Anderson et al., 2015). Therefore, the groundwater model conceptualization needs extensive datasets that often lack due to the high costs required to collect.

Figure 1Geographical location from Google Earth, Data SIO, NOAA, U.S., Navy, NGA, GEBCO, US Dept of State Geographer, ©2019 Google, Image Landsat/Copernicus (a) and geological map (b) of the study area. The piezometers and the well locations are also depicted. The geological map is derived from IGME (1995) and the water bodies and the rivers from https://servicio.mapama.gob.es/sia/visualizacion/descargas/mapas.jsp (last access: 2 March 2020).
To remediate, at least in part, this paucity of measurements, in this work a novel methodology using A-DInSAR data as supporting tool for groundwater modelling purposes is presented. The methodology has been developed and tested to understand the dynamic behaviour of the Madrid aquifer. It represents a strategic groundwater resource in Spain, exploited in the past to cope with an increased groundwater demand during drought periods. The achieved results give insight about a fast response of the aquifer-system during and after the extraction periods.
The study area is the Manzanares-Jarama wellfield, that is located northwest of Madrid, in Spain (Fig. 1). The analysed wellfield includes 32 wells, which withdraw groundwater from the “Manzanares-Jarama aquifer”, and 17 observation wells. The analysed aquifer extends for about 540 km2 and represents only a portion of the 2500 km2 Tertiary detritic aquifer (TDAM) located in the tectonic depression of the Madrid basin. The aquifer is a heterogeneous multi-layer system characterized by sand lenses embedded in a clay and clay-sand matrix (Ezquerro et al., 2014). The aquifer includes Tertiary detritical deposits and a Quaternary coverage (Martínez-Santos et al., 2010). The northern and southern boundaries of the aquifer are the Paleozoic relief of the Sierra of Guadarrama and evaporitic materials, respectively (Hernández-García and Custodio, 2004). Conversely, in the western and eastern boundaries areas, the alluvial deposits of the Manzanares and Jarama rivers are found, respectively.
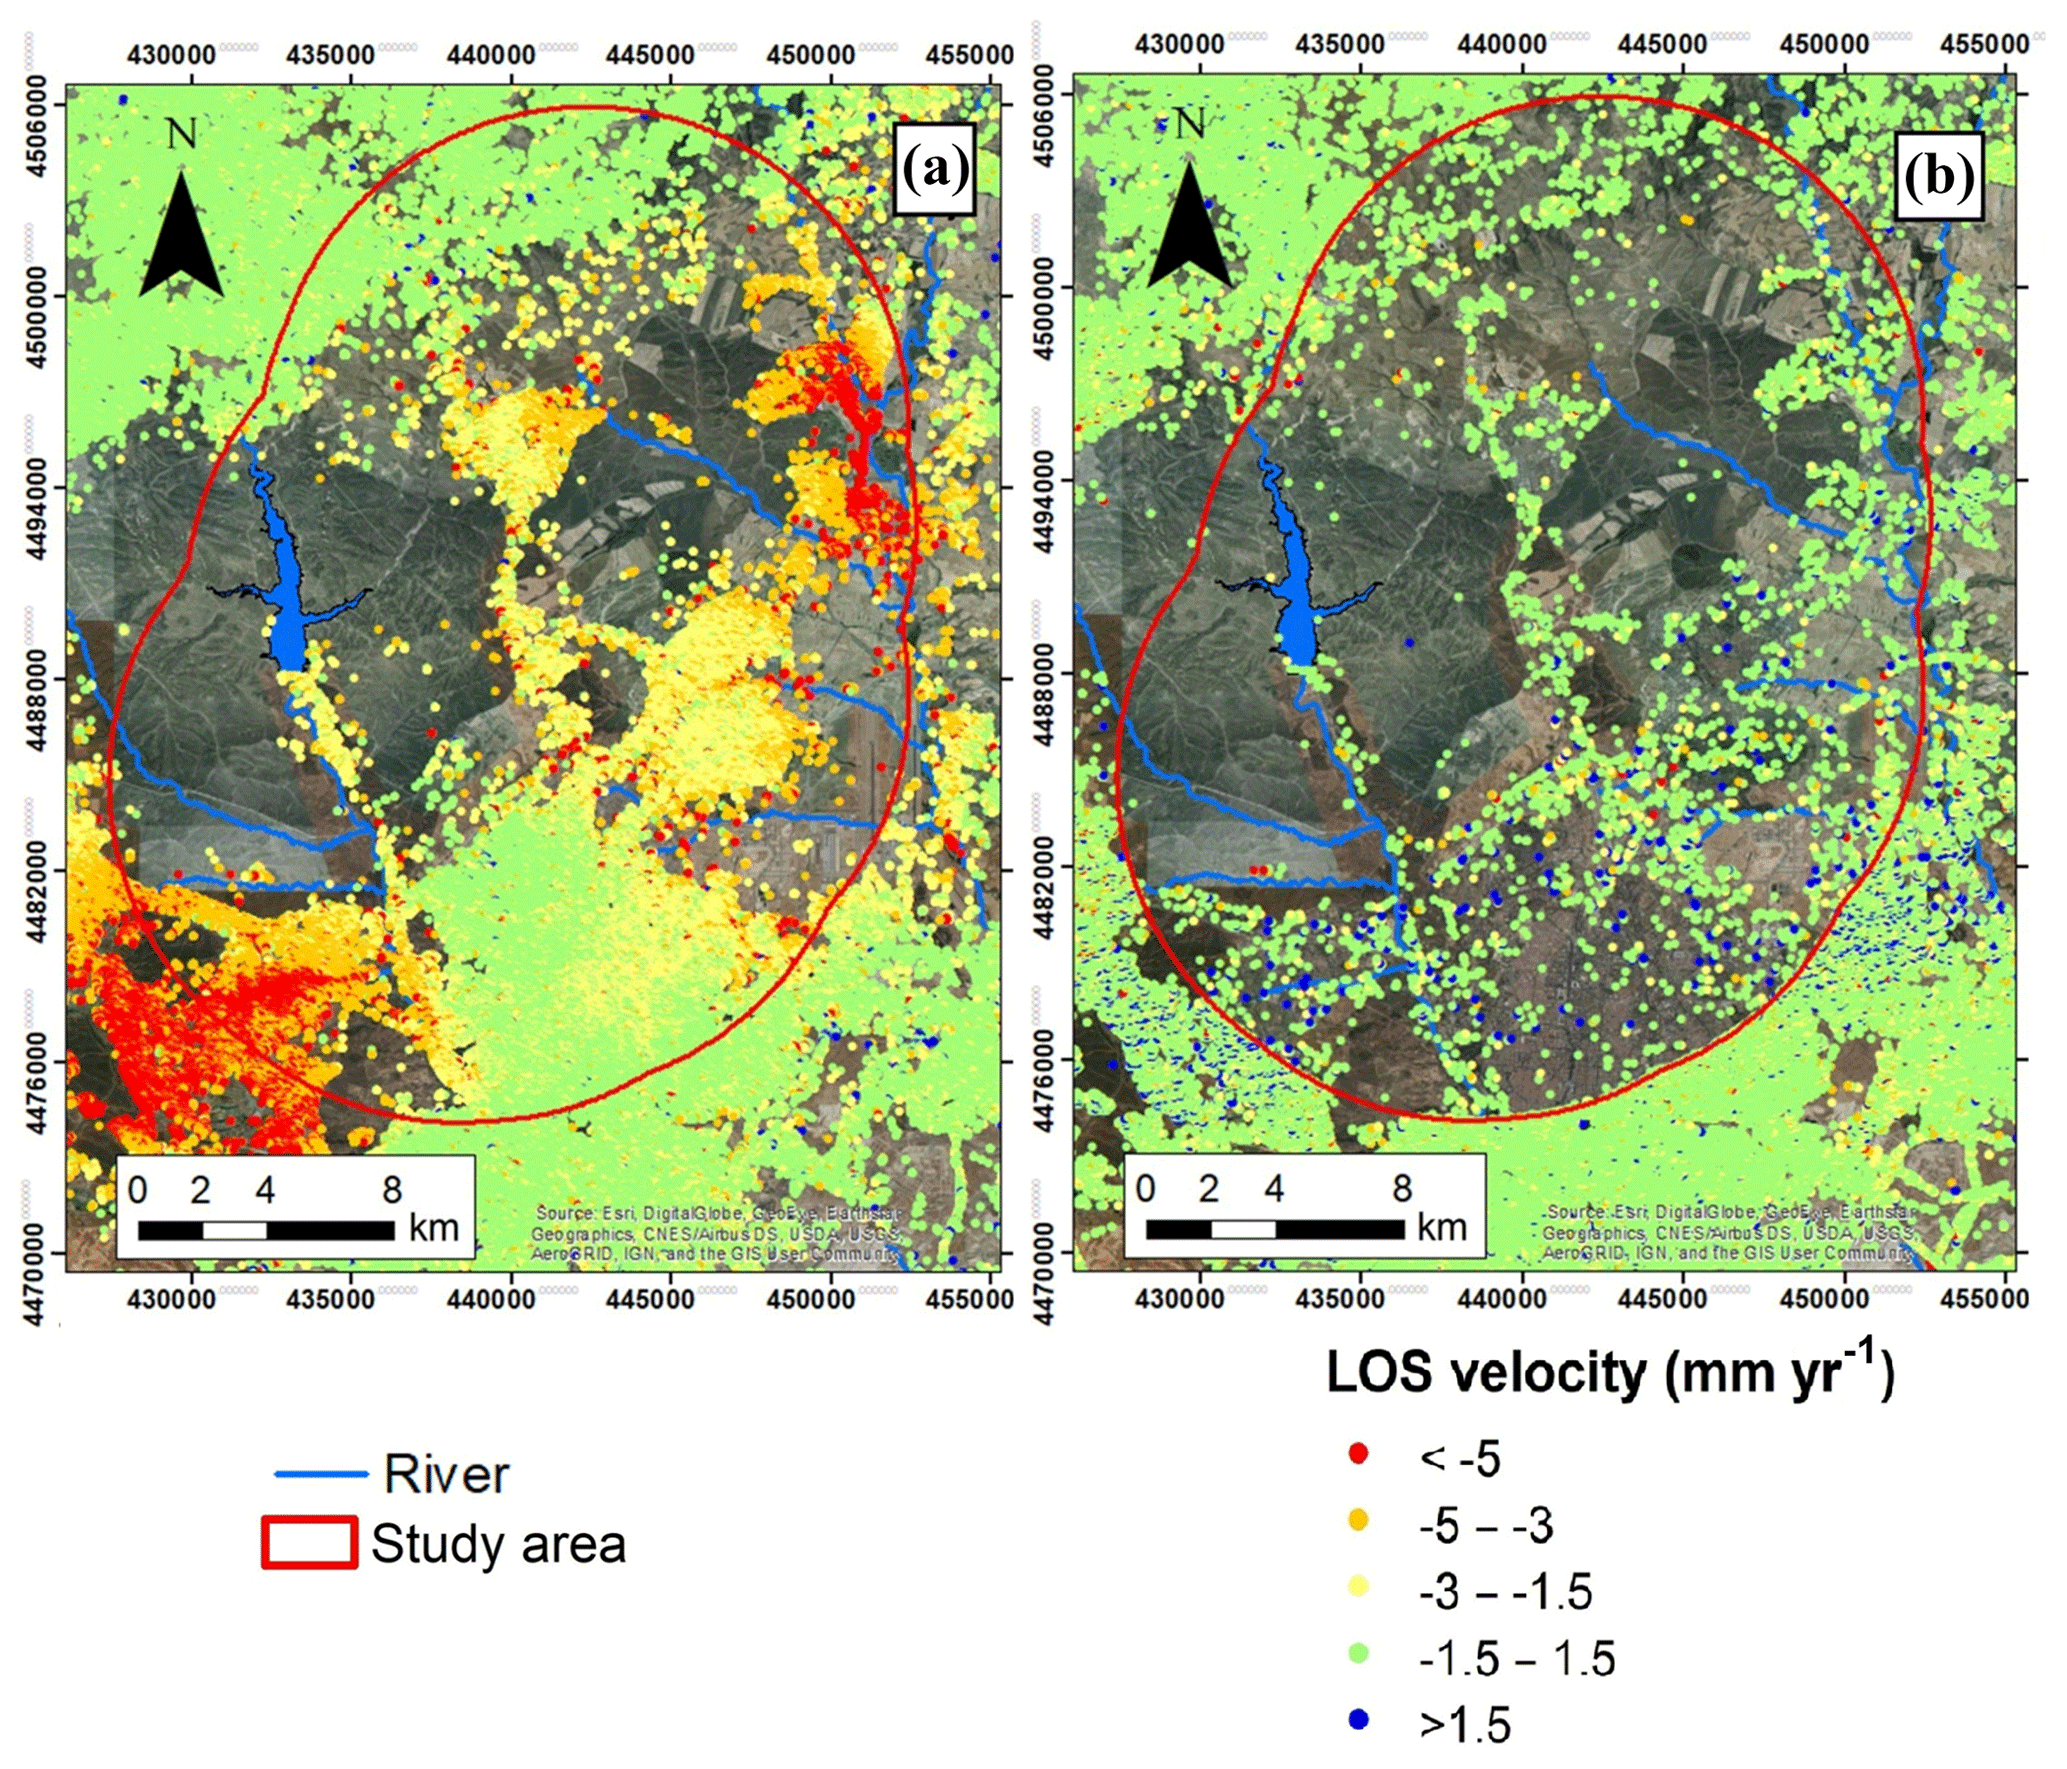
Figure 2Line-of-sight (LOS) velocity maps measured usingERS-1/2 (1992–2000) (a) and ENVISAT (2003–2010) images (b). World imagery Source: Esri, DigitalGlobe, GeoEye, Earthstar Geographics, CNES/Airbus DS, USDA, USGS, AeroGRID, IGN, and the GIS User Community.
3.1 Satellite and piezometric data analysis
The analysed satellite data are Synthetic Aperture Radar (SAR) images acquired by ERS-1/2 and ENVISAT in descending and ascending mode, respectively. The ERS-1/2 images cover the period from April 1992 to November 2000, and the ENVISAT dataset between August 2003 and September 2010. The ERS-1/2 and ENVISAT scenes were processed using the PSP-IFSAR technique (Costantini et al., 2008) to obtain the A-DInSAR dataset including line-of-sight (LOS) displacement time series and average velocity for each target in the periods 1992–2000 and 2003–2010 (Fig. 2).
Available observation well measurements recorded the hydraulic head changes from 1998 to 2012 (Fig. 3) and show three major extraction phases causing a groundwater drawdown of about 100–150 m, corresponding with major drought periods followed by recovery periods (Yélamos and Villarroya, 1991; Canal de Isabel II Gestión, 2014).
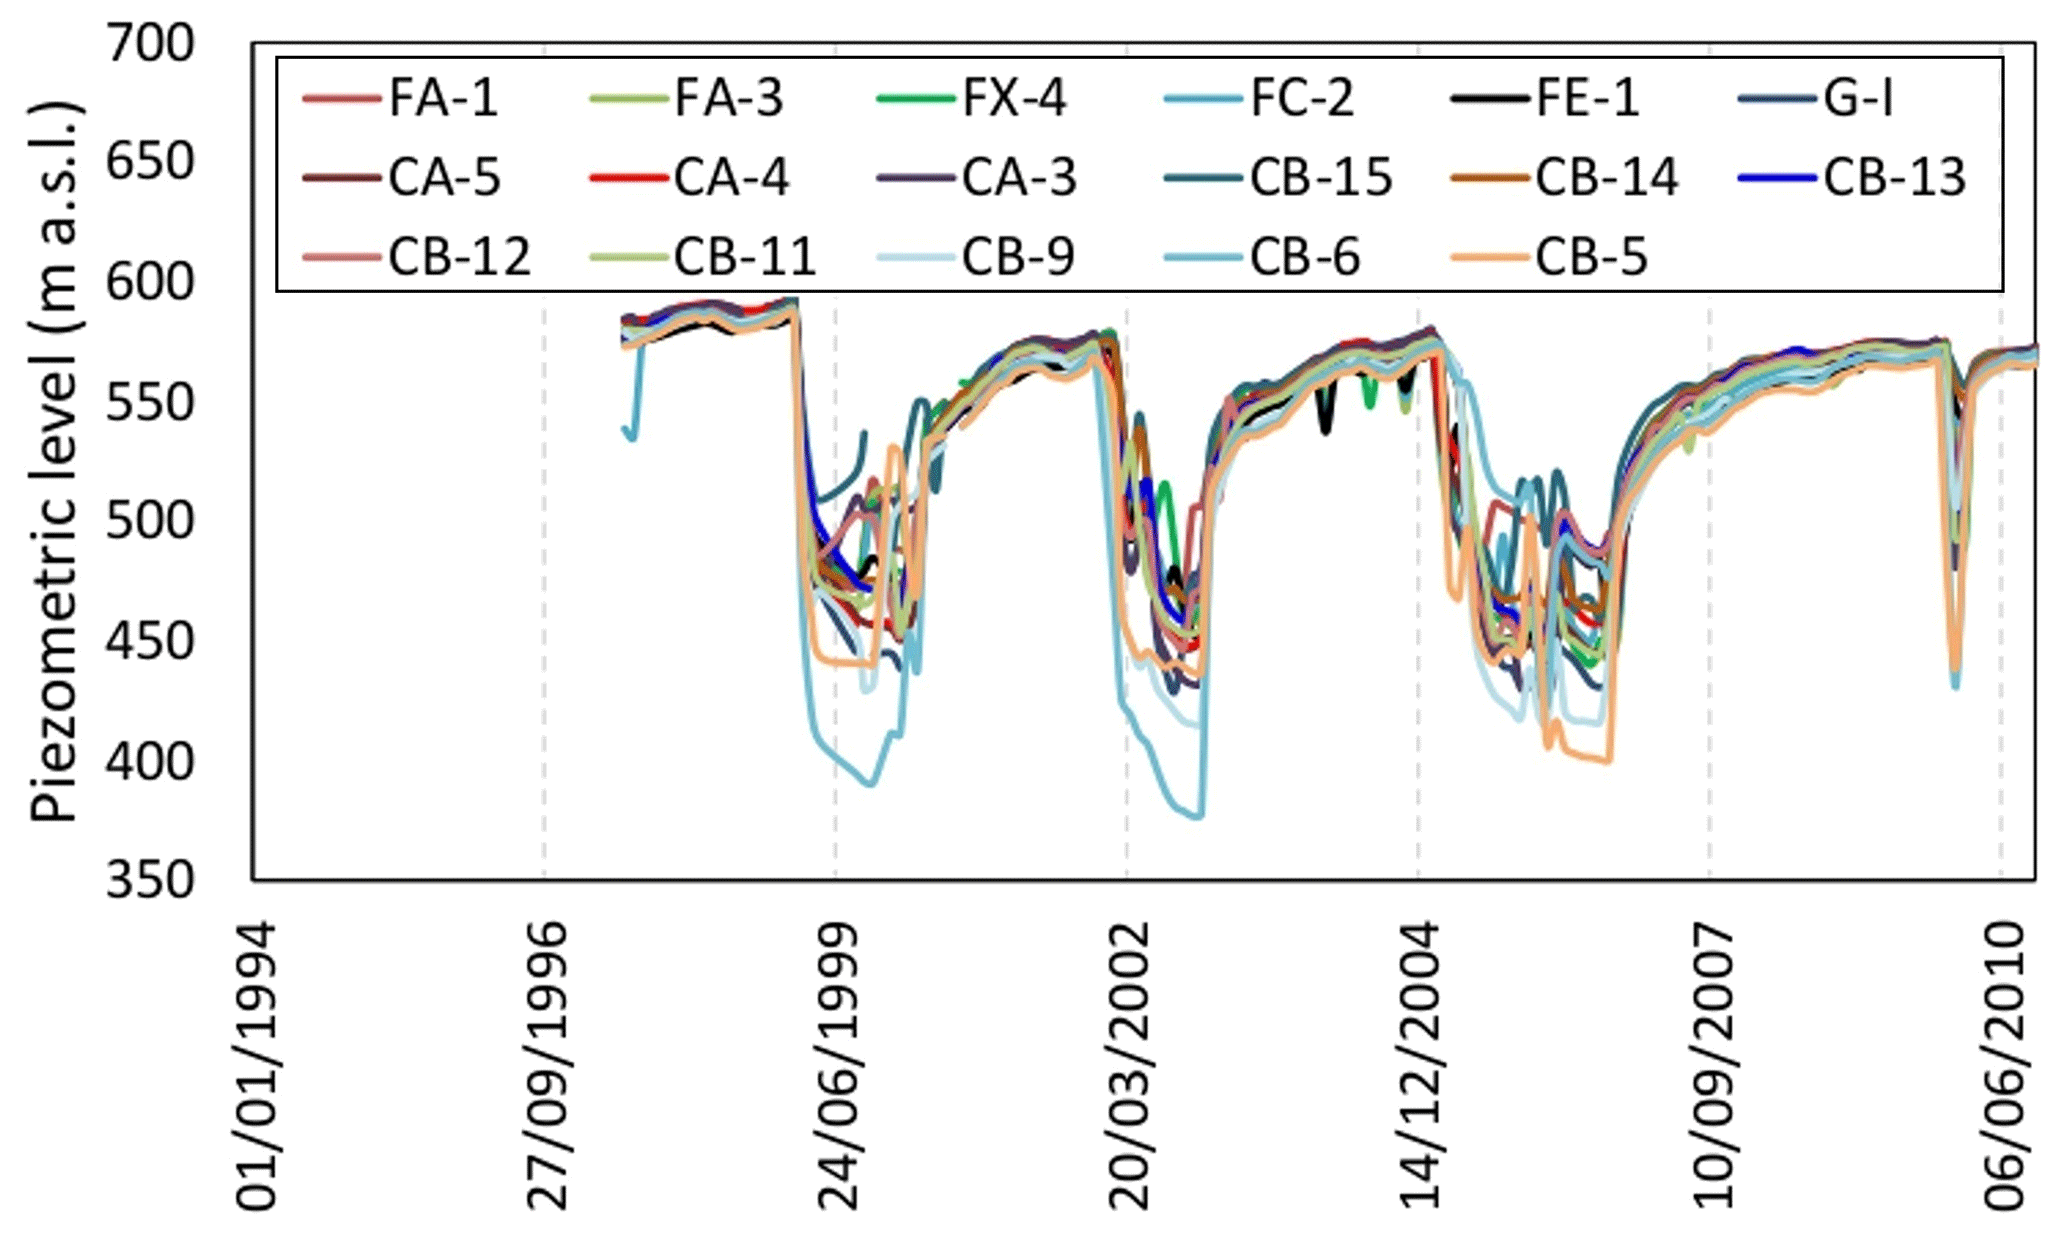
Figure 3Piezometric head time series acquired in the period 1998–2010. The location of the observation wells is reported in Fig. 1b.
The methodology implemented by Tomás et al. (2016), based on a wavelet approach, was used for the joint analysis of the A-DInSAR and piezometric level time series to understand cause-and-effect relationships and to identify intermittent periodicity. On the other hand, Continuous Wavelet Transform (CWT), was applied to identify nonstationary intermittent oscillations in time series data. Cross Wavelet Transform (XWT) and Wavelet Coherence (WTC) were applied to find the common power and relative phase in time-frequency space of two-time series (Grinsted et al., 2004). The result is a 2-D plot of complex numbers. A high absolute value suggests a common time patterns between both time series. Furthermore, the phase (i.e. the angle of the vectors) of the XWT provides a quantification of the time shift (delay time) between the two time-series. It is worth nothing that both the A-DInSAR and piezometric head time series have been preliminary equalized in the time sampling interval using a 35 d interval that corresponds to the revisit time of ERS and ENVISAT. Then, a linear regression of the time series records was used to distinguish linear and non-linear component. The wavelet approach has been applied using the non-linear component resulting from the difference between the original time-series and the fitted linear component.
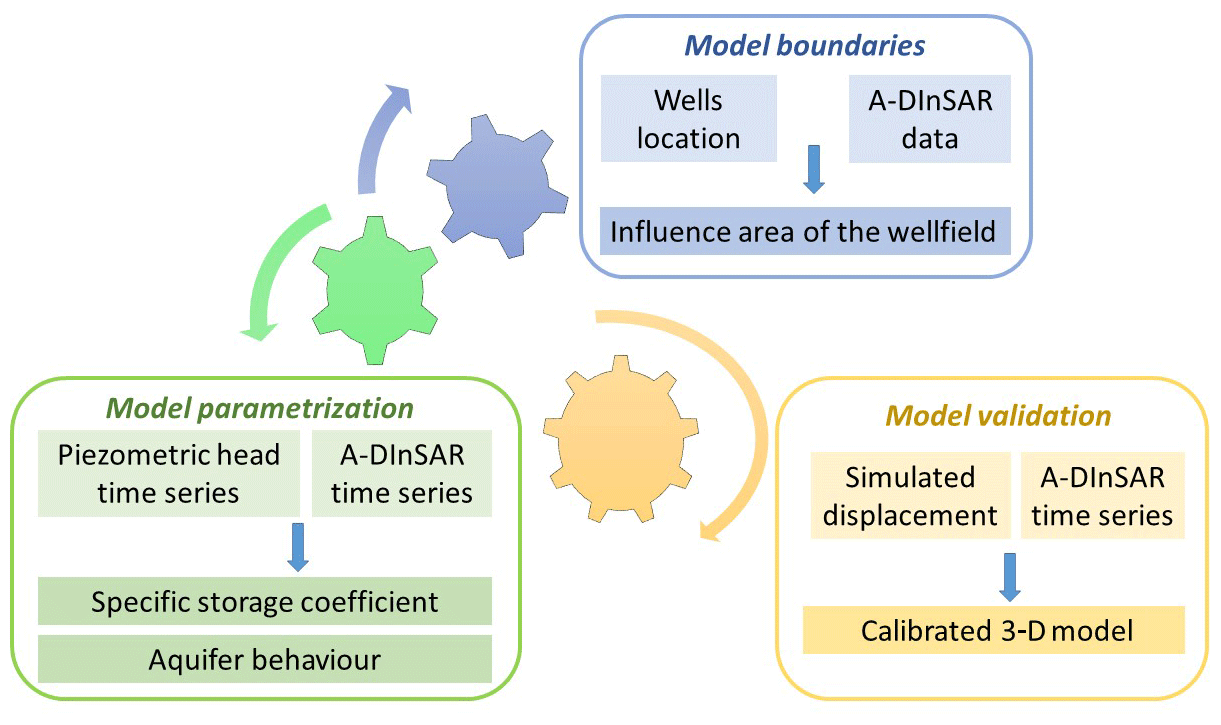
Figure 4Schematic overview of the integrated approach used to reconstruct the 3-D model with the support of A-DInSAR data.
3.2 Integration of the A-DInSAR into numerical models
In this work, the A-DInSAR data are used as supporting tool for different phases of the numerical model reconstruction (Fig. 4). In particular, the A-DInSAR data are exploited to (i) define the lateral boundaries of the static model, (ii) estimate the model parametrization, (iii) choose an appropriate code to simulate the physical processes, and (iv) to calibrate of the model. The joint use of the wellfield location and the average velocities measured by the A-DInSAR technique allows to identifying the influence area of the wellfield. Furthermore, the piezometric head time series and the displacement time series have been jointly used to estimate the aquifer storage (Ss) using a methodology applied by several authors on A-DInSAR-based and extensometers-based displacement measurements (Sneed and Galloway, 2000; Burbey, 2003; Tomás et al., 2010; Bonì et al., 2016). More precisely, the specific storage is computed dividing the bulk storage (Sk) by the aquifer thickness. The bulk storage is estimated using the following equation Eq. (1):
where Δd is the displacement, estimated by the satellite data, and related to the aquifer compaction as a result of the hydraulic head decrease Δh. The joint analysis of A-DInSAR displacements and piezometric head time series, as described in Sect. 3.1, supports the choice of the simulator in the geomechanical model.
Finally, A-DInSAR displacement time series are used for cross-comparison with the simulated displacement to verify the model results.
3.3 Numerical model approaches
The numerical approaches implemented in this work aims simulating groundwater flow and pumping induced land displacements. First of all, a static model is build up to reconstruct the three dimensional geometry including the main hydrogeological layers of the study area. Then, the 3-D static model is used for the hydrogeological and the geomechanical simulations. More precisely, the 3-D finite element (FE) grid of the selected domain is constructed using GEN3-D (Teatini et al., 2006). The groundwater flow model is simulated through the SAT3-D (SATurated Three-Dimensional) code (Teatini et al., 2011) that solves the following equation Eq. (2) (Bear 1972):
where k and h are the hydraulic permeability tensor and the hydraulic head, respectively, t is time, and q is the source/sink term. Ss is the specific storage, which is related to oedometric bulk compressibility cb through the relationship with ϕ the medium porosity and β the volumetric water compressibility. The output of the groundwater flow model is the incremental pore pressure variation (p) due to groundwater pumping that is used as input in the geomechanical model. By assuming an elastic isotropic medium, the SUB3-D code (Teatini et al., 2006) is used to estimate the incremental displacement field u along the x, y, and z directions. SUB3-D solves the following equations Eq. (3) (Verruijt, 1969):
where λ and G are the Lamé constant and shear modulus of porous medium, respectively, is the volumetric strain, and ui is the displacement component along the ith coordinate direction.
It is worth noting that:
and
where E and ν stand for the Young modulus and the Poisson ratio, respectively.
The groundwater flow and geomechanical models are calibrated using a trial and error approach. The hydraulic conductivity was calibrated the records at the piezometric wells starting from values reported by Hernández Torrego (2012) and from values obtained via pumping test for pilot points (e.g. CB5 piezometer, see the location in Fig. 1). The Young modulus and Lamè constants were calibrated using InSAR outcome. Consequently, the solution of Eq. (1) must takes the elastic storage obtained using Eqs. (4) and (5) starting from literature values (Ezquerro et al., 2014). Furthermore, for the geomechanical model the Poisson's ratio ν was set to 0.3, representing a common value used in the case of sedimentary deposits (Teatini et al., 2006).
4.1 Remote assessment of aquifer-system response during and after pumping
The analysis of the A-DInSAR displacement and the piezometric head time series has been performed for 17 piezometers of the Manzanares-Jarama wellfield using the wavelet approach as described in Sect. 3.1. The results provide insight about a mean time lag of 1.0±0.6 months, with minimum and maximum values equal to 0.0 and 3.3 months, respectively. The spatial pattern of the aquifer-system response is slightly larger in the northern sector of the study area. The aquifer-system response during and after pumping is fast, showing land subsidence during the extraction phase coinciding with the drought periods, and uplift in the recovery phase, providing fundamental information about the governing parameters controlling the hydro-geomechanical response.

Figure 53-D model of the Manzanares-Jarama wellfield (a) and simulated and observed displacement at piezometer FE-1. (b) See the location in Fig. 1. The observed displacements are an average value of the values measured on the PS located within a buffer zone of 1000 m from the well, therefore also the standard deviation is reported.
4.2 Numerical simulation of aquifer-system response during and after pumping
The join analysis of the satellite and piezometric data has provided fundamental information to design and calibrate the 3-D model of the Manzanares-Jarama well field. In particular, the model has been built including three main hydrogeological units; i.e. the upper phreatic aquifer, the intermediate aquitard and the lower confined aquifer (Fig. 5a). The model domain extends for the upper 700 m of the sedimentary sequence, whose top and bottom maps have been extracted by the ground surface elevation using the high resolution 5 m cell digital elevation model from Instituto Geográfico Nacional (IGN) and geological information (IGME, 1989). Since the piezometric drawdown caused by the wellfield did not reach a distance larger than 10 km from the wells, (Ezquerro et al., 2014; Béjar-Pizarro et al., 2017), the horizontally domain extends in order to account a buffer ring of 10 km around the wellfield. The aquifer's dynamic has been simulated during the period from 1994 to 2010, that includes four 1–1.5 year long periods of groundwater withdrawal. The modelling results show that the periods of groundwater extraction caused a land subsidence higher than 20 mm over an area of about 190 km2 and a maximum horizontal movement up to 6 mm. The simulated displacement generally agrees with the A-DInSAR measurements, capturing the minimum and maximum peak values (Fig. 5b). Furthermore, the calibrated model has allowed quantifying the land surface movements in the central zone of the study areas where A-DInSAR displacements are unavailable due to the presence of vegetation coverage.
In this work, the potential of the integrated use of A-DInSAR data and 3-D groundwater flow and geomechanical models to capture and assess aquifer dynamics is shown. The approach has been applied to investigate the response during and after pumping of a portion of the Madrid aquifer. The aquifer-system has been characterized by a time-lag of about one month only between the hydraulic head changes and the land displacements, suggesting that the clayey units within the aquifer-system play a minor role.
All data generated or analysed during this study are included in this published article.
RB built the three-dimensional numerical modeling for the Manzanares-Jarama wellfield and prepared the manuscript. CM provided support and guidance throughout the research process for the geological interpretation of the data. PT provided a guidance to build the groundwater flow and geomechanical models and he contributed to the analysis of the results. CZ and AF from UniPD supported the development of the groundwater flow and geomechanical models. FZ supported the numerical modeling and the interpretation of the results. GH provided the geological, the hydrogeological and A-DInSAR data and supported their analysis. PE and MBP from IGME supply the geological and hydrogeological interpretation of the study area. JAFM supported the interpretation of the geomechanical model. CGA provided a guidance for the interpretation of the groundwater flow model. RT and JLP performed the wavelet analysis. All authors co-wrote and reviewed the manuscript.
The authors declare that they have no conflict of interest.
This article is part of the special issue “TISOLS: the Tenth International Symposium On Land Subsidence – living with subsidence”. It is a result of the Tenth International Symposium on Land Subsidence, Delft, the Netherlands, 17–21 May 2021.
The research was funded by University of Pavia in the framework of a research grant award “assegno di tipo A premiale” for research activities at the Dept. of Earth and Environmental Sciences, within the research project entitled “Sustainable groundwater resources management by integrating A-DInSAR derived monitoring and flow modeling results” assigned to Roberta Bonì in March 2019 (supv. Claudia Meisina). The activity has been developed within the scientific collaboration established in the framework of the UNESCO Land Subsidence International Initiative (LaSII, https://www.landsubsidence-unesco.org/, last access: 2 March 2020).
This research has been supported by the Università degli Studi di Pavia (Assegno di tipo A premiale: “Sustainable groundwater resources management by integrating A-DInSAR derived monitoring and flow modeling results” assigned to Roberta Bonì in March 2019) and the Spanish Ministry of Economy, Industry and Competitiveness (MINECO), the State Agency of Research (AEI), and the European Funds for Regional Development (FEDER) (grant no. TEC2017-85244-C2-1-P).
Anderson, M. P., Woessner, W. W., and Hunt, R. J.: Applied groundwater modeling: simulation of flow and advective transport, Academic press, 2015.
Bear, J.: Dynamics of fluids in porous materials, Society of Petroleum Engineers: Dallas, TX, USA, 1972.
Béjar-Pizarro, M., Ezquerro, P., Herrera, G., Tomás, R., Guardiola-Albert, C., Hernández, J. M. R., Fernández Merodo, J. A., Marchamalo, M., and Martínez, R.: Mapping groundwater level and aquifer storage variations from InSAR measurements in the Madrid aquifer, Central Spain, J. Hydrol., 547, 678–689, 2017.
Bonì, R., Cigna, F., Bricker, S., Meisina, C., and McCormack, H.: Characterisation of hydraulic head changes and aquifer properties in the London Basin using Persistent Scatterer Interferometry ground motion data, J. Hydrol., 540, 835–849, 2016.
Burbey, T. J.: Use of time-subsidence data during pumping to characterize specific storage and hydraulic conductivity of semiconfining units, J. Hydrol., 281, 3–22, 2003.
Canal de Isabel II Gestión: Captación de aguas de superficie y subterraneas, Technical report, 2014 (in Spanish).
Costantini, M., Falco, S., Malvarosa, F., and Minati, F.: A new method for identification and analysis of persistent scatterers in series of SAR images, in: Geoscience and Remote Sensing Symposium, IGARSS 2008, IEEE International 2008, 6–11 July 2008, 2, II-449, 2008.
Ezquerro, P., Herrera, G., Marchamalo, M., Tomás, R., Béjar-Pizarro, M., and Martínez, R.: A quasi-elastic aquifer deformational behavior: Madrid aquifer case study, J. Hydrol., 519, 1192–1204, 2014.
Grinsted, A., Moore, J. C., and Jevrejeva, S.: Application of the cross wavelet transform and wavelet coherence to geophysical time series, Nonlin. Processes Geophys., 11, 561–566, https://doi.org/10.5194/npg-11-561-2004, 2004.
Hernández-García, M. E. and Custodio, E.: Natural baseline quality of Madrid Tertiary Detrital Aquifer groundwater (Spain): a basis for aquifer management, Environ. Geol., 46, 173–188, 2004.
Hernández Torrego, E.: La recarga profunda de agua en las masas 003-010 y 003-011 del acuífero detrítico terciario de la fosa del Tajo (Madrid), PhD thesis, 2012.
IGME: Geological Map of Spain, region 559, Technical report, available at: http://info.igme.es/cartografiadigital/geologica/Magna (last access: 21 May 2019), 1989 (in Spanish).
IGME: Mapa Geológico de la Península Ibérica, Baleares y Canarias a escala 1:1.000.000, edición, 1995.
Martínez-Santos, P., Pedretti, D., Martínez-Alfaro, P. E., Conde, M., and Casado, M.: Modelling the effects of groundwater-based urban supply in Low-permeability aquifers: application to the Madrid Aquifer, Spain, Water Resour. Manag., 24, 4613–4638, 2010.
Sneed, M. and Galloway, D. L.: Aquifer-system compaction and land subsidence: measurements, analyses, and simulations: the Holly site, Edwards Air Force Base, Antelope Valley, California, US Geol Surv Water-Resour Invest Rep, 00-4015, 65 pp., 2000.
Teatini, P., Ferronato, M., Gambolati, G., and Gonella, M.: Groundwater pumping and land subsidence in the Emilia-Romagna coastland, Italy: Modeling the past occurrence and the future trend, Water Resour. Res., 42, https://doi.org/10.1029/2005WR004242, 2006.
Teatini, P., Ferronato, M., Gambolati, G., Baù, D., and Putti, M.: Anthropogenic Venice uplift by seawater pumping into a heterogeneous aquifer system, Water Resour. Res., 46, W11547, https://doi.org/10.1029/2010WR009161, 2011.
Tomás, R., Herrera, G., Delgado, J., Lopez-Sanchez, J. M., Mallorquí, J. J., and Mulas, J.: A ground subsidence study based on DInSAR data: calibration of soil parameters and subsidence prediction in Murcia City (Spain), Eng. Geol., 111, 19–30, 2010.
Tomás, R., Li, Z., Lopez-Sanchez, J. M., Liu, P., and Singleton, A.: Using wavelet tools to analyse seasonal variations from InSAR time-series data: a case study of the Huangtupo landslide, Landslides, 13, 437–450, https://doi.org/10.1007/s10346-015-0589-y, 2016.
Verruijt, A.: Elastic storage of aquifers, in: Flow Through Porous Media, edited by: De Wiest, R., Elsevier, NY, 331–376, 1969.
Yélamos, J. G. and Villarroya, F. I.: Variación de la piezometría y el caudal en cuatro explotaciones de aguas subterráneas en el acuífero del Terciario detrítico de Madrid, Bol. Geol. Min, 102, 857–874, 1991.